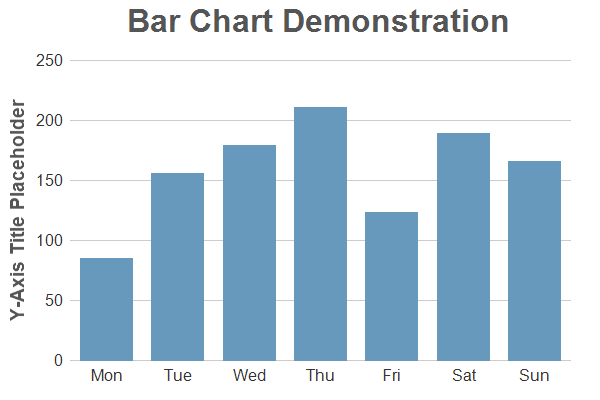
This example extends the
Simple Bar Chart (1) example to demonstrates various methods to control the chart appearance and to add titles.
- Use XYChart.setPlotArea to configure the plot area to have transparent border and light grey (CCCCCC) grid lines.
- Use BaseChart.addTitle and Axis.setTitle to add chart and axis titles.
- Use Axis.setColors to set the axis stem and ticks to Transparent.
- Use Axis.setLabelStyle to set the label style to grey 12pt Arial.
- Use XYChart.addBarLayer to add a bar layer with light navy blue color (6699BB).
- Use Layer.setBorderColor to configure the border color to Transparent to disable the bar border.
- Use Axis.setTickDensity to configure a minimum label spacing for automatically generated labels. Although a chart will be more precise with more axis labels so long as they do not overlap, sometimes less labels are desirable for aesthetic reasons. Setting the minimum label spacing can control the label density without knowing how many labels would be produced (which depends on actual data).
[JSP Version] jspdemo/simplebar2.jsp
<%@page import="ChartDirector.*, java.util.*" %>
<%
// The data for the bar chart
double[] data = {85, 156, 179, 211, 123, 189, 166};

// The labels for the bar chart
String[] labels = {"Mon", "Tue", "Wed", "Thu", "Fri", "Sat", "Sun"};

// Create a XYChart object of size 600 x 400 pixels
XYChart c = new XYChart(600, 400);

// Add a title box using grey (0x555555) 24pt Arial Bold font
c.addTitle("    Bar Chart Demonstration", "Arial Bold", 24, 0x555555);

// Set the plotarea at (70, 60) and of size 500 x 300 pixels, with transparent background and border
// and light grey (0xcccccc) horizontal grid lines
c.setPlotArea(70, 60, 500, 300, Chart.Transparent, -1, Chart.Transparent, 0xcccccc);

// Set the x and y axis stems to transparent and the label font to 12pt Arial
c.xAxis().setColors(Chart.Transparent);
c.yAxis().setColors(Chart.Transparent);
c.xAxis().setLabelStyle("Arial", 12);
c.yAxis().setLabelStyle("Arial", 12);

// Add a blue (0x6699bb) bar chart layer with transparent border using the given data
c.addBarLayer(data, 0x6699bb).setBorderColor(Chart.Transparent);

// Set the labels on the x axis.
c.xAxis().setLabels(labels);

// For the automatic y-axis labels, set the minimum spacing to 40 pixels.
c.yAxis().setTickDensity(40);

// Add a title to the y axis using dark grey (0x555555) 14pt Arial Bold font
c.yAxis().setTitle("Y-Axis Title Placeholder", "Arial Bold", 14, 0x555555);

// Output the chart
WebChartViewer viewer = new WebChartViewer(request, "chart1");
viewer.setChart(c, Chart.SVG);

// Include tool tip for the chart
viewer.setImageMap(c.getHTMLImageMap("", "", "title='{xLabel}: {value} kg'"));
%>
<!DOCTYPE html>
<html>
<head>
    <title>Simple Bar Chart (2)</title>
    <!-- Include ChartDirector Javascript Library to support chart interactions -->
    <script type="text/javascript" src="cdjcv.js"></script>
</head>
<body style="margin:5px 0px 0px 5px">
    <div style="font:bold 18pt verdana;">
        Simple Bar Chart (2)
    </div>
    <hr style="border:solid 1px #000080; background:#000080" />
    <div style="font:10pt verdana; margin-bottom:1.5em">
        <a href="viewsource.jsp?file=<%=request.getServletPath()%>">View Source Code</a>
    </div>
    <!-- ****** Here is the chart image ****** -->
    <%= viewer.renderHTML(response) %>
</body>
</html>
© 2021 Advanced Software Engineering Limited. All rights reserved.