This example demonstrates the basic steps in creating line charts.
[JSP Version] jspdemo/simpleline.jsp
<%@page import="ChartDirector.*, java.util.*" %>
<%
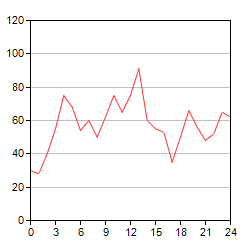
// The data for the line chart
double[] data = {30, 28, 40, 55, 75, 68, 54, 60, 50, 62, 75, 65, 75, 91, 60, 55, 53, 35, 50, 66, 56,
48, 52, 65, 62};
// The labels for the line chart
String[] labels = {"0", "1", "2", "3", "4", "5", "6", "7", "8", "9", "10", "11", "12", "13", "14",
"15", "16", "17", "18", "19", "20", "21", "22", "23", "24"};
// Create a XYChart object of size 250 x 250 pixels
XYChart c = new XYChart(250, 250);
// Set the plotarea at (30, 20) and of size 200 x 200 pixels
c.setPlotArea(30, 20, 200, 200);
// Add a line chart layer using the given data
c.addLineLayer(data);
// Set the labels on the x axis.
c.xAxis().setLabels(labels);
// Display 1 out of 3 labels on the x-axis.
c.xAxis().setLabelStep(3);
// Output the chart
WebChartViewer viewer = new WebChartViewer(request, "chart1");
viewer.setChart(c, Chart.SVG);
// Include tool tip for the chart
viewer.setImageMap(c.getHTMLImageMap("", "", "title='Hour {xLabel}: Traffic {value} GBytes'"));
%>
<!DOCTYPE html>
<html>
<head>
<title>Simple Line Chart</title>
<!-- Include ChartDirector Javascript Library to support chart interactions -->
<script type="text/javascript" src="cdjcv.js"></script>
</head>
<body style="margin:5px 0px 0px 5px">
<div style="font:bold 18pt verdana;">
Simple Line Chart
</div>
<hr style="border:solid 1px #000080; background:#000080" />
<div style="font:10pt verdana; margin-bottom:1.5em">
<a href="viewsource.jsp?file=<%=request.getServletPath()%>">View Source Code</a>
</div>
<!-- ****** Here is the chart image ****** -->
<%= viewer.renderHTML(response) %>
</body>
</html>
© 2021 Advanced Software Engineering Limited. All rights reserved.