This example demonstrates the basic steps in creating radar charts.
[JSP Version] jspdemo/simpleradar.jsp
<%@page import="ChartDirector.*, java.util.*" %>
<%
// The data for the chart
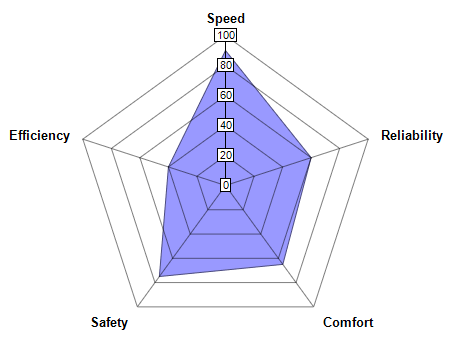
double[] data = {90, 60, 65, 75, 40};
// The labels for the chart
String[] labels = {"Speed", "Reliability", "Comfort", "Safety", "Efficiency"};
// Create a PolarChart object of size 450 x 350 pixels
PolarChart c = new PolarChart(450, 350);
// Set center of plot area at (225, 185) with radius 150 pixels
c.setPlotArea(225, 185, 150);
// Add an area layer to the polar chart
c.addAreaLayer(data, 0x9999ff);
// Set the labels to the angular axis as spokes
c.angularAxis().setLabels(labels);
// Output the chart
WebChartViewer viewer = new WebChartViewer(request, "chart1");
viewer.setChart(c, Chart.SVG);
// Include tool tip for the chart
viewer.setImageMap(c.getHTMLImageMap("", "", "title='{label}: score = {value}'"));
%>
<!DOCTYPE html>
<html>
<head>
<title>Simple Radar Chart</title>
<!-- Include ChartDirector Javascript Library to support chart interactions -->
<script type="text/javascript" src="cdjcv.js"></script>
</head>
<body style="margin:5px 0px 0px 5px">
<div style="font:bold 18pt verdana;">
Simple Radar Chart
</div>
<hr style="border:solid 1px #000080; background:#000080" />
<div style="font:10pt verdana; margin-bottom:1.5em">
<a href="viewsource.jsp?file=<%=request.getServletPath()%>">View Source Code</a>
</div>
<!-- ****** Here is the chart image ****** -->
<%= viewer.renderHTML(response) %>
</body>
</html>
© 2021 Advanced Software Engineering Limited. All rights reserved.