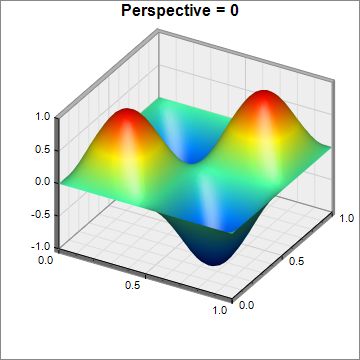
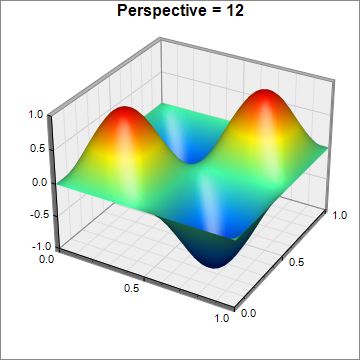
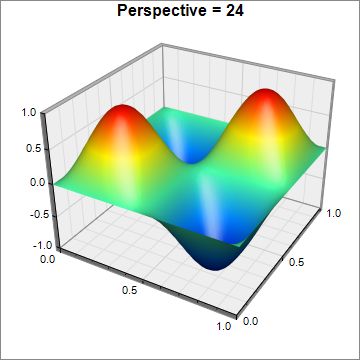
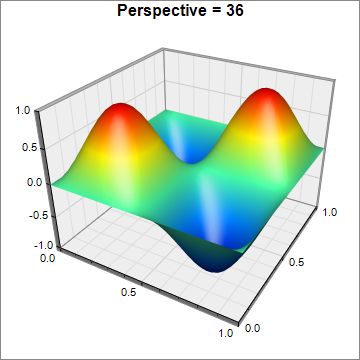
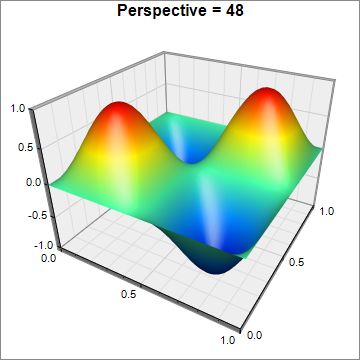
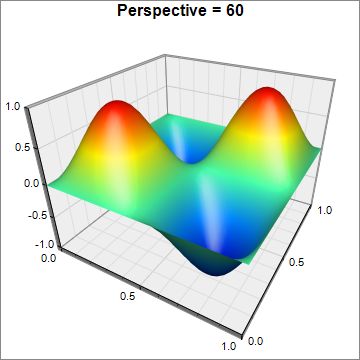
This example demonstrates the effects of various perspective depth, configured using ThreeDChart.setPerspective.
ChartDirector 7.0 (Java Edition)
Surface Perspective
Source Code Listing
<%@page import="ChartDirector.*, java.util.*" %>
<%!
// Function to create the demo charts
void createChart(WebChartViewer viewer, int chartIndex)
{
    // The x and y coordinates of the grid
    double[] dataX = {0, 0.1, 0.2, 0.3, 0.4, 0.5, 0.6, 0.7, 0.8, 0.9, 1.0};
    double[] dataY = {0, 0.1, 0.2, 0.3, 0.4, 0.5, 0.6, 0.7, 0.8, 0.9, 1.0};

    // The values at the grid points. In this example, we will compute the values using the formula
    // z = sin((x - 0.5) * 2 * pi) * sin((y - 0.5) * 2 * pi)
    double[] dataZ = new double[dataX.length * dataY.length];
    for(int yIndex = 0; yIndex < dataY.length; ++yIndex) {
        double y = (dataY[yIndex] - 0.5) * 2 * 3.1416;
        for(int xIndex = 0; xIndex < dataX.length; ++xIndex) {
            double x = (dataX[xIndex] - 0.5) * 2 * 3.1416;
            dataZ[yIndex * dataX.length + xIndex] = Math.sin(x) * Math.sin(y);
        }
    }

    // the perspective level
    int perspective = chartIndex * 12;

    // Create a SurfaceChart object of size 360 x 360 pixels, with white (ffffff) background and
    // grey (888888) border.
    SurfaceChart c = new SurfaceChart(360, 360, 0xffffff, 0x888888);

    // Set the perspective level
    c.setPerspective(perspective);
    c.addTitle("Perspective = " + perspective);

    // Set the center of the plot region at (195, 165), and set width x depth x height to 200 x 200
    // x 150 pixels
    c.setPlotRegion(195, 165, 200, 200, 150);

    // Set the plot region wall thichness to 5 pixels
    c.setWallThickness(5);

    // Set the elevation and rotation angles to 30 and 30 degrees
    c.setViewAngle(30, 30);

    // Set the data to use to plot the chart
    c.setData(dataX, dataY, dataZ);

    // Spline interpolate data to a 40 x 40 grid for a smooth surface
    c.setInterpolation(40, 40);

    // Use smooth gradient coloring.
    c.colorAxis().setColorGradient();

    // Output the chart
    viewer.setChart(c, Chart.SVG);
}
%>
<%
// This example includes 6 charts
WebChartViewer[] viewers = new WebChartViewer[6];
for (int i = 0; i < viewers.length; ++i) {
    viewers[i] = new WebChartViewer(request, "chart" + i);
    createChart(viewers[i], i);
}
%>
<!DOCTYPE html>
<html>
<head>
    <title>Surface Perspective</title>
    <!-- Include ChartDirector Javascript Library to support chart interactions -->
    <script type="text/javascript" src="cdjcv.js"></script>
</head>
<body style="margin:5px 0px 0px 5px">
    <div style="font:bold 18pt verdana;">
        Surface Perspective
    </div>
    <hr style="border:solid 1px #000080; background:#000080" />
    <div style="font:10pt verdana; margin-bottom:1.5em">
        <a href="viewsource.jsp?file=<%=request.getServletPath()%>">View Source Code</a>
    </div>
    <!-- ****** Here are the chart images ****** -->
    <%
        for (int i = 0; i < viewers.length; ++i) {
            out.write(viewers[i].renderHTML(response));
            out.write(" ");
        }
    %>
</body>
</html>