This example demonstrates using Layer.set3D to set the bars to 3D style.
ChartDirector 7.0 (Java Edition)
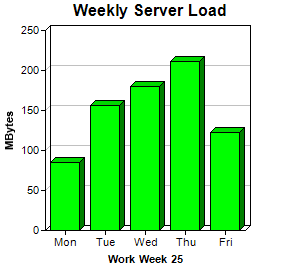
3D Bar Chart
Source Code Listing
<%@page import="ChartDirector.*, java.util.*" %>
<%
// The data for the bar chart
double[] data = {85, 156, 179.5, 211, 123};

// The labels for the bar chart
String[] labels = {"Mon", "Tue", "Wed", "Thu", "Fri"};

// Create a XYChart object of size 300 x 280 pixels
XYChart c = new XYChart(300, 280);

// Set the plotarea at (45, 30) and of size 200 x 200 pixels
c.setPlotArea(45, 30, 200, 200);

// Add a title to the chart
c.addTitle("Weekly Server Load");

// Add a title to the y axis
c.yAxis().setTitle("MBytes");

// Add a title to the x axis
c.xAxis().setTitle("Work Week 25");

// Add a bar chart layer with green (0x00ff00) bars using the given data
c.addBarLayer(data, 0x00ff00).set3D();

// Set the labels on the x axis.
c.xAxis().setLabels(labels);

// Output the chart
WebChartViewer viewer = new WebChartViewer(request, "chart1");
viewer.setChart(c, Chart.SVG);

// Include tool tip for the chart
viewer.setImageMap(c.getHTMLImageMap("", "", "title='{xLabel}: {value} MBytes'"));
%>
<!DOCTYPE html>
<html>
<head>
    <title>3D Bar Chart</title>
    <!-- Include ChartDirector Javascript Library to support chart interactions -->
    <script type="text/javascript" src="cdjcv.js"></script>
</head>
<body style="margin:5px 0px 0px 5px">
    <div style="font:bold 18pt verdana;">
        3D Bar Chart
    </div>
    <hr style="border:solid 1px #000080; background:#000080" />
    <div style="font:10pt verdana; margin-bottom:1.5em">
        <a href="viewsource.jsp?file=<%=request.getServletPath()%>">View Source Code</a>
    </div>
    <!-- ****** Here is the chart image ****** -->
    <%= viewer.renderHTML(response) %>
</body>
</html>