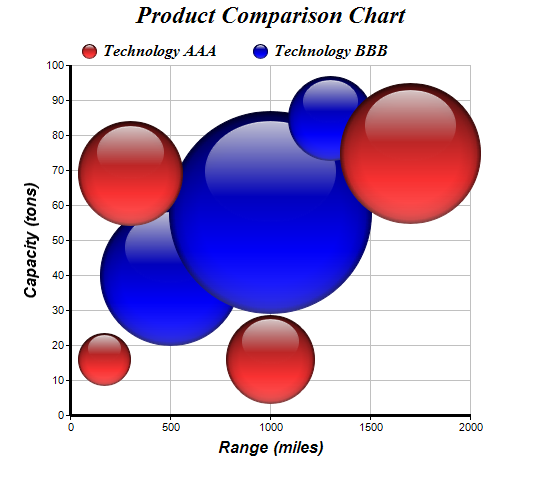
This examples demonstrates a bubble chart using brighter glass spheres as bubbles.
ChartDirector 7.0 (Java Edition)
3D Bubble Chart (2)
Source Code Listing
<%@page import="ChartDirector.*, java.util.*" %>
<%
// The XYZ points for the bubble chart
double[] dataX0 = {170, 300, 1000, 1700};
double[] dataY0 = {16, 69, 16, 75};
double[] dataZ0 = {52, 105, 88, 140};

double[] dataX1 = {500, 1000, 1300};
double[] dataY1 = {40, 58, 85};
double[] dataZ1 = {140, 202, 84};

// Create a XYChart object of size 540 x 480 pixels
XYChart c = new XYChart(540, 480);

// Set the plotarea at (70, 65) and of size 400 x 350 pixels. Turn on both horizontal and vertical
// grid lines with light grey color (0xc0c0c0)
c.setPlotArea(70, 65, 400, 350, -1, -1, Chart.Transparent, 0xc0c0c0, -1);

// Add a legend box at (70, 30) (top of the chart) with horizontal layout. Use 12pt Times Bold
// Italic font. Set the background and border color to Transparent.
c.addLegend(70, 30, false, "Times New Roman Bold Italic", 12).setBackground(Chart.Transparent);

// Add a title to the chart using 18pt Times Bold Itatic font.
c.addTitle("Product Comparison Chart", "Times New Roman Bold Italic", 18);

// Add titles to the axes using 12pt Arial Bold Italic font
c.yAxis().setTitle("Capacity (tons)", "Arial Bold Italic", 12);
c.xAxis().setTitle("Range (miles)", "Arial Bold Italic", 12);

// Set the axes line width to 3 pixels
c.xAxis().setWidth(3);
c.yAxis().setWidth(3);

// Add (dataX0, dataY0) as a scatter layer with red (ff3333) glass spheres, where the sphere size is
// modulated by dataZ0. This creates a bubble effect.
c.addScatterLayer(dataX0, dataY0, "Technology AAA", Chart.GlassSphere2Shape, 15, 0xff3333
    ).setSymbolScale(dataZ0);

// Add (dataX1, dataY1) as a scatter layer with blue (0000ff) glass spheres, where the sphere size
// is modulated by dataZ1. This creates a bubble effect.
c.addScatterLayer(dataX1, dataY1, "Technology BBB", Chart.GlassSphere2Shape, 15, 0x0000ff
    ).setSymbolScale(dataZ1);

// Output the chart
WebChartViewer viewer = new WebChartViewer(request, "chart1");
viewer.setChart(c, Chart.SVG);

// Include tool tip for the chart
viewer.setImageMap(c.getHTMLImageMap("", "",
    "title='[{dataSetName}] Range = {x} miles, Capacity = {value} tons, Length = {z} meters'"));
%>
<!DOCTYPE html>
<html>
<head>
    <title>3D Bubble Chart (2)</title>
    <!-- Include ChartDirector Javascript Library to support chart interactions -->
    <script type="text/javascript" src="cdjcv.js"></script>
</head>
<body style="margin:5px 0px 0px 5px">
    <div style="font:bold 18pt verdana;">
        3D Bubble Chart (2)
    </div>
    <hr style="border:solid 1px #000080; background:#000080" />
    <div style="font:10pt verdana; margin-bottom:1.5em">
        <a href="viewsource.jsp?file=<%=request.getServletPath()%>">View Source Code</a>
    </div>
    <!-- ****** Here is the chart image ****** -->
    <%= viewer.renderHTML(response) %>
</body>
</html>