This example demonstrates horizontal bar meters in a white coloring scheme, and with bars in various shading styles.
ChartDirector 7.0 (Java Edition)
White Horizontal Bar Meters
Source Code Listing
<%@page import="ChartDirector.*, java.util.*" %>
<%!
// Function to create the demo charts
void createChart(WebChartViewer viewer, int chartIndex)
{
// The value to display on the meter
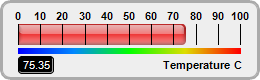
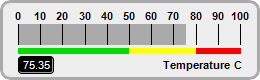
double value = 75.35;
// Create a LinearMeter object of size 260 x 80 pixels with very light grey (0xeeeeee)
// backgruond and a light grey (0xccccccc) 3-pixel thick rounded frame
LinearMeter m = new LinearMeter(260, 80, 0xeeeeee, 0xaaaaaa);
m.setRoundedFrame(Chart.Transparent);
m.setThickFrame(3);
// Set the scale region top-left corner at (18, 24), with size of 222 x 20 pixels. The scale
// labels are located on the top (implies horizontal meter)
m.setMeter(18, 24, 222, 20, Chart.Top);
// Set meter scale from 0 - 100, with a tick every 10 units
m.setScale(0, 100, 10);
// Demostrate different types of color scales
double[] smoothColorScale = {0, 0x0000ff, 25, 0x0088ff, 50, 0x00ff00, 75, 0xdddd00, 100,
0xff0000};
double[] stepColorScale = {0, 0x00dd00, 50, 0xffff00, 80, 0xff0000, 100};
double[] highLowColorScale = {0, 0x0000ff, 40, Chart.Transparent, 60, Chart.Transparent, 100,
0xff0000};
double[] highColorScale = {70, Chart.Transparent, 100, 0xff0000};
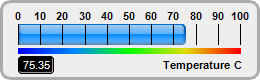
if (chartIndex == 0) {
// Add a blue (0x0088ff) bar from 0 to value with glass effect and 4 pixel rounded corners
m.addBar(0, value, 0x0088ff, Chart.glassEffect(Chart.NormalGlare, Chart.Top), 4);
// Add a 5-pixel thick smooth color scale at y = 48 (below the meter scale)
m.addColorScale(smoothColorScale, 48, 5);
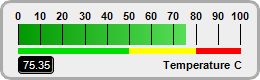
} else if (chartIndex == 1) {
// Add a green (0x00cc00) bar from 0 to value with bar lighting effect
m.addBar(0, value, 0x00cc00, Chart.barLighting());
// Add a 5-pixel thick step color scale at y = 48 (below the meter scale)
m.addColorScale(stepColorScale, 48, 5);
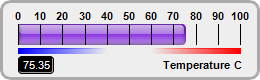
} else if (chartIndex == 2) {
// Add a purple (0x8833dd) bar from 0 to value with glass effect and 4 pixel rounded corners
m.addBar(0, value, 0x8833dd, Chart.glassEffect(Chart.NormalGlare, Chart.Top), 4);
// Add a 5-pixel thick high/low color scale at y = 48 (below the meter scale)
m.addColorScale(highLowColorScale, 48, 5);
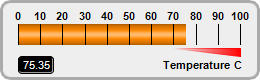
} else if (chartIndex == 3) {
// Add an orange (0xff8800) bar from 0 to value with cylinder lighting effect
m.addBar(0, value, 0xff8800, Chart.cylinderEffect());
// Add a high only color scale at y = 48 (below the meter scale) with thickness varying from
// 0 to 8
m.addColorScale(highColorScale, 48, 0, 48, 8);
} else if (chartIndex == 4) {
// Add a red (0xee3333) bar from 0 to value with glass effect and 4 pixel rounded corners
m.addBar(0, value, 0xee3333, Chart.glassEffect(Chart.NormalGlare, Chart.Top), 4);
// Add a 5-pixel thick smooth color scale at y = 48 (below the meter scale)
m.addColorScale(smoothColorScale, 48, 5);
} else {
// Add a grey (0xaaaaaa) bar from 0 to value
m.addBar(0, value, 0xaaaaaa);
// Add a 5-pixel thick step color scale at y = 48 (below the meter scale)
m.addColorScale(stepColorScale, 48, 5);
}
// Add a label right aligned to (243, 65) using 8pt Arial Bold font
m.addText(243, 65, "Temperature C", "Arial Bold", 8, Chart.TextColor, Chart.Right);
// Add a text box left aligned to (18, 65). Display the value using white (0xffffff) 8pt Arial
// Bold font on a black (0x000000) background with depressed rounded border.
TextBox t = m.addText(18, 65, m.formatValue(value, "2"), "Arial", 8, 0xffffff, Chart.Left);
t.setBackground(0x000000, 0x000000, -1);
t.setRoundedCorners(3);
// Output the chart
viewer.setChart(m, Chart.SVG);
}
%>
<%
// This example includes 6 charts
WebChartViewer[] viewers = new WebChartViewer[6];
for (int i = 0; i < viewers.length; ++i) {
viewers[i] = new WebChartViewer(request, "chart" + i);
createChart(viewers[i], i);
}
%>
<!DOCTYPE html>
<html>
<head>
<title>White Horizontal Bar Meters</title>
<!-- Include ChartDirector Javascript Library to support chart interactions -->
<script type="text/javascript" src="cdjcv.js"></script>
</head>
<body style="margin:5px 0px 0px 5px">
<div style="font:bold 18pt verdana;">
White Horizontal Bar Meters
</div>
<hr style="border:solid 1px #000080; background:#000080" />
<div style="font:10pt verdana; margin-bottom:1.5em">
<a href="viewsource.jsp?file=<%=request.getServletPath()%>">View Source Code</a>
</div>
<!-- ****** Here are the chart images ****** -->
<%
for (int i = 0; i < viewers.length; ++i) {
out.write(viewers[i].renderHTML(response));
out.write(" ");
}
%>
</body>
</html>