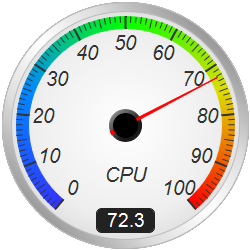
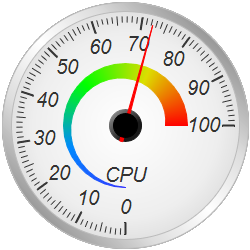
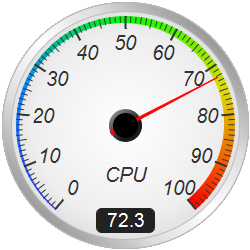
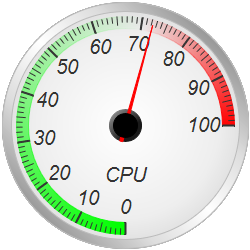
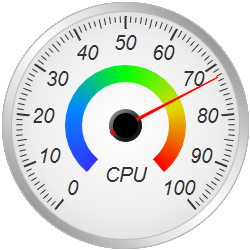
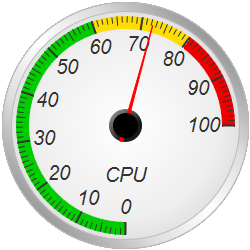
This example demonstrates round meters with a soft white background and a silver border.
The white background in this example is actually a radial gradient. It is fully white at the center, changing to light grey at the border. This creates a "softer" white effect. The radial gradient is created using
AngularMeter.relativeRadialGradient.
The silver border effect is achieved by using
AngularMeter.relativeLinearGradient to create a gradient consisting of varying levels of grey. The gradient is used as the fill color of the border ring created using
AngularMeter.addRing. The edge color of the ring is set to grey to make it easier to distinguish from the white background.
[JSP Version] jspdemo/whiteroundmeter.jsp
<%@page import="ChartDirector.*, java.util.*" %>
<%!
// Function to create the demo charts
void createChart(WebChartViewer viewer, int chartIndex)
{
    // The value to display on the meter
    double value = 72.3;

    // Create an AngularMeter object of size 250 x 250 pixels with transparent background
    AngularMeter m = new AngularMeter(250, 250, Chart.Transparent);

    // Set the default text and line colors to dark grey (0x333333)
    m.setColor(Chart.TextColor, 0x333333);
    m.setColor(Chart.LineColor, 0x333333);

    // Demonstration two different meter scale angles
    if (chartIndex % 2 == 0) {
        // Center at (125, 125), scale radius = 111 pixels, scale angle -140 to +140 degrees
        m.setMeter(125, 125, 109, -140, 140);
    } else {
        // Center at (125, 125), scale radius = 111 pixels, scale angle -180 to +90 degrees
         m.setMeter(125, 125, 109, -180, 90);
    }

    // Add a black (0x000000) circle with radius 123 pixels as background
    m.addRing(0, 123, 0x000000);

    // Background gradient color from white (0xffffff) at the center to light grey (0xdddddd) at the
    // border
    double[] bgGradient = {0, 0xffffff, 0.75, 0xeeeeee, 1, 0xdddddd};
    // Add circle with radius 123 pixels as background using the background gradient
    m.addRing(0, 123, m.relativeRadialGradient(bgGradient, 123));

    // Gradient color for the border to make it silver-like
    double[] ringGradient = {1, 0x999999, 0.5, 0xdddddd, 0, 0xffffff, -0.5, 0xdddddd, -1, 0x999999};
    // Add a ring between radii 114 and 123 pixels using the silver gradient with a light grey
    // (0xbbbbbb) edge as the meter border
    m.addRing(114, 123, m.relativeLinearGradient(ringGradient, 45, 123), 0xbbbbbb);

    // Meter scale is 0 - 100, with major/minor/micro ticks every 10/5/1 units
    m.setScale(0, 100, 10, 5, 1);

    // Set the scale label style to 15pt Arial Italic. Set the major/minor/micro tick lengths to
    // 12/9/6 pixels pointing inwards, and their widths to 2/1/1 pixels.
    m.setLabelStyle("Arial Italic", 15);
    m.setTickLength(-12, -9, -6);
    m.setLineWidth(0, 2, 1, 1);

    // Demostrate different types of color scales and putting them at different positions
    double[] smoothColorScale = {0, 0x3333ff, 25, 0x0088ff, 50, 0x00ff00, 75, 0xdddd00, 100,
        0xff0000};
    double[] stepColorScale = {0, 0x00cc00, 60, 0xffdd00, 80, 0xee0000, 100};
    double[] highLowColorScale = {0, 0x00ff00, 70, Chart.Transparent, 100, 0xff0000};

    if (chartIndex == 0) {
        // Add the smooth color scale at the default position
        m.addColorScale(smoothColorScale);
    } else if (chartIndex == 1) {
        // Add the smooth color scale starting at radius 62 with zero width and ending at radius 40
        // with 22 pixels outer width
        m.addColorScale(smoothColorScale, 62, 0, 40, 22);
    } else if (chartIndex == 2) {
        // Add the smooth color scale starting at radius 109 with zero width and ending at radius
        // 109 with 12 pixels inner width
        m.addColorScale(smoothColorScale, 109, 0, 109, -12);
    } else if (chartIndex == 3) {
        // Add the high/low color scale at the default position
        m.addColorScale(highLowColorScale);
    } else if (chartIndex == 4) {
        // Add the smooth color scale at radius 44 with 16 pixels outer width
        m.addColorScale(smoothColorScale, 44, 16);
    } else {
        // Add the step color scale at the default position
        m.addColorScale(stepColorScale);
    }

    // Add a text label centered at (125, 175) with 15pt Arial Italic font
    m.addText(125, 175, "CPU", "Arial Italic", 15, Chart.TextColor, Chart.Center);

    // Add a readout to some of the charts as demonstration
    if ((chartIndex == 0) || (chartIndex == 2)) {
        // Put the value label center aligned at (125, 232), using white (0xffffff) 14pt Arial font
        // on a dark grey (0x222222) background. Set box width to 50 pixels with 5 pixels rounded
        // corners.
        TextBox t = m.addText(125, 232, m.formatValue(value,
            "<*block,width=50,halign=center*>{value|1}"), "Arial", 14, 0xffffff, Chart.BottomCenter)
            ;
        t.setBackground(0x222222);
        t.setRoundedCorners(5);
    }

    // Add a red (0xff0000) pointer at the specified value
    m.addPointer2(value, 0xff0000);

    // Output the chart
    viewer.setChart(m, Chart.SVG);
}
%>
<%
// This example includes 6 charts
WebChartViewer[] viewers = new WebChartViewer[6];
for (int i = 0; i < viewers.length; ++i) {
    viewers[i] = new WebChartViewer(request, "chart" + i);
    createChart(viewers[i], i);
}
%>
<!DOCTYPE html>
<html>
<head>
    <title>White Round Meters</title>
    <!-- Include ChartDirector Javascript Library to support chart interactions -->
    <script type="text/javascript" src="cdjcv.js"></script>
</head>
<body style="margin:5px 0px 0px 5px">
    <div style="font:bold 18pt verdana;">
        White Round Meters
    </div>
    <hr style="border:solid 1px #000080; background:#000080" />
    <div style="font:10pt verdana; margin-bottom:1.5em">
        <a href="viewsource.jsp?file=<%=request.getServletPath()%>">View Source Code</a>
    </div>
    <!-- ****** Here are the chart images ****** -->
    <%
        for (int i = 0; i < viewers.length; ++i) {
            out.write(viewers[i].renderHTML(response));
            out.write(" ");
        }
    %>
</body>
</html>
© 2021 Advanced Software Engineering Limited. All rights reserved.