[Windows Forms - C# version] NetWinCharts\CSharpWinCharts\axisscale.cs
using System;
using ChartDirector;
namespace CSharpChartExplorer
{
public class axisscale : DemoModule
{
//Name of demo module
public string getName() { return "Y-Axis Scaling"; }
//Number of charts produced in this demo module
public int getNoOfCharts() { return 5; }
//Main code for creating charts
public void createChart(WinChartViewer viewer, int chartIndex)
{
// The data for the chart
double[] data = {5.5, 3.5, -3.7, 1.7, -1.4, 3.3};
string[] labels = {"Jan", "Feb", "Mar", "Apr", "May", "Jun"};
// Create a XYChart object of size 200 x 190 pixels
XYChart c = new XYChart(200, 190);
// Set the plot area at (30, 20) and of size 140 x 140 pixels
c.setPlotArea(30, 20, 140, 140);
// Configure the axis as according to the input parameter
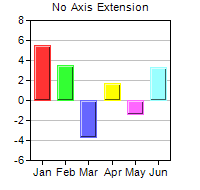
if (chartIndex == 0) {
c.addTitle("No Axis Extension", "Arial", 8);
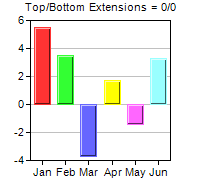
} else if (chartIndex == 1) {
c.addTitle("Top/Bottom Extensions = 0/0", "Arial", 8);
// Reserve 20% margin at top of plot area when auto-scaling
c.yAxis().setAutoScale(0, 0);
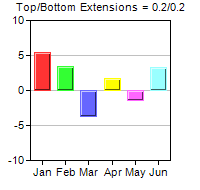
} else if (chartIndex == 2) {
c.addTitle("Top/Bottom Extensions = 0.2/0.2", "Arial", 8);
// Reserve 20% margin at top and bottom of plot area when auto-scaling
c.yAxis().setAutoScale(0.2, 0.2);
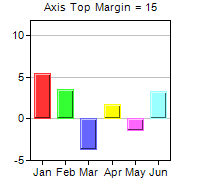
} else if (chartIndex == 3) {
c.addTitle("Axis Top Margin = 15", "Arial", 8);
// Reserve 15 pixels at top of plot area
c.yAxis().setMargin(15);
} else {
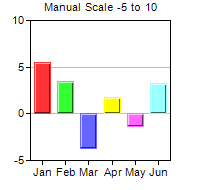
c.addTitle("Manual Scale -5 to 10", "Arial", 8);
// Set the y axis to scale from -5 to 10, with ticks every 5 units
c.yAxis().setLinearScale(-5, 10, 5);
}
// Set the labels on the x axis
c.xAxis().setLabels(labels);
// Add a color bar layer using the given data. Use a 1 pixel 3D border for the bars.
c.addBarLayer3(data).setBorderColor(-1, 1);
// Output the chart
viewer.Chart = c;
//include tool tip for the chart
viewer.ImageMap = c.getHTMLImageMap("clickable", "",
"title='ROI for {xLabel}: {value}%'");
}
}
}
[Windows Forms - VB Version] NetWinCharts\VBNetWinCharts\axisscale.vb
Imports System
Imports Microsoft.VisualBasic
Imports ChartDirector

Public Class axisscale
    Implements DemoModule

    'Name of demo module
    Public Function getName() As String Implements DemoModule.getName
        Return "Y-Axis Scaling"
    End Function

    'Number of charts produced in this demo module
    Public Function getNoOfCharts() As Integer Implements DemoModule.getNoOfCharts
        Return 5
    End Function

    'Main code for creating charts
    Public Sub createChart(viewer As WinChartViewer, chartIndex As Integer) _
        Implements DemoModule.createChart

        ' The data for the chart
        Dim data() As Double = {5.5, 3.5, -3.7, 1.7, -1.4, 3.3}
        Dim labels() As String = {"Jan", "Feb", "Mar", "Apr", "May", "Jun"}

        ' Create a XYChart object of size 200 x 190 pixels
        Dim c As XYChart = New XYChart(200, 190)

        ' Set the plot area at (30, 20) and of size 140 x 140 pixels
        c.setPlotArea(30, 20, 140, 140)

        ' Configure the axis as according to the input parameter
        If chartIndex = 0 Then
            c.addTitle("No Axis Extension", "Arial", 8)
        ElseIf chartIndex = 1 Then
            c.addTitle("Top/Bottom Extensions = 0/0", "Arial", 8)
            ' Reserve 20% margin at top of plot area when auto-scaling
            c.yAxis().setAutoScale(0, 0)
        ElseIf chartIndex = 2 Then
            c.addTitle("Top/Bottom Extensions = 0.2/0.2", "Arial", 8)
            ' Reserve 20% margin at top and bottom of plot area when auto-scaling
            c.yAxis().setAutoScale(0.2, 0.2)
        ElseIf chartIndex = 3 Then
            c.addTitle("Axis Top Margin = 15", "Arial", 8)
            ' Reserve 15 pixels at top of plot area
            c.yAxis().setMargin(15)
        Else
            c.addTitle("Manual Scale -5 to 10", "Arial", 8)
            ' Set the y axis to scale from -5 to 10, with ticks every 5 units
            c.yAxis().setLinearScale(-5, 10, 5)
        End If

        ' Set the labels on the x axis
        c.xAxis().setLabels(labels)

        ' Add a color bar layer using the given data. Use a 1 pixel 3D border for the bars.
        c.addBarLayer3(data).setBorderColor(-1, 1)

        ' Output the chart
        viewer.Chart = c

        'include tool tip for the chart
        viewer.ImageMap = c.getHTMLImageMap("clickable", "", "title='ROI for {xLabel}: {value}%'")

    End Sub

End Class
[WPF - C#] NetWPFCharts\CSharpWPFCharts\axisscale.cs
using System;
using ChartDirector;

namespace CSharpWPFCharts
{
    public class axisscale : DemoModule
    {
        //Name of demo module
        public string getName() { return "Y-Axis Scaling"; }

        //Number of charts produced in this demo module
        public int getNoOfCharts() { return 5; }

        //Main code for creating charts
        public void createChart(WPFChartViewer viewer, int chartIndex)
        {
            // The data for the chart
            double[] data = {5.5, 3.5, -3.7, 1.7, -1.4, 3.3};
            string[] labels = {"Jan", "Feb", "Mar", "Apr", "May", "Jun"};

            // Create a XYChart object of size 200 x 190 pixels
            XYChart c = new XYChart(200, 190);

            // Set the plot area at (30, 20) and of size 140 x 140 pixels
            c.setPlotArea(30, 20, 140, 140);

            // Configure the axis as according to the input parameter
            if (chartIndex == 0) {
                c.addTitle("No Axis Extension", "Arial", 8);
            } else if (chartIndex == 1) {
                c.addTitle("Top/Bottom Extensions = 0/0", "Arial", 8);
                // Reserve 20% margin at top of plot area when auto-scaling
                c.yAxis().setAutoScale(0, 0);
            } else if (chartIndex == 2) {
                c.addTitle("Top/Bottom Extensions = 0.2/0.2", "Arial", 8);
                // Reserve 20% margin at top and bottom of plot area when auto-scaling
                c.yAxis().setAutoScale(0.2, 0.2);
            } else if (chartIndex == 3) {
                c.addTitle("Axis Top Margin = 15", "Arial", 8);
                // Reserve 15 pixels at top of plot area
                c.yAxis().setMargin(15);
            } else {
                c.addTitle("Manual Scale -5 to 10", "Arial", 8);
                // Set the y axis to scale from -5 to 10, with ticks every 5 units
                c.yAxis().setLinearScale(-5, 10, 5);
            }

            // Set the labels on the x axis
            c.xAxis().setLabels(labels);

            // Add a color bar layer using the given data. Use a 1 pixel 3D border for the bars.
            c.addBarLayer3(data).setBorderColor(-1, 1);

            // Output the chart
            viewer.Chart = c;

            //include tool tip for the chart
            viewer.ImageMap = c.getHTMLImageMap("clickable", "",
                "title='ROI for {xLabel}: {value}%'");
        }
    }
}
[ASP.NET Web Forms - C# version] NetWebCharts\CSharpASP\axisscale.aspx
(Click here on how to convert this code to code-behind style.)<%@ Page Language="C#" Debug="true" %>
<%@ Import Namespace="ChartDirector" %>
<%@ Register TagPrefix="chart" Namespace="ChartDirector" Assembly="netchartdir" %>
<!DOCTYPE html>
<script runat="server">
//
// Create chart
//
protected void createChart(WebChartViewer viewer, int chartIndex)
{
// The data for the chart
double[] data = {5.5, 3.5, -3.7, 1.7, -1.4, 3.3};
string[] labels = {"Jan", "Feb", "Mar", "Apr", "May", "Jun"};
// Create a XYChart object of size 200 x 190 pixels
XYChart c = new XYChart(200, 190);
// Set the plot area at (30, 20) and of size 140 x 140 pixels
c.setPlotArea(30, 20, 140, 140);
// Configure the axis as according to the input parameter
if (chartIndex == 0) {
c.addTitle("No Axis Extension", "Arial", 8);
} else if (chartIndex == 1) {
c.addTitle("Top/Bottom Extensions = 0/0", "Arial", 8);
// Reserve 20% margin at top of plot area when auto-scaling
c.yAxis().setAutoScale(0, 0);
} else if (chartIndex == 2) {
c.addTitle("Top/Bottom Extensions = 0.2/0.2", "Arial", 8);
// Reserve 20% margin at top and bottom of plot area when auto-scaling
c.yAxis().setAutoScale(0.2, 0.2);
} else if (chartIndex == 3) {
c.addTitle("Axis Top Margin = 15", "Arial", 8);
// Reserve 15 pixels at top of plot area
c.yAxis().setMargin(15);
} else {
c.addTitle("Manual Scale -5 to 10", "Arial", 8);
// Set the y axis to scale from -5 to 10, with ticks every 5 units
c.yAxis().setLinearScale(-5, 10, 5);
}
// Set the labels on the x axis
c.xAxis().setLabels(labels);
// Add a color bar layer using the given data. Use a 1 pixel 3D border for the bars.
c.addBarLayer3(data).setBorderColor(-1, 1);
// Output the chart
viewer.Image = c.makeWebImage(Chart.SVG);
// Include tool tip for the chart
viewer.ImageMap = c.getHTMLImageMap("", "", "title='ROI for {xLabel}: {value}%'");
}
//
// Page Load event handler
//
protected void Page_Load(object sender, EventArgs e)
{
createChart(WebChartViewer0, 0);
createChart(WebChartViewer1, 1);
createChart(WebChartViewer2, 2);
createChart(WebChartViewer3, 3);
createChart(WebChartViewer4, 4);
}
</script>
<html>
<head>
<script type="text/javascript" src="cdjcv.js"></script>
</head>
<body>
<chart:WebChartViewer id="WebChartViewer0" runat="server" />
<chart:WebChartViewer id="WebChartViewer1" runat="server" />
<chart:WebChartViewer id="WebChartViewer2" runat="server" />
<chart:WebChartViewer id="WebChartViewer3" runat="server" />
<chart:WebChartViewer id="WebChartViewer4" runat="server" />
</body>
</html>
[ASP.NET Web Forms - VB Version] NetWebCharts\VBNetASP\axisscale.aspx
(Click here on how to convert this code to code-behind style.)<%@ Page Language="VB" Debug="true" %>
<%@ Import Namespace="ChartDirector" %>
<%@ Register TagPrefix="chart" Namespace="ChartDirector" Assembly="netchartdir" %>
<!DOCTYPE html>
<script runat="server">
'
' Create chart
'
Protected Sub createChart(viewer As WebChartViewer, chartIndex As Integer)
' The data for the chart
Dim data() As Double = {5.5, 3.5, -3.7, 1.7, -1.4, 3.3}
Dim labels() As String = {"Jan", "Feb", "Mar", "Apr", "May", "Jun"}
' Create a XYChart object of size 200 x 190 pixels
Dim c As XYChart = New XYChart(200, 190)
' Set the plot area at (30, 20) and of size 140 x 140 pixels
c.setPlotArea(30, 20, 140, 140)
' Configure the axis as according to the input parameter
If chartIndex = 0 Then
c.addTitle("No Axis Extension", "Arial", 8)
ElseIf chartIndex = 1 Then
c.addTitle("Top/Bottom Extensions = 0/0", "Arial", 8)
' Reserve 20% margin at top of plot area when auto-scaling
c.yAxis().setAutoScale(0, 0)
ElseIf chartIndex = 2 Then
c.addTitle("Top/Bottom Extensions = 0.2/0.2", "Arial", 8)
' Reserve 20% margin at top and bottom of plot area when auto-scaling
c.yAxis().setAutoScale(0.2, 0.2)
ElseIf chartIndex = 3 Then
c.addTitle("Axis Top Margin = 15", "Arial", 8)
' Reserve 15 pixels at top of plot area
c.yAxis().setMargin(15)
Else
c.addTitle("Manual Scale -5 to 10", "Arial", 8)
' Set the y axis to scale from -5 to 10, with ticks every 5 units
c.yAxis().setLinearScale(-5, 10, 5)
End If
' Set the labels on the x axis
c.xAxis().setLabels(labels)
' Add a color bar layer using the given data. Use a 1 pixel 3D border for the bars.
c.addBarLayer3(data).setBorderColor(-1, 1)
' Output the chart
viewer.Image = c.makeWebImage(Chart.SVG)
' Include tool tip for the chart
viewer.ImageMap = c.getHTMLImageMap("", "", "title='ROI for {xLabel}: {value}%'")
End Sub
'
' Page Load event handler
'
Protected Sub Page_Load(ByVal sender As System.Object, ByVal e As System.EventArgs)
createChart(WebChartViewer0, 0)
createChart(WebChartViewer1, 1)
createChart(WebChartViewer2, 2)
createChart(WebChartViewer3, 3)
createChart(WebChartViewer4, 4)
End Sub
</script>
<html>
<head>
<script type="text/javascript" src="cdjcv.js"></script>
</head>
<body>
<chart:WebChartViewer id="WebChartViewer0" runat="server" />
<chart:WebChartViewer id="WebChartViewer1" runat="server" />
<chart:WebChartViewer id="WebChartViewer2" runat="server" />
<chart:WebChartViewer id="WebChartViewer3" runat="server" />
<chart:WebChartViewer id="WebChartViewer4" runat="server" />
</body>
</html>
[ASP.NET MVC - Controller] NetMvcCharts\Controllers\AxisscaleController.cs
using System;
using System.Web.Mvc;
using ChartDirector;

namespace NetMvcCharts.Controllers
{
    public class AxisscaleController : Controller
    {
        //
        // Default Action
        //
        public ActionResult Index()
        {
            ViewBag.Title = "Y-Axis Scaling";

            // This example contains 5 charts.
            ViewBag.Viewer = new RazorChartViewer[5];
            for (int i = 0; i < ViewBag.Viewer.Length; ++i)
                createChart(ViewBag.Viewer[i] = new RazorChartViewer(HttpContext, "chart" + i), i);

            return View("~/Views/Shared/ChartView.cshtml");
        }

        //
        // Create chart
        //
        private void createChart(RazorChartViewer viewer, int chartIndex)
        {
            // The data for the chart
            double[] data = {5.5, 3.5, -3.7, 1.7, -1.4, 3.3};
            string[] labels = {"Jan", "Feb", "Mar", "Apr", "May", "Jun"};

            // Create a XYChart object of size 200 x 190 pixels
            XYChart c = new XYChart(200, 190);

            // Set the plot area at (30, 20) and of size 140 x 140 pixels
            c.setPlotArea(30, 20, 140, 140);

            // Configure the axis as according to the input parameter
            if (chartIndex == 0) {
                c.addTitle("No Axis Extension", "Arial", 8);
            } else if (chartIndex == 1) {
                c.addTitle("Top/Bottom Extensions = 0/0", "Arial", 8);
                // Reserve 20% margin at top of plot area when auto-scaling
                c.yAxis().setAutoScale(0, 0);
            } else if (chartIndex == 2) {
                c.addTitle("Top/Bottom Extensions = 0.2/0.2", "Arial", 8);
                // Reserve 20% margin at top and bottom of plot area when auto-scaling
                c.yAxis().setAutoScale(0.2, 0.2);
            } else if (chartIndex == 3) {
                c.addTitle("Axis Top Margin = 15", "Arial", 8);
                // Reserve 15 pixels at top of plot area
                c.yAxis().setMargin(15);
            } else {
                c.addTitle("Manual Scale -5 to 10", "Arial", 8);
                // Set the y axis to scale from -5 to 10, with ticks every 5 units
                c.yAxis().setLinearScale(-5, 10, 5);
            }

            // Set the labels on the x axis
            c.xAxis().setLabels(labels);

            // Add a color bar layer using the given data. Use a 1 pixel 3D border for the bars.
            c.addBarLayer3(data).setBorderColor(-1, 1);

            // Output the chart
            viewer.Image = c.makeWebImage(Chart.SVG);

            // Include tool tip for the chart
            viewer.ImageMap = c.getHTMLImageMap("", "", "title='ROI for {xLabel}: {value}%'");
        }
    }
}
[ASP.NET MVC - View] NetMvcCharts\Views\Shared\ChartView.cshtml
@{ Layout = null; }

<!DOCTYPE html>

<html>
<head>
    <meta name="viewport" content="width=device-width" />
    <title>@ViewBag.Title</title>
    <style>
        @ViewBag.Style
    </style>
    @Scripts.Render("~/Scripts/cdjcv.js")
</head>
<body style="margin:5px 0px 0px 5px">
    <div style="font:bold 18pt verdana;">
        @ViewBag.Title
    </div>
    <hr style="border:solid 1px #000080; background:#000080" />
    <div>
        @{
            if (ViewBag.Viewer is Array)
            {
                // Display multiple charts
                for (int i = 0; i < ViewBag.Viewer.Length; ++i)
                {
                    @:@Html.Raw(ViewBag.Viewer[i].RenderHTML())
                }
            }
            else
            {
                // Display one chart only
                @:@Html.Raw(ViewBag.Viewer.RenderHTML())
            }
        }
    </div>
</body>
</html>
© 2023 Advanced Software Engineering Limited. All rights reserved.