[Windows Forms - C# version] NetWinCharts\CSharpWinCharts\binaryseries.cs
using System;
using ChartDirector;
namespace CSharpChartExplorer
{
public class binaryseries : DemoModule
{
//Name of demo module
public string getName() { return "Binary Data Series"; }
//Number of charts produced in this demo module
public int getNoOfCharts() { return 1; }
//Main code for creating chart.
//Note: the argument chartIndex is unused because this demo only has 1 chart.
public void createChart(WinChartViewer viewer, int chartIndex)
{
// The data for the chart
double[] dataY = {1, 0, 1, 0, 1, 0, 1, 0, 1, 0, 1, 0, 1, 1};
DateTime[] dataX = {new DateTime(2008, 7, 1, 0, 0, 0), new DateTime(2008, 7, 1, 2, 17, 2
), new DateTime(2008, 7, 1, 8, 5, 30), new DateTime(2008, 7, 1, 10, 54, 10),
new DateTime(2008, 7, 1, 15, 40, 0), new DateTime(2008, 7, 1, 18, 22, 20),
new DateTime(2008, 7, 1, 22, 17, 14), new DateTime(2008, 7, 2, 2, 55, 50),
new DateTime(2008, 7, 2, 8, 17, 14), new DateTime(2008, 7, 2, 11, 55, 50),
new DateTime(2008, 7, 2, 13, 17, 14), new DateTime(2008, 7, 2, 17, 55, 50),
new DateTime(2008, 7, 2, 20, 17, 14), new DateTime(2008, 7, 3, 0, 0, 0)};
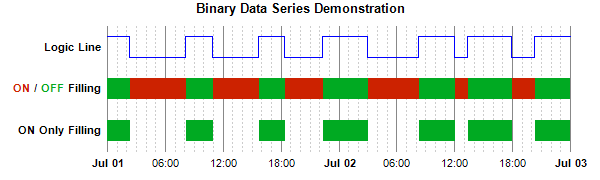
// In this example, we only use position 1, 3, 5 for the data series. Positions 0, 2, 4,
// 6 are empty and serve as gaps.
string[] labels = {"", "ON Only Filling", "",
"<*font,color=cc2200*>ON<*/font*> / <*font,color=00aa22*>OFF<*/font*> Filling", "",
"Logic Line", ""};
// Create a XYChart object of size 600 x 180 pixels
XYChart c = new XYChart(600, 180);
// Add a title to the chart using 10 points Arial Bold font. Set top/bottom margins to
// 12 pixels.
ChartDirector.TextBox title = c.addTitle("Binary Data Series Demonstration",
"Arial Bold", 10);
// Tentatively set the plotarea at (100, 30) and of size 470 x 120 pixels. Use
// transparent border. Use grey (888888) solid line and light grey (ccccc) dotted line
// as major and minor vertical grid lines.
c.setPlotArea(100, 30, 470, 120, -1, -1, Chart.Transparent).setGridColor(
Chart.Transparent, 0x888888, Chart.Transparent, c.dashLineColor(0xcccccc,
Chart.DotLine));
// Set axes to transparent
c.xAxis().setColors(Chart.Transparent);
c.yAxis().setColors(Chart.Transparent);
// Set the y axis labels
c.yAxis().setLabels(labels);
// Set y-axis label style to 8pt Arial Bold
c.yAxis().setLabelStyle("Arial Bold", 8);
// Set x-axis major and minor tick density to 50 and 5 pixels. ChartDirector
// auto-scaling will use this as the guideline when putting ticks on the x-axis.
c.xAxis().setTickDensity(50, 5);
// Use "<*font=Arial Bold*>{value|mmm dd}" for the first label of an hour, and
// "{value|hh:nn}" for all other labels.
c.xAxis().setMultiFormat(Chart.StartOfDayFilter(), "<*font=Arial Bold*>{value|mmm dd}",
Chart.AllPassFilter(), "{value|hh:nn}");
//
// A Logic Line can be achieved using a StepLineLayer in ChartDirector
//
// Shift the data by 4.5, so instead of 0 - 1, it is now 4.5 to 5.5, or fluctuate around
// the y = 5 (Logic Line label) position.
double[] shiftedLine0 = new ArrayMath(dataY).add(4.5).result();
// Add step lines using the original and the reversed data
StepLineLayer layer0 = c.addStepLineLayer(shiftedLine0, 0x0000ff);
layer0.setXData(dataX);
//
// To perform ON/OFF filling, we draw the logic line, and its reverse, and fill the
// region in between
//
// Shift the data by 2.5, so instead of 0 - 1, it is now 2.5 to 3.5, or fluctuate around
// the y = 3 (ON/OFF Filing label) position.
double[] shiftedLine1 = new ArrayMath(dataY).add(2.5).result();
// Reverse the data, so the 0 becomes 1 and 1 becomes 0, and shift it as well.
double[] reverseShiftedLine1 = new ArrayMath(dataY).mul(-1).add(3.5).result();
// Add step lines using the original and the reversed data
StepLineLayer layer1 = c.addStepLineLayer(shiftedLine1, Chart.Transparent);
layer1.addDataSet(reverseShiftedLine1, Chart.Transparent);
layer1.setXData(dataX);
// Fill the region between the two step lines with green (00aa22) or red (cc2200),
// depending on whether the original or the reserve is higher.
c.addInterLineLayer(layer1.getLine(0), layer1.getLine(1), 0x00aa22, 0xcc2200);
//
// The ON Only filling is the same as ON/OFF filling, except the OFF filling color is
// transparent
//
// Shift the data by 0.5, so instead of 0 - 1, it is now 0.5 to 1.5, or fluctuate around
// the y = 1 (ON Only Filing label) position.
double[] shiftedLine2 = new ArrayMath(dataY).add(0.5).result();
// Reverse the data, so the 0 becomes 1 and 1 becomes 0, and shift it as well.
double[] reverseShiftedLine2 = new ArrayMath(dataY).mul(-1).add(1.5).result();
// Add step lines using the original and the reversed data
StepLineLayer layer2 = c.addStepLineLayer(shiftedLine2, Chart.Transparent);
layer2.addDataSet(reverseShiftedLine2, Chart.Transparent);
layer2.setXData(dataX);
// Fill the region between the two step lines with green (00aa22) or transparent,
// depending on whether the original or the reserve is higher.
c.addInterLineLayer(layer2.getLine(0), layer2.getLine(1), 0x00aa22, Chart.Transparent);
// Adjust the plot area size, such that the bounding box (inclusive of axes) is 10
// pixels from the left edge, 10 pixels below the title, 30 pixels from the right edge,
// and 10 pixels above the bottom edge.
c.packPlotArea(10, title.getHeight() + 10, c.getWidth() - 30, c.getHeight() - 10);
// Output the chart
viewer.Chart = c;
}
}
}
[Windows Forms - VB Version] NetWinCharts\VBNetWinCharts\binaryseries.vb
Imports System
Imports Microsoft.VisualBasic
Imports ChartDirector

Public Class binaryseries
    Implements DemoModule

    'Name of demo module
    Public Function getName() As String Implements DemoModule.getName
        Return "Binary Data Series"
    End Function

    'Number of charts produced in this demo module
    Public Function getNoOfCharts() As Integer Implements DemoModule.getNoOfCharts
        Return 1
    End Function

    'Main code for creating chart.
    'Note: the argument chartIndex is unused because this demo only has 1 chart.
    Public Sub createChart(viewer As WinChartViewer, chartIndex As Integer) _
        Implements DemoModule.createChart

        ' The data for the chart
        Dim dataY() As Double = {1, 0, 1, 0, 1, 0, 1, 0, 1, 0, 1, 0, 1, 1}
        Dim dataX() As Date = {New DateTime(2008, 7, 1, 0, 0, 0), New DateTime(2008, 7, 1, 2, 17, _
            2), New DateTime(2008, 7, 1, 8, 5, 30), New DateTime(2008, 7, 1, 10, 54, 10), _
            New DateTime(2008, 7, 1, 15, 40, 0), New DateTime(2008, 7, 1, 18, 22, 20), _
            New DateTime(2008, 7, 1, 22, 17, 14), New DateTime(2008, 7, 2, 2, 55, 50), _
            New DateTime(2008, 7, 2, 8, 17, 14), New DateTime(2008, 7, 2, 11, 55, 50), _
            New DateTime(2008, 7, 2, 13, 17, 14), New DateTime(2008, 7, 2, 17, 55, 50), _
            New DateTime(2008, 7, 2, 20, 17, 14), New DateTime(2008, 7, 3, 0, 0, 0)}

        ' In this example, we only use position 1, 3, 5 for the data series. Positions 0, 2, 4, 6
        ' are empty and serve as gaps.
        Dim labels() As String = {"", "ON Only Filling", "", _
            "<*font,color=cc2200*>ON<*/font*> / <*font,color=00aa22*>OFF<*/font*> Filling", "", _
            "Logic Line", ""}

        ' Create a XYChart object of size 600 x 180 pixels
        Dim c As XYChart = New XYChart(600, 180)

        ' Add a title to the chart using 10 points Arial Bold font. Set top/bottom margins to 12
        ' pixels.
        Dim title As ChartDirector.TextBox = c.addTitle("Binary Data Series Demonstration", _
            "Arial Bold", 10)

        ' Tentatively set the plotarea at (100, 30) and of size 470 x 120 pixels. Use transparent
        ' border. Use grey (888888) solid line and light grey (ccccc) dotted line as major and minor
        ' vertical grid lines.
        c.setPlotArea(100, 30, 470, 120, -1, -1, Chart.Transparent).setGridColor( _
            Chart.Transparent, &H888888, Chart.Transparent, c.dashLineColor(&Hcccccc, _
            Chart.DotLine))

        ' Set axes to transparent
        c.xAxis().setColors(Chart.Transparent)
        c.yAxis().setColors(Chart.Transparent)

        ' Set the y axis labels
        c.yAxis().setLabels(labels)

        ' Set y-axis label style to 8pt Arial Bold
        c.yAxis().setLabelStyle("Arial Bold", 8)

        ' Set x-axis major and minor tick density to 50 and 5 pixels. ChartDirector auto-scaling
        ' will use this as the guideline when putting ticks on the x-axis.
        c.xAxis().setTickDensity(50, 5)

        ' Use "<*font=Arial Bold*>{value|mmm dd}" for the first label of an hour, and
        ' "{value|hh:nn}" for all other labels.
        c.xAxis().setMultiFormat(Chart.StartOfDayFilter(), "<*font=Arial Bold*>{value|mmm dd}", _
            Chart.AllPassFilter(), "{value|hh:nn}")

        '
        ' A Logic Line can be achieved using a StepLineLayer in ChartDirector
        '

        ' Shift the data by 4.5, so instead of 0 - 1, it is now 4.5 to 5.5, or fluctuate around the
        ' y = 5 (Logic Line label) position.
        Dim shiftedLine0() As Double = New ArrayMath(dataY).add(4.5).result()

        ' Add step lines using the original and the reversed data
        Dim layer0 As StepLineLayer = c.addStepLineLayer(shiftedLine0, &H0000ff)
        layer0.setXData(dataX)

        '
        ' To perform ON/OFF filling, we draw the logic line, and its reverse, and fill the region in
        ' between
        '

        ' Shift the data by 2.5, so instead of 0 - 1, it is now 2.5 to 3.5, or fluctuate around the
        ' y = 3 (ON/OFF Filing label) position.
        Dim shiftedLine1() As Double = New ArrayMath(dataY).add(2.5).result()
        ' Reverse the data, so the 0 becomes 1 and 1 becomes 0, and shift it as well.
        Dim reverseShiftedLine1() As Double = New ArrayMath(dataY).mul(-1).add(3.5).result()

        ' Add step lines using the original and the reversed data
        Dim layer1 As StepLineLayer = c.addStepLineLayer(shiftedLine1, Chart.Transparent)
        layer1.addDataSet(reverseShiftedLine1, Chart.Transparent)
        layer1.setXData(dataX)

        ' Fill the region between the two step lines with green (00aa22) or red (cc2200), depending
        ' on whether the original or the reserve is higher.
        c.addInterLineLayer(layer1.getLine(0), layer1.getLine(1), &H00aa22, &Hcc2200)

        '
        ' The ON Only filling is the same as ON/OFF filling, except the OFF filling color is
        ' transparent
        '

        ' Shift the data by 0.5, so instead of 0 - 1, it is now 0.5 to 1.5, or fluctuate around the
        ' y = 1 (ON Only Filing label) position.
        Dim shiftedLine2() As Double = New ArrayMath(dataY).add(0.5).result()
        ' Reverse the data, so the 0 becomes 1 and 1 becomes 0, and shift it as well.
        Dim reverseShiftedLine2() As Double = New ArrayMath(dataY).mul(-1).add(1.5).result()

        ' Add step lines using the original and the reversed data
        Dim layer2 As StepLineLayer = c.addStepLineLayer(shiftedLine2, Chart.Transparent)
        layer2.addDataSet(reverseShiftedLine2, Chart.Transparent)
        layer2.setXData(dataX)

        ' Fill the region between the two step lines with green (00aa22) or transparent, depending
        ' on whether the original or the reserve is higher.
        c.addInterLineLayer(layer2.getLine(0), layer2.getLine(1), &H00aa22, Chart.Transparent)

        ' Adjust the plot area size, such that the bounding box (inclusive of axes) is 10 pixels
        ' from the left edge, 10 pixels  below the title, 30 pixels from the right edge, and 10
        ' pixels above the bottom edge.
        c.packPlotArea(10, title.getHeight() + 10, c.getWidth() - 30, c.getHeight() - 10)

        ' Output the chart
        viewer.Chart = c

    End Sub

End Class
[WPF - C#] NetWPFCharts\CSharpWPFCharts\binaryseries.cs
using System;
using ChartDirector;

namespace CSharpWPFCharts
{
    public class binaryseries : DemoModule
    {
        //Name of demo module
        public string getName() { return "Binary Data Series"; }

        //Number of charts produced in this demo module
        public int getNoOfCharts() { return 1; }

        //Main code for creating chart.
        //Note: the argument chartIndex is unused because this demo only has 1 chart.
        public void createChart(WPFChartViewer viewer, int chartIndex)
        {
            // The data for the chart
            double[] dataY = {1, 0, 1, 0, 1, 0, 1, 0, 1, 0, 1, 0, 1, 1};
            DateTime[] dataX = {new DateTime(2008, 7, 1, 0, 0, 0), new DateTime(2008, 7, 1, 2, 17, 2
                ), new DateTime(2008, 7, 1, 8, 5, 30), new DateTime(2008, 7, 1, 10, 54, 10),
                new DateTime(2008, 7, 1, 15, 40, 0), new DateTime(2008, 7, 1, 18, 22, 20),
                new DateTime(2008, 7, 1, 22, 17, 14), new DateTime(2008, 7, 2, 2, 55, 50),
                new DateTime(2008, 7, 2, 8, 17, 14), new DateTime(2008, 7, 2, 11, 55, 50),
                new DateTime(2008, 7, 2, 13, 17, 14), new DateTime(2008, 7, 2, 17, 55, 50),
                new DateTime(2008, 7, 2, 20, 17, 14), new DateTime(2008, 7, 3, 0, 0, 0)};

            // In this example, we only use position 1, 3, 5 for the data series. Positions 0, 2, 4,
            // 6 are empty and serve as gaps.
            string[] labels = {"", "ON Only Filling", "",
                "<*font,color=cc2200*>ON<*/font*> / <*font,color=00aa22*>OFF<*/font*> Filling", "",
                "Logic Line", ""};

            // Create a XYChart object of size 600 x 180 pixels
            XYChart c = new XYChart(600, 180);

            // Add a title to the chart using 10 points Arial Bold font. Set top/bottom margins to
            // 12 pixels.
            ChartDirector.TextBox title = c.addTitle("Binary Data Series Demonstration",
                "Arial Bold", 10);

            // Tentatively set the plotarea at (100, 30) and of size 470 x 120 pixels. Use
            // transparent border. Use grey (888888) solid line and light grey (ccccc) dotted line
            // as major and minor vertical grid lines.
            c.setPlotArea(100, 30, 470, 120, -1, -1, Chart.Transparent).setGridColor(
                Chart.Transparent, 0x888888, Chart.Transparent, c.dashLineColor(0xcccccc,
                Chart.DotLine));

            // Set axes to transparent
            c.xAxis().setColors(Chart.Transparent);
            c.yAxis().setColors(Chart.Transparent);

            // Set the y axis labels
            c.yAxis().setLabels(labels);

            // Set y-axis label style to 8pt Arial Bold
            c.yAxis().setLabelStyle("Arial Bold", 8);

            // Set x-axis major and minor tick density to 50 and 5 pixels. ChartDirector
            // auto-scaling will use this as the guideline when putting ticks on the x-axis.
            c.xAxis().setTickDensity(50, 5);

            // Use "<*font=Arial Bold*>{value|mmm dd}" for the first label of an hour, and
            // "{value|hh:nn}" for all other labels.
            c.xAxis().setMultiFormat(Chart.StartOfDayFilter(), "<*font=Arial Bold*>{value|mmm dd}",
                Chart.AllPassFilter(), "{value|hh:nn}");

            //
            // A Logic Line can be achieved using a StepLineLayer in ChartDirector
            //

            // Shift the data by 4.5, so instead of 0 - 1, it is now 4.5 to 5.5, or fluctuate around
            // the y = 5 (Logic Line label) position.
            double[] shiftedLine0 = new ArrayMath(dataY).add(4.5).result();

            // Add step lines using the original and the reversed data
            StepLineLayer layer0 = c.addStepLineLayer(shiftedLine0, 0x0000ff);
            layer0.setXData(dataX);

            //
            // To perform ON/OFF filling, we draw the logic line, and its reverse, and fill the
            // region in between
            //

            // Shift the data by 2.5, so instead of 0 - 1, it is now 2.5 to 3.5, or fluctuate around
            // the y = 3 (ON/OFF Filing label) position.
            double[] shiftedLine1 = new ArrayMath(dataY).add(2.5).result();
            // Reverse the data, so the 0 becomes 1 and 1 becomes 0, and shift it as well.
            double[] reverseShiftedLine1 = new ArrayMath(dataY).mul(-1).add(3.5).result();

            // Add step lines using the original and the reversed data
            StepLineLayer layer1 = c.addStepLineLayer(shiftedLine1, Chart.Transparent);
            layer1.addDataSet(reverseShiftedLine1, Chart.Transparent);
            layer1.setXData(dataX);

            // Fill the region between the two step lines with green (00aa22) or red (cc2200),
            // depending on whether the original or the reserve is higher.
            c.addInterLineLayer(layer1.getLine(0), layer1.getLine(1), 0x00aa22, 0xcc2200);

            //
            // The ON Only filling is the same as ON/OFF filling, except the OFF filling color is
            // transparent
            //

            // Shift the data by 0.5, so instead of 0 - 1, it is now 0.5 to 1.5, or fluctuate around
            // the y = 1 (ON Only Filing label) position.
            double[] shiftedLine2 = new ArrayMath(dataY).add(0.5).result();
            // Reverse the data, so the 0 becomes 1 and 1 becomes 0, and shift it as well.
            double[] reverseShiftedLine2 = new ArrayMath(dataY).mul(-1).add(1.5).result();

            // Add step lines using the original and the reversed data
            StepLineLayer layer2 = c.addStepLineLayer(shiftedLine2, Chart.Transparent);
            layer2.addDataSet(reverseShiftedLine2, Chart.Transparent);
            layer2.setXData(dataX);

            // Fill the region between the two step lines with green (00aa22) or transparent,
            // depending on whether the original or the reserve is higher.
            c.addInterLineLayer(layer2.getLine(0), layer2.getLine(1), 0x00aa22, Chart.Transparent);

            // Adjust the plot area size, such that the bounding box (inclusive of axes) is 10
            // pixels from the left edge, 10 pixels  below the title, 30 pixels from the right edge,
            // and 10 pixels above the bottom edge.
            c.packPlotArea(10, title.getHeight() + 10, c.getWidth() - 30, c.getHeight() - 10);

            // Output the chart
            viewer.Chart = c;
        }
    }
}
[ASP.NET Web Forms - C# version] NetWebCharts\CSharpASP\binaryseries.aspx
(Click here on how to convert this code to code-behind style.)<%@ Page Language="C#" Debug="true" %>
<%@ Import Namespace="ChartDirector" %>
<%@ Register TagPrefix="chart" Namespace="ChartDirector" Assembly="netchartdir" %>
<!DOCTYPE html>
<script runat="server">
//
// Page Load event handler
//
protected void Page_Load(object sender, EventArgs e)
{
// The data for the chart
double[] dataY = {1, 0, 1, 0, 1, 0, 1, 0, 1, 0, 1, 0, 1, 1};
DateTime[] dataX = {new DateTime(2008, 7, 1, 0, 0, 0), new DateTime(2008, 7, 1, 2, 17, 2),
new DateTime(2008, 7, 1, 8, 5, 30), new DateTime(2008, 7, 1, 10, 54, 10), new DateTime(2008,
7, 1, 15, 40, 0), new DateTime(2008, 7, 1, 18, 22, 20), new DateTime(2008, 7, 1, 22, 17, 14
), new DateTime(2008, 7, 2, 2, 55, 50), new DateTime(2008, 7, 2, 8, 17, 14), new DateTime(
2008, 7, 2, 11, 55, 50), new DateTime(2008, 7, 2, 13, 17, 14), new DateTime(2008, 7, 2, 17,
55, 50), new DateTime(2008, 7, 2, 20, 17, 14), new DateTime(2008, 7, 3, 0, 0, 0)};
// In this example, we only use position 1, 3, 5 for the data series. Positions 0, 2, 4, 6 are
// empty and serve as gaps.
string[] labels = {"", "ON Only Filling", "",
"<*font,color=cc2200*>ON<*/font*> / <*font,color=00aa22*>OFF<*/font*> Filling", "",
"Logic Line", ""};
// Create a XYChart object of size 600 x 180 pixels
XYChart c = new XYChart(600, 180);
// Add a title to the chart using 10 points Arial Bold font. Set top/bottom margins to 12
// pixels.
ChartDirector.TextBox title = c.addTitle("Binary Data Series Demonstration", "Arial Bold", 10);
// Tentatively set the plotarea at (100, 30) and of size 470 x 120 pixels. Use transparent
// border. Use grey (888888) solid line and light grey (ccccc) dotted line as major and minor
// vertical grid lines.
c.setPlotArea(100, 30, 470, 120, -1, -1, Chart.Transparent).setGridColor(Chart.Transparent,
0x888888, Chart.Transparent, c.dashLineColor(0xcccccc, Chart.DotLine));
// Set axes to transparent
c.xAxis().setColors(Chart.Transparent);
c.yAxis().setColors(Chart.Transparent);
// Set the y axis labels
c.yAxis().setLabels(labels);
// Set y-axis label style to 8pt Arial Bold
c.yAxis().setLabelStyle("Arial Bold", 8);
// Set x-axis major and minor tick density to 50 and 5 pixels. ChartDirector auto-scaling will
// use this as the guideline when putting ticks on the x-axis.
c.xAxis().setTickDensity(50, 5);
// Use "<*font=Arial Bold*>{value|mmm dd}" for the first label of an hour, and "{value|hh:nn}"
// for all other labels.
c.xAxis().setMultiFormat(Chart.StartOfDayFilter(), "<*font=Arial Bold*>{value|mmm dd}",
Chart.AllPassFilter(), "{value|hh:nn}");
//
// A Logic Line can be achieved using a StepLineLayer in ChartDirector
//
// Shift the data by 4.5, so instead of 0 - 1, it is now 4.5 to 5.5, or fluctuate around the y =
// 5 (Logic Line label) position.
double[] shiftedLine0 = new ArrayMath(dataY).add(4.5).result();
// Add step lines using the original and the reversed data
StepLineLayer layer0 = c.addStepLineLayer(shiftedLine0, 0x0000ff);
layer0.setXData(dataX);
//
// To perform ON/OFF filling, we draw the logic line, and its reverse, and fill the region in
// between
//
// Shift the data by 2.5, so instead of 0 - 1, it is now 2.5 to 3.5, or fluctuate around the y =
// 3 (ON/OFF Filing label) position.
double[] shiftedLine1 = new ArrayMath(dataY).add(2.5).result();
// Reverse the data, so the 0 becomes 1 and 1 becomes 0, and shift it as well.
double[] reverseShiftedLine1 = new ArrayMath(dataY).mul(-1).add(3.5).result();
// Add step lines using the original and the reversed data
StepLineLayer layer1 = c.addStepLineLayer(shiftedLine1, Chart.Transparent);
layer1.addDataSet(reverseShiftedLine1, Chart.Transparent);
layer1.setXData(dataX);
// Fill the region between the two step lines with green (00aa22) or red (cc2200), depending on
// whether the original or the reserve is higher.
c.addInterLineLayer(layer1.getLine(0), layer1.getLine(1), 0x00aa22, 0xcc2200);
//
// The ON Only filling is the same as ON/OFF filling, except the OFF filling color is
// transparent
//
// Shift the data by 0.5, so instead of 0 - 1, it is now 0.5 to 1.5, or fluctuate around the y =
// 1 (ON Only Filing label) position.
double[] shiftedLine2 = new ArrayMath(dataY).add(0.5).result();
// Reverse the data, so the 0 becomes 1 and 1 becomes 0, and shift it as well.
double[] reverseShiftedLine2 = new ArrayMath(dataY).mul(-1).add(1.5).result();
// Add step lines using the original and the reversed data
StepLineLayer layer2 = c.addStepLineLayer(shiftedLine2, Chart.Transparent);
layer2.addDataSet(reverseShiftedLine2, Chart.Transparent);
layer2.setXData(dataX);
// Fill the region between the two step lines with green (00aa22) or transparent, depending on
// whether the original or the reserve is higher.
c.addInterLineLayer(layer2.getLine(0), layer2.getLine(1), 0x00aa22, Chart.Transparent);
// Adjust the plot area size, such that the bounding box (inclusive of axes) is 10 pixels from
// the left edge, 10 pixels below the title, 30 pixels from the right edge, and 10 pixels above
// the bottom edge.
c.packPlotArea(10, title.getHeight() + 10, c.getWidth() - 30, c.getHeight() - 10);
// Output the chart
WebChartViewer1.Image = c.makeWebImage(Chart.SVG);
}
</script>
<html>
<head>
<script type="text/javascript" src="cdjcv.js"></script>
</head>
<body>
<chart:WebChartViewer id="WebChartViewer1" runat="server" />
</body>
</html>
[ASP.NET Web Forms - VB Version] NetWebCharts\VBNetASP\binaryseries.aspx
(Click here on how to convert this code to code-behind style.)<%@ Page Language="VB" Debug="true" %>
<%@ Import Namespace="ChartDirector" %>
<%@ Register TagPrefix="chart" Namespace="ChartDirector" Assembly="netchartdir" %>
<!DOCTYPE html>
<script runat="server">
'
' Page Load event handler
'
Protected Sub Page_Load(ByVal sender As System.Object, ByVal e As System.EventArgs)
' The data for the chart
Dim dataY() As Double = {1, 0, 1, 0, 1, 0, 1, 0, 1, 0, 1, 0, 1, 1}
Dim dataX() As Date = {New DateTime(2008, 7, 1, 0, 0, 0), New DateTime(2008, 7, 1, 2, 17, 2), _
New DateTime(2008, 7, 1, 8, 5, 30), New DateTime(2008, 7, 1, 10, 54, 10), New DateTime( _
2008, 7, 1, 15, 40, 0), New DateTime(2008, 7, 1, 18, 22, 20), New DateTime(2008, 7, 1, 22, _
17, 14), New DateTime(2008, 7, 2, 2, 55, 50), New DateTime(2008, 7, 2, 8, 17, 14), _
New DateTime(2008, 7, 2, 11, 55, 50), New DateTime(2008, 7, 2, 13, 17, 14), New DateTime( _
2008, 7, 2, 17, 55, 50), New DateTime(2008, 7, 2, 20, 17, 14), New DateTime(2008, 7, 3, 0, _
0, 0)}
' In this example, we only use position 1, 3, 5 for the data series. Positions 0, 2, 4, 6 are
' empty and serve as gaps.
Dim labels() As String = {"", "ON Only Filling", "", _
"<*font,color=cc2200*>ON<*/font*> / <*font,color=00aa22*>OFF<*/font*> Filling", "", _
"Logic Line", ""}
' Create a XYChart object of size 600 x 180 pixels
Dim c As XYChart = New XYChart(600, 180)
' Add a title to the chart using 10 points Arial Bold font. Set top/bottom margins to 12 pixels.
Dim title As ChartDirector.TextBox = c.addTitle("Binary Data Series Demonstration", _
"Arial Bold", 10)
' Tentatively set the plotarea at (100, 30) and of size 470 x 120 pixels. Use transparent
' border. Use grey (888888) solid line and light grey (ccccc) dotted line as major and minor
' vertical grid lines.
c.setPlotArea(100, 30, 470, 120, -1, -1, Chart.Transparent).setGridColor(Chart.Transparent, _
&H888888, Chart.Transparent, c.dashLineColor(&Hcccccc, Chart.DotLine))
' Set axes to transparent
c.xAxis().setColors(Chart.Transparent)
c.yAxis().setColors(Chart.Transparent)
' Set the y axis labels
c.yAxis().setLabels(labels)
' Set y-axis label style to 8pt Arial Bold
c.yAxis().setLabelStyle("Arial Bold", 8)
' Set x-axis major and minor tick density to 50 and 5 pixels. ChartDirector auto-scaling will
' use this as the guideline when putting ticks on the x-axis.
c.xAxis().setTickDensity(50, 5)
' Use "<*font=Arial Bold*>{value|mmm dd}" for the first label of an hour, and "{value|hh:nn}"
' for all other labels.
c.xAxis().setMultiFormat(Chart.StartOfDayFilter(), "<*font=Arial Bold*>{value|mmm dd}", _
Chart.AllPassFilter(), "{value|hh:nn}")
'
' A Logic Line can be achieved using a StepLineLayer in ChartDirector
'
' Shift the data by 4.5, so instead of 0 - 1, it is now 4.5 to 5.5, or fluctuate around the y =
' 5 (Logic Line label) position.
Dim shiftedLine0() As Double = New ArrayMath(dataY).add(4.5).result()
' Add step lines using the original and the reversed data
Dim layer0 As StepLineLayer = c.addStepLineLayer(shiftedLine0, &H0000ff)
layer0.setXData(dataX)
'
' To perform ON/OFF filling, we draw the logic line, and its reverse, and fill the region in
' between
'
' Shift the data by 2.5, so instead of 0 - 1, it is now 2.5 to 3.5, or fluctuate around the y =
' 3 (ON/OFF Filing label) position.
Dim shiftedLine1() As Double = New ArrayMath(dataY).add(2.5).result()
' Reverse the data, so the 0 becomes 1 and 1 becomes 0, and shift it as well.
Dim reverseShiftedLine1() As Double = New ArrayMath(dataY).mul(-1).add(3.5).result()
' Add step lines using the original and the reversed data
Dim layer1 As StepLineLayer = c.addStepLineLayer(shiftedLine1, Chart.Transparent)
layer1.addDataSet(reverseShiftedLine1, Chart.Transparent)
layer1.setXData(dataX)
' Fill the region between the two step lines with green (00aa22) or red (cc2200), depending on
' whether the original or the reserve is higher.
c.addInterLineLayer(layer1.getLine(0), layer1.getLine(1), &H00aa22, &Hcc2200)
'
' The ON Only filling is the same as ON/OFF filling, except the OFF filling color is transparent
'
' Shift the data by 0.5, so instead of 0 - 1, it is now 0.5 to 1.5, or fluctuate around the y =
' 1 (ON Only Filing label) position.
Dim shiftedLine2() As Double = New ArrayMath(dataY).add(0.5).result()
' Reverse the data, so the 0 becomes 1 and 1 becomes 0, and shift it as well.
Dim reverseShiftedLine2() As Double = New ArrayMath(dataY).mul(-1).add(1.5).result()
' Add step lines using the original and the reversed data
Dim layer2 As StepLineLayer = c.addStepLineLayer(shiftedLine2, Chart.Transparent)
layer2.addDataSet(reverseShiftedLine2, Chart.Transparent)
layer2.setXData(dataX)
' Fill the region between the two step lines with green (00aa22) or transparent, depending on
' whether the original or the reserve is higher.
c.addInterLineLayer(layer2.getLine(0), layer2.getLine(1), &H00aa22, Chart.Transparent)
' Adjust the plot area size, such that the bounding box (inclusive of axes) is 10 pixels from
' the left edge, 10 pixels below the title, 30 pixels from the right edge, and 10 pixels above
' the bottom edge.
c.packPlotArea(10, title.getHeight() + 10, c.getWidth() - 30, c.getHeight() - 10)
' Output the chart
WebChartViewer1.Image = c.makeWebImage(Chart.SVG)
End Sub
</script>
<html>
<head>
<script type="text/javascript" src="cdjcv.js"></script>
</head>
<body>
<chart:WebChartViewer id="WebChartViewer1" runat="server" />
</body>
</html>
[ASP.NET MVC - Controller] NetMvcCharts\Controllers\BinaryseriesController.cs
using System;
using System.Web.Mvc;
using ChartDirector;

namespace NetMvcCharts.Controllers
{
    public class BinaryseriesController : Controller
    {
        //
        // Default Action
        //
        public ActionResult Index()
        {
            ViewBag.Title = "Binary Data Series";
            createChart(ViewBag.Viewer = new RazorChartViewer(HttpContext, "chart1"));
            return View("~/Views/Shared/ChartView.cshtml");
        }

        //
        // Create chart
        //
        private void createChart(RazorChartViewer viewer)
        {
            // The data for the chart
            double[] dataY = {1, 0, 1, 0, 1, 0, 1, 0, 1, 0, 1, 0, 1, 1};
            DateTime[] dataX = {new DateTime(2008, 7, 1, 0, 0, 0), new DateTime(2008, 7, 1, 2, 17, 2),
                new DateTime(2008, 7, 1, 8, 5, 30), new DateTime(2008, 7, 1, 10, 54, 10), new DateTime(
                2008, 7, 1, 15, 40, 0), new DateTime(2008, 7, 1, 18, 22, 20), new DateTime(2008, 7, 1,
                22, 17, 14), new DateTime(2008, 7, 2, 2, 55, 50), new DateTime(2008, 7, 2, 8, 17, 14),
                new DateTime(2008, 7, 2, 11, 55, 50), new DateTime(2008, 7, 2, 13, 17, 14), new DateTime(
                2008, 7, 2, 17, 55, 50), new DateTime(2008, 7, 2, 20, 17, 14), new DateTime(2008, 7, 3,
                0, 0, 0)};

            // In this example, we only use position 1, 3, 5 for the data series. Positions 0, 2, 4, 6
            // are empty and serve as gaps.
            string[] labels = {"", "ON Only Filling", "",
                "<*font,color=cc2200*>ON<*/font*> / <*font,color=00aa22*>OFF<*/font*> Filling", "",
                "Logic Line", ""};

            // Create a XYChart object of size 600 x 180 pixels
            XYChart c = new XYChart(600, 180);

            // Add a title to the chart using 10 points Arial Bold font. Set top/bottom margins to 12
            // pixels.
            ChartDirector.TextBox title = c.addTitle("Binary Data Series Demonstration", "Arial Bold", 10
                );

            // Tentatively set the plotarea at (100, 30) and of size 470 x 120 pixels. Use transparent
            // border. Use grey (888888) solid line and light grey (ccccc) dotted line as major and minor
            // vertical grid lines.
            c.setPlotArea(100, 30, 470, 120, -1, -1, Chart.Transparent).setGridColor(Chart.Transparent,
                0x888888, Chart.Transparent, c.dashLineColor(0xcccccc, Chart.DotLine));

            // Set axes to transparent
            c.xAxis().setColors(Chart.Transparent);
            c.yAxis().setColors(Chart.Transparent);

            // Set the y axis labels
            c.yAxis().setLabels(labels);

            // Set y-axis label style to 8pt Arial Bold
            c.yAxis().setLabelStyle("Arial Bold", 8);

            // Set x-axis major and minor tick density to 50 and 5 pixels. ChartDirector auto-scaling
            // will use this as the guideline when putting ticks on the x-axis.
            c.xAxis().setTickDensity(50, 5);

            // Use "<*font=Arial Bold*>{value|mmm dd}" for the first label of an hour, and
            // "{value|hh:nn}" for all other labels.
            c.xAxis().setMultiFormat(Chart.StartOfDayFilter(), "<*font=Arial Bold*>{value|mmm dd}",
                Chart.AllPassFilter(), "{value|hh:nn}");

            //
            // A Logic Line can be achieved using a StepLineLayer in ChartDirector
            //

            // Shift the data by 4.5, so instead of 0 - 1, it is now 4.5 to 5.5, or fluctuate around the
            // y = 5 (Logic Line label) position.
            double[] shiftedLine0 = new ArrayMath(dataY).add(4.5).result();

            // Add step lines using the original and the reversed data
            StepLineLayer layer0 = c.addStepLineLayer(shiftedLine0, 0x0000ff);
            layer0.setXData(dataX);

            //
            // To perform ON/OFF filling, we draw the logic line, and its reverse, and fill the region in
            // between
            //

            // Shift the data by 2.5, so instead of 0 - 1, it is now 2.5 to 3.5, or fluctuate around the
            // y = 3 (ON/OFF Filing label) position.
            double[] shiftedLine1 = new ArrayMath(dataY).add(2.5).result();
            // Reverse the data, so the 0 becomes 1 and 1 becomes 0, and shift it as well.
            double[] reverseShiftedLine1 = new ArrayMath(dataY).mul(-1).add(3.5).result();

            // Add step lines using the original and the reversed data
            StepLineLayer layer1 = c.addStepLineLayer(shiftedLine1, Chart.Transparent);
            layer1.addDataSet(reverseShiftedLine1, Chart.Transparent);
            layer1.setXData(dataX);

            // Fill the region between the two step lines with green (00aa22) or red (cc2200), depending
            // on whether the original or the reserve is higher.
            c.addInterLineLayer(layer1.getLine(0), layer1.getLine(1), 0x00aa22, 0xcc2200);

            //
            // The ON Only filling is the same as ON/OFF filling, except the OFF filling color is
            // transparent
            //

            // Shift the data by 0.5, so instead of 0 - 1, it is now 0.5 to 1.5, or fluctuate around the
            // y = 1 (ON Only Filing label) position.
            double[] shiftedLine2 = new ArrayMath(dataY).add(0.5).result();
            // Reverse the data, so the 0 becomes 1 and 1 becomes 0, and shift it as well.
            double[] reverseShiftedLine2 = new ArrayMath(dataY).mul(-1).add(1.5).result();

            // Add step lines using the original and the reversed data
            StepLineLayer layer2 = c.addStepLineLayer(shiftedLine2, Chart.Transparent);
            layer2.addDataSet(reverseShiftedLine2, Chart.Transparent);
            layer2.setXData(dataX);

            // Fill the region between the two step lines with green (00aa22) or transparent, depending
            // on whether the original or the reserve is higher.
            c.addInterLineLayer(layer2.getLine(0), layer2.getLine(1), 0x00aa22, Chart.Transparent);

            // Adjust the plot area size, such that the bounding box (inclusive of axes) is 10 pixels
            // from the left edge, 10 pixels  below the title, 30 pixels from the right edge, and 10
            // pixels above the bottom edge.
            c.packPlotArea(10, title.getHeight() + 10, c.getWidth() - 30, c.getHeight() - 10);

            // Output the chart
            viewer.Image = c.makeWebImage(Chart.SVG);
        }
    }
}
[ASP.NET MVC - View] NetMvcCharts\Views\Shared\ChartView.cshtml
@{ Layout = null; }

<!DOCTYPE html>

<html>
<head>
    <meta name="viewport" content="width=device-width" />
    <title>@ViewBag.Title</title>
    <style>
        @ViewBag.Style
    </style>
    @Scripts.Render("~/Scripts/cdjcv.js")
</head>
<body style="margin:5px 0px 0px 5px">
    <div style="font:bold 18pt verdana;">
        @ViewBag.Title
    </div>
    <hr style="border:solid 1px #000080; background:#000080" />
    <div>
        @{
            if (ViewBag.Viewer is Array)
            {
                // Display multiple charts
                for (int i = 0; i < ViewBag.Viewer.Length; ++i)
                {
                    @:@Html.Raw(ViewBag.Viewer[i].RenderHTML())
                }
            }
            else
            {
                // Display one chart only
                @:@Html.Raw(ViewBag.Viewer.RenderHTML())
            }
        }
    </div>
</body>
</html>
© 2023 Advanced Software Engineering Limited. All rights reserved.