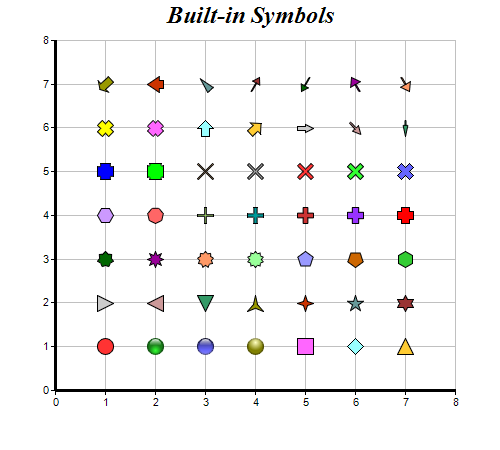
This example demonstrates the built-in symbols supported by ChartDirector.
ChartDirector 7.1 (.NET Edition)
Built-In Symbols
Source Code Listing
using System;
using ChartDirector;

namespace CSharpChartExplorer
{
    public class builtinsymbols : DemoModule
    {
        //Name of demo module
        public string getName() { return "Built-in Symbols"; }

        //Number of charts produced in this demo module
        public int getNoOfCharts() { return 1; }

        //Main code for creating chart.
        //Note: the argument chartIndex is unused because this demo only has 1 chart.
        public void createChart(WinChartViewer viewer, int chartIndex)
        {
            // Some ChartDirector built-in symbols
            int[] symbols = {Chart.CircleShape, Chart.GlassSphereShape, Chart.GlassSphere2Shape,
                Chart.SolidSphereShape, Chart.SquareShape, Chart.DiamondShape, Chart.TriangleShape,
                Chart.RightTriangleShape, Chart.LeftTriangleShape, Chart.InvertedTriangleShape,
                Chart.StarShape(3), Chart.StarShape(4), Chart.StarShape(5), Chart.StarShape(6),
                Chart.StarShape(7), Chart.StarShape(8), Chart.StarShape(9), Chart.StarShape(10),
                Chart.PolygonShape(5), Chart.Polygon2Shape(5), Chart.PolygonShape(6),
                Chart.Polygon2Shape(6), Chart.Polygon2Shape(7), Chart.CrossShape(0.1),
                Chart.CrossShape(0.2), Chart.CrossShape(0.3), Chart.CrossShape(0.4),
                Chart.CrossShape(0.5), Chart.CrossShape(0.6), Chart.CrossShape(0.7),
                Chart.Cross2Shape(0.1), Chart.Cross2Shape(0.2), Chart.Cross2Shape(0.3),
                Chart.Cross2Shape(0.4), Chart.Cross2Shape(0.5), Chart.Cross2Shape(0.6),
                Chart.Cross2Shape(0.7), Chart.ArrowShape(), Chart.ArrowShape(45), Chart.ArrowShape(
                90, 0.5), Chart.ArrowShape(135, 0.5, 0.2), Chart.ArrowShape(180, 0.3, 0.2, 0.3),
                Chart.ArrowShape(225, 1, 0.5, 0.7), Chart.ArrowShape(270, 1, 0.5, 0.25),
                Chart.ArrowShape(315, 0.5, 0.5, 0), Chart.ArrowShape(30, 0.5, 0.1, 0.6),
                Chart.ArrowShape(210, 0.5, 0.1, 0.6), Chart.ArrowShape(330, 0.7, 0.1),
                Chart.ArrowShape(150, 0.7, 0.1)};

            // Create a XYChart object of size 500 x 450 pixels
            XYChart c = new XYChart(500, 450);

            // Set the plotarea at (55, 40) and of size 400 x 350 pixels, with a light grey border
            // (0xc0c0c0). Turn on both horizontal and vertical grid lines with light grey color
            // (0xc0c0c0)
            c.setPlotArea(55, 40, 400, 350, -1, -1, 0xc0c0c0, 0xc0c0c0, -1);

            // Add a title to the chart using 18pt Times Bold Itatic font.
            c.addTitle("Built-in Symbols", "Times New Roman Bold Italic", 18);

            // Set the axes line width to 3 pixels
            c.xAxis().setWidth(3);
            c.yAxis().setWidth(3);

            // Ensure the ticks are at least 1 unit part (integer ticks)
            c.xAxis().setMinTickInc(1);
            c.yAxis().setMinTickInc(1);

            // Add each symbol as a separate scatter layer.
            for(int i = 0; i < symbols.Length; ++i) {
                c.addScatterLayer(new double[] {i % 7 + 1.0}, new double[] {i / 7 + 1.0}, "",
                    symbols[i], 17);
            }

            // Output the chart
            viewer.Chart = c;

            //include tool tip for the chart
            viewer.ImageMap = c.getHTMLImageMap("clickable", "", "title='(x, y) = ({x}, {value})'");
        }
    }
}Imports System
Imports Microsoft.VisualBasic
Imports ChartDirector
Public Class builtinsymbols
Implements DemoModule
'Name of demo module
Public Function getName() As String Implements DemoModule.getName
Return "Built-in Symbols"
End Function
'Number of charts produced in this demo module
Public Function getNoOfCharts() As Integer Implements DemoModule.getNoOfCharts
Return 1
End Function
'Main code for creating chart.
'Note: the argument chartIndex is unused because this demo only has 1 chart.
Public Sub createChart(viewer As WinChartViewer, chartIndex As Integer) _
Implements DemoModule.createChart
' Some ChartDirector built-in symbols
Dim symbols() As Integer = {Chart.CircleShape, Chart.GlassSphereShape, _
Chart.GlassSphere2Shape, Chart.SolidSphereShape, Chart.SquareShape, _
Chart.DiamondShape, Chart.TriangleShape, Chart.RightTriangleShape, _
Chart.LeftTriangleShape, Chart.InvertedTriangleShape, Chart.StarShape(3), _
Chart.StarShape(4), Chart.StarShape(5), Chart.StarShape(6), Chart.StarShape(7), _
Chart.StarShape(8), Chart.StarShape(9), Chart.StarShape(10), Chart.PolygonShape(5), _
Chart.Polygon2Shape(5), Chart.PolygonShape(6), Chart.Polygon2Shape(6), _
Chart.Polygon2Shape(7), Chart.CrossShape(0.1), Chart.CrossShape(0.2), _
Chart.CrossShape(0.3), Chart.CrossShape(0.4), Chart.CrossShape(0.5), Chart.CrossShape( _
0.6), Chart.CrossShape(0.7), Chart.Cross2Shape(0.1), Chart.Cross2Shape(0.2), _
Chart.Cross2Shape(0.3), Chart.Cross2Shape(0.4), Chart.Cross2Shape(0.5), _
Chart.Cross2Shape(0.6), Chart.Cross2Shape(0.7), Chart.ArrowShape(), Chart.ArrowShape( _
45), Chart.ArrowShape(90, 0.5), Chart.ArrowShape(135, 0.5, 0.2), Chart.ArrowShape(180, _
0.3, 0.2, 0.3), Chart.ArrowShape(225, 1, 0.5, 0.7), Chart.ArrowShape(270, 1, 0.5, 0.25 _
), Chart.ArrowShape(315, 0.5, 0.5, 0), Chart.ArrowShape(30, 0.5, 0.1, 0.6), _
Chart.ArrowShape(210, 0.5, 0.1, 0.6), Chart.ArrowShape(330, 0.7, 0.1), _
Chart.ArrowShape(150, 0.7, 0.1)}
' Create a XYChart object of size 500 x 450 pixels
Dim c As XYChart = New XYChart(500, 450)
' Set the plotarea at (55, 40) and of size 400 x 350 pixels, with a light grey border
' (0xc0c0c0). Turn on both horizontal and vertical grid lines with light grey color
' (0xc0c0c0)
c.setPlotArea(55, 40, 400, 350, -1, -1, &Hc0c0c0, &Hc0c0c0, -1)
' Add a title to the chart using 18pt Times Bold Itatic font.
c.addTitle("Built-in Symbols", "Times New Roman Bold Italic", 18)
' Set the axes line width to 3 pixels
c.xAxis().setWidth(3)
c.yAxis().setWidth(3)
' Ensure the ticks are at least 1 unit part (integer ticks)
c.xAxis().setMinTickInc(1)
c.yAxis().setMinTickInc(1)
' Add each symbol as a separate scatter layer.
For i As Integer = 0 To UBound(symbols)
c.addScatterLayer(New Double() {i Mod 7 + 1.0}, New Double() {i \ 7 + 1.0}, "", _
symbols(i), 17)
Next
' Output the chart
viewer.Chart = c
'include tool tip for the chart
viewer.ImageMap = c.getHTMLImageMap("clickable", "", "title='(x, y) = ({x}, {value})'")
End Sub
End Classusing System;
using ChartDirector;
namespace CSharpWPFCharts
{
public class builtinsymbols : DemoModule
{
//Name of demo module
public string getName() { return "Built-in Symbols"; }
//Number of charts produced in this demo module
public int getNoOfCharts() { return 1; }
//Main code for creating chart.
//Note: the argument chartIndex is unused because this demo only has 1 chart.
public void createChart(WPFChartViewer viewer, int chartIndex)
{
// Some ChartDirector built-in symbols
int[] symbols = {Chart.CircleShape, Chart.GlassSphereShape, Chart.GlassSphere2Shape,
Chart.SolidSphereShape, Chart.SquareShape, Chart.DiamondShape, Chart.TriangleShape,
Chart.RightTriangleShape, Chart.LeftTriangleShape, Chart.InvertedTriangleShape,
Chart.StarShape(3), Chart.StarShape(4), Chart.StarShape(5), Chart.StarShape(6),
Chart.StarShape(7), Chart.StarShape(8), Chart.StarShape(9), Chart.StarShape(10),
Chart.PolygonShape(5), Chart.Polygon2Shape(5), Chart.PolygonShape(6),
Chart.Polygon2Shape(6), Chart.Polygon2Shape(7), Chart.CrossShape(0.1),
Chart.CrossShape(0.2), Chart.CrossShape(0.3), Chart.CrossShape(0.4),
Chart.CrossShape(0.5), Chart.CrossShape(0.6), Chart.CrossShape(0.7),
Chart.Cross2Shape(0.1), Chart.Cross2Shape(0.2), Chart.Cross2Shape(0.3),
Chart.Cross2Shape(0.4), Chart.Cross2Shape(0.5), Chart.Cross2Shape(0.6),
Chart.Cross2Shape(0.7), Chart.ArrowShape(), Chart.ArrowShape(45), Chart.ArrowShape(
90, 0.5), Chart.ArrowShape(135, 0.5, 0.2), Chart.ArrowShape(180, 0.3, 0.2, 0.3),
Chart.ArrowShape(225, 1, 0.5, 0.7), Chart.ArrowShape(270, 1, 0.5, 0.25),
Chart.ArrowShape(315, 0.5, 0.5, 0), Chart.ArrowShape(30, 0.5, 0.1, 0.6),
Chart.ArrowShape(210, 0.5, 0.1, 0.6), Chart.ArrowShape(330, 0.7, 0.1),
Chart.ArrowShape(150, 0.7, 0.1)};
// Create a XYChart object of size 500 x 450 pixels
XYChart c = new XYChart(500, 450);
// Set the plotarea at (55, 40) and of size 400 x 350 pixels, with a light grey border
// (0xc0c0c0). Turn on both horizontal and vertical grid lines with light grey color
// (0xc0c0c0)
c.setPlotArea(55, 40, 400, 350, -1, -1, 0xc0c0c0, 0xc0c0c0, -1);
// Add a title to the chart using 18pt Times Bold Itatic font.
c.addTitle("Built-in Symbols", "Times New Roman Bold Italic", 18);
// Set the axes line width to 3 pixels
c.xAxis().setWidth(3);
c.yAxis().setWidth(3);
// Ensure the ticks are at least 1 unit part (integer ticks)
c.xAxis().setMinTickInc(1);
c.yAxis().setMinTickInc(1);
// Add each symbol as a separate scatter layer.
for(int i = 0; i < symbols.Length; ++i) {
c.addScatterLayer(new double[] {i % 7 + 1.0}, new double[] {i / 7 + 1.0}, "",
symbols[i], 17);
}
// Output the chart
viewer.Chart = c;
//include tool tip for the chart
viewer.ImageMap = c.getHTMLImageMap("clickable", "", "title='(x, y) = ({x}, {value})'");
}
}
}<%@ Page Language="C#" Debug="true" %>
<%@ Import Namespace="ChartDirector" %>
<%@ Register TagPrefix="chart" Namespace="ChartDirector" Assembly="netchartdir" %>
<!DOCTYPE html>
<script runat="server">
//
// Page Load event handler
//
protected void Page_Load(object sender, EventArgs e)
{
// Some ChartDirector built-in symbols
int[] symbols = {Chart.CircleShape, Chart.GlassSphereShape, Chart.GlassSphere2Shape,
Chart.SolidSphereShape, Chart.SquareShape, Chart.DiamondShape, Chart.TriangleShape,
Chart.RightTriangleShape, Chart.LeftTriangleShape, Chart.InvertedTriangleShape,
Chart.StarShape(3), Chart.StarShape(4), Chart.StarShape(5), Chart.StarShape(6),
Chart.StarShape(7), Chart.StarShape(8), Chart.StarShape(9), Chart.StarShape(10),
Chart.PolygonShape(5), Chart.Polygon2Shape(5), Chart.PolygonShape(6), Chart.Polygon2Shape(6
), Chart.Polygon2Shape(7), Chart.CrossShape(0.1), Chart.CrossShape(0.2), Chart.CrossShape(
0.3), Chart.CrossShape(0.4), Chart.CrossShape(0.5), Chart.CrossShape(0.6), Chart.CrossShape(
0.7), Chart.Cross2Shape(0.1), Chart.Cross2Shape(0.2), Chart.Cross2Shape(0.3),
Chart.Cross2Shape(0.4), Chart.Cross2Shape(0.5), Chart.Cross2Shape(0.6), Chart.Cross2Shape(
0.7), Chart.ArrowShape(), Chart.ArrowShape(45), Chart.ArrowShape(90, 0.5), Chart.ArrowShape(
135, 0.5, 0.2), Chart.ArrowShape(180, 0.3, 0.2, 0.3), Chart.ArrowShape(225, 1, 0.5, 0.7),
Chart.ArrowShape(270, 1, 0.5, 0.25), Chart.ArrowShape(315, 0.5, 0.5, 0), Chart.ArrowShape(
30, 0.5, 0.1, 0.6), Chart.ArrowShape(210, 0.5, 0.1, 0.6), Chart.ArrowShape(330, 0.7, 0.1),
Chart.ArrowShape(150, 0.7, 0.1)};
// Create a XYChart object of size 500 x 450 pixels
XYChart c = new XYChart(500, 450);
// Set the plotarea at (55, 40) and of size 400 x 350 pixels, with a light grey border
// (0xc0c0c0). Turn on both horizontal and vertical grid lines with light grey color (0xc0c0c0)
c.setPlotArea(55, 40, 400, 350, -1, -1, 0xc0c0c0, 0xc0c0c0, -1);
// Add a title to the chart using 18pt Times Bold Itatic font.
c.addTitle("Built-in Symbols", "Times New Roman Bold Italic", 18);
// Set the axes line width to 3 pixels
c.xAxis().setWidth(3);
c.yAxis().setWidth(3);
// Ensure the ticks are at least 1 unit part (integer ticks)
c.xAxis().setMinTickInc(1);
c.yAxis().setMinTickInc(1);
// Add each symbol as a separate scatter layer.
for(int i = 0; i < symbols.Length; ++i) {
c.addScatterLayer(new double[] {i % 7 + 1.0}, new double[] {i / 7 + 1.0}, "", symbols[i], 17
);
}
// Output the chart
WebChartViewer1.Image = c.makeWebImage(Chart.SVG);
// Include tool tip for the chart
WebChartViewer1.ImageMap = c.getHTMLImageMap("", "", "title='(x, y) = ({x}, {value})'");
}
</script>
<html>
<head>
<script type="text/javascript" src="cdjcv.js"></script>
</head>
<body>
<chart:WebChartViewer id="WebChartViewer1" runat="server" />
</body>
</html><%@ Page Language="VB" Debug="true" %>
<%@ Import Namespace="ChartDirector" %>
<%@ Register TagPrefix="chart" Namespace="ChartDirector" Assembly="netchartdir" %>
<!DOCTYPE html>
<script runat="server">
'
' Page Load event handler
'
Protected Sub Page_Load(ByVal sender As System.Object, ByVal e As System.EventArgs)
' Some ChartDirector built-in symbols
Dim symbols() As Integer = {Chart.CircleShape, Chart.GlassSphereShape, _
Chart.GlassSphere2Shape, Chart.SolidSphereShape, Chart.SquareShape, Chart.DiamondShape, _
Chart.TriangleShape, Chart.RightTriangleShape, Chart.LeftTriangleShape, _
Chart.InvertedTriangleShape, Chart.StarShape(3), Chart.StarShape(4), Chart.StarShape(5), _
Chart.StarShape(6), Chart.StarShape(7), Chart.StarShape(8), Chart.StarShape(9), _
Chart.StarShape(10), Chart.PolygonShape(5), Chart.Polygon2Shape(5), Chart.PolygonShape(6), _
Chart.Polygon2Shape(6), Chart.Polygon2Shape(7), Chart.CrossShape(0.1), Chart.CrossShape( _
0.2), Chart.CrossShape(0.3), Chart.CrossShape(0.4), Chart.CrossShape(0.5), _
Chart.CrossShape(0.6), Chart.CrossShape(0.7), Chart.Cross2Shape(0.1), Chart.Cross2Shape( _
0.2), Chart.Cross2Shape(0.3), Chart.Cross2Shape(0.4), Chart.Cross2Shape(0.5), _
Chart.Cross2Shape(0.6), Chart.Cross2Shape(0.7), Chart.ArrowShape(), Chart.ArrowShape(45), _
Chart.ArrowShape(90, 0.5), Chart.ArrowShape(135, 0.5, 0.2), Chart.ArrowShape(180, 0.3, _
0.2, 0.3), Chart.ArrowShape(225, 1, 0.5, 0.7), Chart.ArrowShape(270, 1, 0.5, 0.25), _
Chart.ArrowShape(315, 0.5, 0.5, 0), Chart.ArrowShape(30, 0.5, 0.1, 0.6), Chart.ArrowShape( _
210, 0.5, 0.1, 0.6), Chart.ArrowShape(330, 0.7, 0.1), Chart.ArrowShape(150, 0.7, 0.1)}
' Create a XYChart object of size 500 x 450 pixels
Dim c As XYChart = New XYChart(500, 450)
' Set the plotarea at (55, 40) and of size 400 x 350 pixels, with a light grey border
' (0xc0c0c0). Turn on both horizontal and vertical grid lines with light grey color (0xc0c0c0)
c.setPlotArea(55, 40, 400, 350, -1, -1, &Hc0c0c0, &Hc0c0c0, -1)
' Add a title to the chart using 18pt Times Bold Itatic font.
c.addTitle("Built-in Symbols", "Times New Roman Bold Italic", 18)
' Set the axes line width to 3 pixels
c.xAxis().setWidth(3)
c.yAxis().setWidth(3)
' Ensure the ticks are at least 1 unit part (integer ticks)
c.xAxis().setMinTickInc(1)
c.yAxis().setMinTickInc(1)
' Add each symbol as a separate scatter layer.
For i As Integer = 0 To UBound(symbols)
c.addScatterLayer(New Double() {i Mod 7 + 1.0}, New Double() {i \ 7 + 1.0}, "", symbols(i _
), 17)
Next
' Output the chart
WebChartViewer1.Image = c.makeWebImage(Chart.SVG)
' Include tool tip for the chart
WebChartViewer1.ImageMap = c.getHTMLImageMap("", "", "title='(x, y) = ({x}, {value})'")
End Sub
</script>
<html>
<head>
<script type="text/javascript" src="cdjcv.js"></script>
</head>
<body>
<chart:WebChartViewer id="WebChartViewer1" runat="server" />
</body>
</html>using System;
using System.Web.Mvc;
using ChartDirector;
namespace NetMvcCharts.Controllers
{
public class BuiltinsymbolsController : Controller
{
//
// Default Action
//
public ActionResult Index()
{
ViewBag.Title = "Built-in Symbols";
createChart(ViewBag.Viewer = new RazorChartViewer(HttpContext, "chart1"));
return View("~/Views/Shared/ChartView.cshtml");
}
//
// Create chart
//
private void createChart(RazorChartViewer viewer)
{
// Some ChartDirector built-in symbols
int[] symbols = {Chart.CircleShape, Chart.GlassSphereShape, Chart.GlassSphere2Shape,
Chart.SolidSphereShape, Chart.SquareShape, Chart.DiamondShape, Chart.TriangleShape,
Chart.RightTriangleShape, Chart.LeftTriangleShape, Chart.InvertedTriangleShape,
Chart.StarShape(3), Chart.StarShape(4), Chart.StarShape(5), Chart.StarShape(6),
Chart.StarShape(7), Chart.StarShape(8), Chart.StarShape(9), Chart.StarShape(10),
Chart.PolygonShape(5), Chart.Polygon2Shape(5), Chart.PolygonShape(6),
Chart.Polygon2Shape(6), Chart.Polygon2Shape(7), Chart.CrossShape(0.1), Chart.CrossShape(
0.2), Chart.CrossShape(0.3), Chart.CrossShape(0.4), Chart.CrossShape(0.5),
Chart.CrossShape(0.6), Chart.CrossShape(0.7), Chart.Cross2Shape(0.1), Chart.Cross2Shape(
0.2), Chart.Cross2Shape(0.3), Chart.Cross2Shape(0.4), Chart.Cross2Shape(0.5),
Chart.Cross2Shape(0.6), Chart.Cross2Shape(0.7), Chart.ArrowShape(), Chart.ArrowShape(45),
Chart.ArrowShape(90, 0.5), Chart.ArrowShape(135, 0.5, 0.2), Chart.ArrowShape(180, 0.3,
0.2, 0.3), Chart.ArrowShape(225, 1, 0.5, 0.7), Chart.ArrowShape(270, 1, 0.5, 0.25),
Chart.ArrowShape(315, 0.5, 0.5, 0), Chart.ArrowShape(30, 0.5, 0.1, 0.6),
Chart.ArrowShape(210, 0.5, 0.1, 0.6), Chart.ArrowShape(330, 0.7, 0.1), Chart.ArrowShape(
150, 0.7, 0.1)};
// Create a XYChart object of size 500 x 450 pixels
XYChart c = new XYChart(500, 450);
// Set the plotarea at (55, 40) and of size 400 x 350 pixels, with a light grey border
// (0xc0c0c0). Turn on both horizontal and vertical grid lines with light grey color
// (0xc0c0c0)
c.setPlotArea(55, 40, 400, 350, -1, -1, 0xc0c0c0, 0xc0c0c0, -1);
// Add a title to the chart using 18pt Times Bold Itatic font.
c.addTitle("Built-in Symbols", "Times New Roman Bold Italic", 18);
// Set the axes line width to 3 pixels
c.xAxis().setWidth(3);
c.yAxis().setWidth(3);
// Ensure the ticks are at least 1 unit part (integer ticks)
c.xAxis().setMinTickInc(1);
c.yAxis().setMinTickInc(1);
// Add each symbol as a separate scatter layer.
for(int i = 0; i < symbols.Length; ++i) {
c.addScatterLayer(new double[] {i % 7 + 1.0}, new double[] {i / 7 + 1.0}, "", symbols[i],
17);
}
// Output the chart
viewer.Image = c.makeWebImage(Chart.SVG);
// Include tool tip for the chart
viewer.ImageMap = c.getHTMLImageMap("", "", "title='(x, y) = ({x}, {value})'");
}
}
}@{ Layout = null; }
<!DOCTYPE html>
<html>
<head>
<meta name="viewport" content="width=device-width" />
<title>@ViewBag.Title</title>
<style>
@ViewBag.Style
</style>
@Scripts.Render("~/Scripts/cdjcv.js")
</head>
<body style="margin:5px 0px 0px 5px">
<div style="font:bold 18pt verdana;">
@ViewBag.Title
</div>
<hr style="border:solid 1px #000080; background:#000080" />
<div>
@{
if (ViewBag.Viewer is Array)
{
// Display multiple charts
for (int i = 0; i < ViewBag.Viewer.Length; ++i)
{
@:@Html.Raw(ViewBag.Viewer[i].RenderHTML())
}
}
else
{
// Display one chart only
@:@Html.Raw(ViewBag.Viewer.RenderHTML())
}
}
</div>
</body>
</html>