
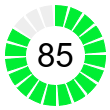
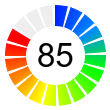
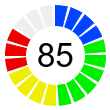
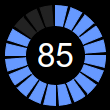
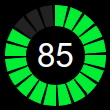
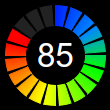
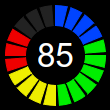
This example demonstrates circular bar meters in segmented style.
This example is similar to the Circular Bar Meter example except that the ring sectors are segmented.
ChartDirector 7.1 (.NET Edition)
Circular Bar Meter (2)
Source Code Listing
using System;
using ChartDirector;

namespace CSharpChartExplorer
{
    public class circularbarmeter2 : DemoModule
    {
        //Name of demo module
        public string getName() { return "Circular Bar Meters (2)"; }

        //Number of charts produced in this demo module
        public int getNoOfCharts() { return 8; }

        //Main code for creating charts
        public void createChart(WinChartViewer viewer, int chartIndex)
        {
            // The value to display on the meter
            double value = 85;

            // The meter radius and angle
            int radius = 50;
            double angle = value * 360.0 / 100;

            // Create an AngularMeter with transparent background
            AngularMeter m = new AngularMeter(radius * 2 + 10, radius * 2 + 10, Chart.Transparent);

            // Set the center, radius and angular range of the meter
            m.setMeter(m.getWidth() / 2, m.getHeight() / 2, radius, 0, 360);

            // For circular bar meters, we do not need pointer or graduation, so we hide them.
            m.setMeterColors(Chart.Transparent, Chart.Transparent, Chart.Transparent);
            m.setCap(0, Chart.Transparent);

            // In this example, the circular bar has 20 segments
            int segmentCount = 20;

            // The angular step
            double angleStep = 360.0 / segmentCount;

            // The gap between segments is 4.5 degrees
            double angleGap = 4.5;

            //
            // This example demonstrates several coloring styles
            //

            // Thd default fill and blank colors
            int fillColor = 0x336699;
            int blankColor = 0xeeeeee;

            if (chartIndex >= 4) {
                // Use dark background style
                m.setColors(Chart.whiteOnBlackPalette);
                fillColor = 0x6699ff;
                blankColor = 0x222222;
            }

            if (chartIndex % 4 == 1) {
                // Alternative fill color
                fillColor = 0x00ee33;
            } else if (chartIndex % 4 == 2) {
                // Use a smooth color scale as the fill color
                int[] smoothColorScale = {0, 0x0022ff, 15, 0x0088ff, 30, 0x00ff00, 55, 0xffff00, 80,
                    0xff0000, 100, 0xff0000};
                fillColor = m.getDrawArea().angleGradientColor(m.getWidth() / 2, m.getHeight() / 2,
                    0, 360, radius, radius - 20, smoothColorScale);
            } else if (chartIndex % 4 == 3) {
                // Use a step color scale as the fill color
                int[] stepColorScale = {0, 0x0044ff, 20, 0x00ee00, 50, 0xeeee00, 70, 0xee0000, 100};
                fillColor = m.getDrawArea().angleGradientColor(m.getWidth() / 2, m.getHeight() / 2,
                    -angleGap / 2, 360 - angleGap / 2, radius, radius - 20, stepColorScale);
            }

            //
            // Now we draw the segments of the bar meter
            //

            // The segment that contains the value
            int currentSegment = (int)(angle / angleStep);

            // Segments after the current segment is colored with the blank color
            for(int i = currentSegment + 1; i < segmentCount; ++i) {
                m.addRingSector(radius, radius - 20, i * angleStep, (i + 1) * angleStep - angleGap,
                    blankColor);
            }

            // Segments before the current segment is colored with the fill color
            for(int i = 0; i < currentSegment; ++i) {
                m.addRingSector(radius, radius - 20, i * angleStep, (i + 1) * angleStep - angleGap,
                    fillColor);
            }

            // Segment that contains the angle will be partially filled and partially blank. We need
            // to adjust the angle to compensated for the angle gap.
            double adjustedAngle = currentSegment * angleStep + (angle - currentSegment * angleStep)
                 * (1 - angleGap / angleStep);

            // The blank part of the segment
            if ((currentSegment + 1) * angleStep > angle) {
                m.addRingSector(radius, radius - 20, adjustedAngle, (currentSegment + 1) * angleStep
                     - angleGap, blankColor);
            }

            // The filled part of the segment.
            if (angle > currentSegment * angleStep) {
                m.addRingSector(radius, radius - 20, currentSegment * angleStep, adjustedAngle,
                    fillColor);
            }

            // Add a label at the center to display the value
            m.addText(m.getWidth() / 2, m.getHeight() / 2, m.formatValue(value, "{value}"), "Arial",
                25, Chart.TextColor, Chart.Center).setMargin(0);

            // Output the chart
            viewer.Chart = m;
        }
    }
}Imports System
Imports Microsoft.VisualBasic
Imports ChartDirector
Public Class circularbarmeter2
Implements DemoModule
'Name of demo module
Public Function getName() As String Implements DemoModule.getName
Return "Circular Bar Meters (2)"
End Function
'Number of charts produced in this demo module
Public Function getNoOfCharts() As Integer Implements DemoModule.getNoOfCharts
Return 8
End Function
'Main code for creating charts
Public Sub createChart(viewer As WinChartViewer, chartIndex As Integer) _
Implements DemoModule.createChart
' The value to display on the meter
Dim value As Double = 85
' The meter radius and angle
Dim radius As Integer = 50
Dim angle As Double = value * 360.0 / 100
' Create an AngularMeter with transparent background
Dim m As AngularMeter = New AngularMeter(radius * 2 + 10, radius * 2 + 10, _
Chart.Transparent)
' Set the center, radius and angular range of the meter
m.setMeter(m.getWidth() \ 2, m.getHeight() \ 2, radius, 0, 360)
' For circular bar meters, we do not need pointer or graduation, so we hide them.
m.setMeterColors(Chart.Transparent, Chart.Transparent, Chart.Transparent)
m.setCap(0, Chart.Transparent)
' In this example, the circular bar has 20 segments
Dim segmentCount As Integer = 20
' The angular step
Dim angleStep As Double = 360.0 / segmentCount
' The gap between segments is 4.5 degrees
Dim angleGap As Double = 4.5
'
' This example demonstrates several coloring styles
'
' Thd default fill and blank colors
Dim fillColor As Integer = &H336699
Dim blankColor As Integer = &Heeeeee
If chartIndex >= 4 Then
' Use dark background style
m.setColors(Chart.whiteOnBlackPalette)
fillColor = &H6699ff
blankColor = &H222222
End If
If chartIndex Mod 4 = 1 Then
' Alternative fill color
fillColor = &H00ee33
ElseIf chartIndex Mod 4 = 2 Then
' Use a smooth color scale as the fill color
Dim smoothColorScale() As Integer = {0, &H0022ff, 15, &H0088ff, 30, &H00ff00, 55, _
&Hffff00, 80, &Hff0000, 100, &Hff0000}
fillColor = m.getDrawArea().angleGradientColor(m.getWidth() \ 2, m.getHeight() \ 2, 0, _
360, radius, radius - 20, smoothColorScale)
ElseIf chartIndex Mod 4 = 3 Then
' Use a step color scale as the fill color
Dim stepColorScale() As Integer = {0, &H0044ff, 20, &H00ee00, 50, &Heeee00, 70, _
&Hee0000, 100}
fillColor = m.getDrawArea().angleGradientColor(m.getWidth() \ 2, m.getHeight() \ 2, _
-angleGap / 2, 360 - angleGap / 2, radius, radius - 20, stepColorScale)
End If
'
' Now we draw the segments of the bar meter
'
' The segment that contains the value
Dim currentSegment As Integer = Int(angle / angleStep)
' Segments after the current segment is colored with the blank color
For i As Integer = currentSegment + 1 To segmentCount - 1
m.addRingSector(radius, radius - 20, i * angleStep, (i + 1) * angleStep - angleGap, _
blankColor)
Next
' Segments before the current segment is colored with the fill color
For i As Integer = 0 To currentSegment - 1
m.addRingSector(radius, radius - 20, i * angleStep, (i + 1) * angleStep - angleGap, _
fillColor)
Next
' Segment that contains the angle will be partially filled and partially blank. We need to
' adjust the angle to compensated for the angle gap.
Dim adjustedAngle As Double = currentSegment * angleStep + (angle - currentSegment * _
angleStep) * (1 - angleGap / angleStep)
' The blank part of the segment
If (currentSegment + 1) * angleStep > angle Then
m.addRingSector(radius, radius - 20, adjustedAngle, (currentSegment + 1) * angleStep - _
angleGap, blankColor)
End If
' The filled part of the segment.
If angle > currentSegment * angleStep Then
m.addRingSector(radius, radius - 20, currentSegment * angleStep, adjustedAngle, _
fillColor)
End If
' Add a label at the center to display the value
m.addText(m.getWidth() \ 2, m.getHeight() \ 2, m.formatValue(value, "{value}"), "Arial", _
25, Chart.TextColor, Chart.Center).setMargin(0)
' Output the chart
viewer.Chart = m
End Sub
End Classusing System;
using ChartDirector;
namespace CSharpWPFCharts
{
public class circularbarmeter2 : DemoModule
{
//Name of demo module
public string getName() { return "Circular Bar Meters (2)"; }
//Number of charts produced in this demo module
public int getNoOfCharts() { return 8; }
//Main code for creating charts
public void createChart(WPFChartViewer viewer, int chartIndex)
{
// The value to display on the meter
double value = 85;
// The meter radius and angle
int radius = 50;
double angle = value * 360.0 / 100;
// Create an AngularMeter with transparent background
AngularMeter m = new AngularMeter(radius * 2 + 10, radius * 2 + 10, Chart.Transparent);
// Set the center, radius and angular range of the meter
m.setMeter(m.getWidth() / 2, m.getHeight() / 2, radius, 0, 360);
// For circular bar meters, we do not need pointer or graduation, so we hide them.
m.setMeterColors(Chart.Transparent, Chart.Transparent, Chart.Transparent);
m.setCap(0, Chart.Transparent);
// In this example, the circular bar has 20 segments
int segmentCount = 20;
// The angular step
double angleStep = 360.0 / segmentCount;
// The gap between segments is 4.5 degrees
double angleGap = 4.5;
//
// This example demonstrates several coloring styles
//
// Thd default fill and blank colors
int fillColor = 0x336699;
int blankColor = 0xeeeeee;
if (chartIndex >= 4) {
// Use dark background style
m.setColors(Chart.whiteOnBlackPalette);
fillColor = 0x6699ff;
blankColor = 0x222222;
}
if (chartIndex % 4 == 1) {
// Alternative fill color
fillColor = 0x00ee33;
} else if (chartIndex % 4 == 2) {
// Use a smooth color scale as the fill color
int[] smoothColorScale = {0, 0x0022ff, 15, 0x0088ff, 30, 0x00ff00, 55, 0xffff00, 80,
0xff0000, 100, 0xff0000};
fillColor = m.getDrawArea().angleGradientColor(m.getWidth() / 2, m.getHeight() / 2,
0, 360, radius, radius - 20, smoothColorScale);
} else if (chartIndex % 4 == 3) {
// Use a step color scale as the fill color
int[] stepColorScale = {0, 0x0044ff, 20, 0x00ee00, 50, 0xeeee00, 70, 0xee0000, 100};
fillColor = m.getDrawArea().angleGradientColor(m.getWidth() / 2, m.getHeight() / 2,
-angleGap / 2, 360 - angleGap / 2, radius, radius - 20, stepColorScale);
}
//
// Now we draw the segments of the bar meter
//
// The segment that contains the value
int currentSegment = (int)(angle / angleStep);
// Segments after the current segment is colored with the blank color
for(int i = currentSegment + 1; i < segmentCount; ++i) {
m.addRingSector(radius, radius - 20, i * angleStep, (i + 1) * angleStep - angleGap,
blankColor);
}
// Segments before the current segment is colored with the fill color
for(int i = 0; i < currentSegment; ++i) {
m.addRingSector(radius, radius - 20, i * angleStep, (i + 1) * angleStep - angleGap,
fillColor);
}
// Segment that contains the angle will be partially filled and partially blank. We need
// to adjust the angle to compensated for the angle gap.
double adjustedAngle = currentSegment * angleStep + (angle - currentSegment * angleStep)
* (1 - angleGap / angleStep);
// The blank part of the segment
if ((currentSegment + 1) * angleStep > angle) {
m.addRingSector(radius, radius - 20, adjustedAngle, (currentSegment + 1) * angleStep
- angleGap, blankColor);
}
// The filled part of the segment.
if (angle > currentSegment * angleStep) {
m.addRingSector(radius, radius - 20, currentSegment * angleStep, adjustedAngle,
fillColor);
}
// Add a label at the center to display the value
m.addText(m.getWidth() / 2, m.getHeight() / 2, m.formatValue(value, "{value}"), "Arial",
25, Chart.TextColor, Chart.Center).setMargin(0);
// Output the chart
viewer.Chart = m;
}
}
}<%@ Page Language="C#" Debug="true" %>
<%@ Import Namespace="ChartDirector" %>
<%@ Register TagPrefix="chart" Namespace="ChartDirector" Assembly="netchartdir" %>
<!DOCTYPE html>
<script runat="server">
//
// Create chart
//
protected void createChart(WebChartViewer viewer, int chartIndex)
{
// The value to display on the meter
double value = 85;
// The meter radius and angle
int radius = 50;
double angle = value * 360.0 / 100;
// Create an AngularMeter with transparent background
AngularMeter m = new AngularMeter(radius * 2 + 10, radius * 2 + 10, Chart.Transparent);
// Set the center, radius and angular range of the meter
m.setMeter(m.getWidth() / 2, m.getHeight() / 2, radius, 0, 360);
// For circular bar meters, we do not need pointer or graduation, so we hide them.
m.setMeterColors(Chart.Transparent, Chart.Transparent, Chart.Transparent);
m.setCap(0, Chart.Transparent);
// In this example, the circular bar has 20 segments
int segmentCount = 20;
// The angular step
double angleStep = 360.0 / segmentCount;
// The gap between segments is 4.5 degrees
double angleGap = 4.5;
//
// This example demonstrates several coloring styles
//
// Thd default fill and blank colors
int fillColor = 0x336699;
int blankColor = 0xeeeeee;
if (chartIndex >= 4) {
// Use dark background style
m.setColors(Chart.whiteOnBlackPalette);
fillColor = 0x6699ff;
blankColor = 0x222222;
}
if (chartIndex % 4 == 1) {
// Alternative fill color
fillColor = 0x00ee33;
} else if (chartIndex % 4 == 2) {
// Use a smooth color scale as the fill color
int[] smoothColorScale = {0, 0x0022ff, 15, 0x0088ff, 30, 0x00ff00, 55, 0xffff00, 80,
0xff0000, 100, 0xff0000};
fillColor = m.getDrawArea().angleGradientColor(m.getWidth() / 2, m.getHeight() / 2, 0, 360,
radius, radius - 20, smoothColorScale);
} else if (chartIndex % 4 == 3) {
// Use a step color scale as the fill color
int[] stepColorScale = {0, 0x0044ff, 20, 0x00ee00, 50, 0xeeee00, 70, 0xee0000, 100};
fillColor = m.getDrawArea().angleGradientColor(m.getWidth() / 2, m.getHeight() / 2,
-angleGap / 2, 360 - angleGap / 2, radius, radius - 20, stepColorScale);
}
//
// Now we draw the segments of the bar meter
//
// The segment that contains the value
int currentSegment = (int)(angle / angleStep);
// Segments after the current segment is colored with the blank color
for(int i = currentSegment + 1; i < segmentCount; ++i) {
m.addRingSector(radius, radius - 20, i * angleStep, (i + 1) * angleStep - angleGap,
blankColor);
}
// Segments before the current segment is colored with the fill color
for(int i = 0; i < currentSegment; ++i) {
m.addRingSector(radius, radius - 20, i * angleStep, (i + 1) * angleStep - angleGap,
fillColor);
}
// Segment that contains the angle will be partially filled and partially blank. We need to
// adjust the angle to compensated for the angle gap.
double adjustedAngle = currentSegment * angleStep + (angle - currentSegment * angleStep) * (1 -
angleGap / angleStep);
// The blank part of the segment
if ((currentSegment + 1) * angleStep > angle) {
m.addRingSector(radius, radius - 20, adjustedAngle, (currentSegment + 1) * angleStep -
angleGap, blankColor);
}
// The filled part of the segment.
if (angle > currentSegment * angleStep) {
m.addRingSector(radius, radius - 20, currentSegment * angleStep, adjustedAngle, fillColor);
}
// Add a label at the center to display the value
m.addText(m.getWidth() / 2, m.getHeight() / 2, m.formatValue(value, "{value}"), "Arial", 25,
Chart.TextColor, Chart.Center).setMargin(0);
// Output the chart
viewer.Image = m.makeWebImage(Chart.SVG);
}
//
// Page Load event handler
//
protected void Page_Load(object sender, EventArgs e)
{
createChart(WebChartViewer0, 0);
createChart(WebChartViewer1, 1);
createChart(WebChartViewer2, 2);
createChart(WebChartViewer3, 3);
createChart(WebChartViewer4, 4);
createChart(WebChartViewer5, 5);
createChart(WebChartViewer6, 6);
createChart(WebChartViewer7, 7);
}
</script>
<html>
<head>
<script type="text/javascript" src="cdjcv.js"></script>
</head>
<body>
<chart:WebChartViewer id="WebChartViewer0" runat="server" />
<chart:WebChartViewer id="WebChartViewer1" runat="server" />
<chart:WebChartViewer id="WebChartViewer2" runat="server" />
<chart:WebChartViewer id="WebChartViewer3" runat="server" />
<chart:WebChartViewer id="WebChartViewer4" runat="server" />
<chart:WebChartViewer id="WebChartViewer5" runat="server" />
<chart:WebChartViewer id="WebChartViewer6" runat="server" />
<chart:WebChartViewer id="WebChartViewer7" runat="server" />
</body>
</html><%@ Page Language="VB" Debug="true" %>
<%@ Import Namespace="ChartDirector" %>
<%@ Register TagPrefix="chart" Namespace="ChartDirector" Assembly="netchartdir" %>
<!DOCTYPE html>
<script runat="server">
'
' Create chart
'
Protected Sub createChart(viewer As WebChartViewer, chartIndex As Integer)
' The value to display on the meter
Dim value As Double = 85
' The meter radius and angle
Dim radius As Integer = 50
Dim angle As Double = value * 360.0 / 100
' Create an AngularMeter with transparent background
Dim m As AngularMeter = New AngularMeter(radius * 2 + 10, radius * 2 + 10, Chart.Transparent)
' Set the center, radius and angular range of the meter
m.setMeter(m.getWidth() \ 2, m.getHeight() \ 2, radius, 0, 360)
' For circular bar meters, we do not need pointer or graduation, so we hide them.
m.setMeterColors(Chart.Transparent, Chart.Transparent, Chart.Transparent)
m.setCap(0, Chart.Transparent)
' In this example, the circular bar has 20 segments
Dim segmentCount As Integer = 20
' The angular step
Dim angleStep As Double = 360.0 / segmentCount
' The gap between segments is 4.5 degrees
Dim angleGap As Double = 4.5
'
' This example demonstrates several coloring styles
'
' Thd default fill and blank colors
Dim fillColor As Integer = &H336699
Dim blankColor As Integer = &Heeeeee
If chartIndex >= 4 Then
' Use dark background style
m.setColors(Chart.whiteOnBlackPalette)
fillColor = &H6699ff
blankColor = &H222222
End If
If chartIndex Mod 4 = 1 Then
' Alternative fill color
fillColor = &H00ee33
ElseIf chartIndex Mod 4 = 2 Then
' Use a smooth color scale as the fill color
Dim smoothColorScale() As Integer = {0, &H0022ff, 15, &H0088ff, 30, &H00ff00, 55, _
&Hffff00, 80, &Hff0000, 100, &Hff0000}
fillColor = m.getDrawArea().angleGradientColor(m.getWidth() \ 2, m.getHeight() \ 2, 0, _
360, radius, radius - 20, smoothColorScale)
ElseIf chartIndex Mod 4 = 3 Then
' Use a step color scale as the fill color
Dim stepColorScale() As Integer = {0, &H0044ff, 20, &H00ee00, 50, &Heeee00, 70, &Hee0000, _
100}
fillColor = m.getDrawArea().angleGradientColor(m.getWidth() \ 2, m.getHeight() \ 2, _
-angleGap / 2, 360 - angleGap / 2, radius, radius - 20, stepColorScale)
End If
'
' Now we draw the segments of the bar meter
'
' The segment that contains the value
Dim currentSegment As Integer = Int(angle / angleStep)
' Segments after the current segment is colored with the blank color
For i As Integer = currentSegment + 1 To segmentCount - 1
m.addRingSector(radius, radius - 20, i * angleStep, (i + 1) * angleStep - angleGap, _
blankColor)
Next
' Segments before the current segment is colored with the fill color
For i As Integer = 0 To currentSegment - 1
m.addRingSector(radius, radius - 20, i * angleStep, (i + 1) * angleStep - angleGap, _
fillColor)
Next
' Segment that contains the angle will be partially filled and partially blank. We need to
' adjust the angle to compensated for the angle gap.
Dim adjustedAngle As Double = currentSegment * angleStep + (angle - currentSegment * angleStep _
) * (1 - angleGap / angleStep)
' The blank part of the segment
If (currentSegment + 1) * angleStep > angle Then
m.addRingSector(radius, radius - 20, adjustedAngle, (currentSegment + 1) * angleStep - _
angleGap, blankColor)
End If
' The filled part of the segment.
If angle > currentSegment * angleStep Then
m.addRingSector(radius, radius - 20, currentSegment * angleStep, adjustedAngle, fillColor)
End If
' Add a label at the center to display the value
m.addText(m.getWidth() \ 2, m.getHeight() \ 2, m.formatValue(value, "{value}"), "Arial", 25, _
Chart.TextColor, Chart.Center).setMargin(0)
' Output the chart
viewer.Image = m.makeWebImage(Chart.SVG)
End Sub
'
' Page Load event handler
'
Protected Sub Page_Load(ByVal sender As System.Object, ByVal e As System.EventArgs)
createChart(WebChartViewer0, 0)
createChart(WebChartViewer1, 1)
createChart(WebChartViewer2, 2)
createChart(WebChartViewer3, 3)
createChart(WebChartViewer4, 4)
createChart(WebChartViewer5, 5)
createChart(WebChartViewer6, 6)
createChart(WebChartViewer7, 7)
End Sub
</script>
<html>
<head>
<script type="text/javascript" src="cdjcv.js"></script>
</head>
<body>
<chart:WebChartViewer id="WebChartViewer0" runat="server" />
<chart:WebChartViewer id="WebChartViewer1" runat="server" />
<chart:WebChartViewer id="WebChartViewer2" runat="server" />
<chart:WebChartViewer id="WebChartViewer3" runat="server" />
<chart:WebChartViewer id="WebChartViewer4" runat="server" />
<chart:WebChartViewer id="WebChartViewer5" runat="server" />
<chart:WebChartViewer id="WebChartViewer6" runat="server" />
<chart:WebChartViewer id="WebChartViewer7" runat="server" />
</body>
</html>using System;
using System.Web.Mvc;
using ChartDirector;
namespace NetMvcCharts.Controllers
{
public class Circularbarmeter2Controller : Controller
{
//
// Default Action
//
public ActionResult Index()
{
ViewBag.Title = "Circular Bar Meters (2)";
// This example contains 8 charts.
ViewBag.Viewer = new RazorChartViewer[8];
for (int i = 0; i < ViewBag.Viewer.Length; ++i)
createChart(ViewBag.Viewer[i] = new RazorChartViewer(HttpContext, "chart" + i), i);
return View("~/Views/Shared/ChartView.cshtml");
}
//
// Create chart
//
private void createChart(RazorChartViewer viewer, int chartIndex)
{
// The value to display on the meter
double value = 85;
// The meter radius and angle
int radius = 50;
double angle = value * 360.0 / 100;
// Create an AngularMeter with transparent background
AngularMeter m = new AngularMeter(radius * 2 + 10, radius * 2 + 10, Chart.Transparent);
// Set the center, radius and angular range of the meter
m.setMeter(m.getWidth() / 2, m.getHeight() / 2, radius, 0, 360);
// For circular bar meters, we do not need pointer or graduation, so we hide them.
m.setMeterColors(Chart.Transparent, Chart.Transparent, Chart.Transparent);
m.setCap(0, Chart.Transparent);
// In this example, the circular bar has 20 segments
int segmentCount = 20;
// The angular step
double angleStep = 360.0 / segmentCount;
// The gap between segments is 4.5 degrees
double angleGap = 4.5;
//
// This example demonstrates several coloring styles
//
// Thd default fill and blank colors
int fillColor = 0x336699;
int blankColor = 0xeeeeee;
if (chartIndex >= 4) {
// Use dark background style
m.setColors(Chart.whiteOnBlackPalette);
fillColor = 0x6699ff;
blankColor = 0x222222;
}
if (chartIndex % 4 == 1) {
// Alternative fill color
fillColor = 0x00ee33;
} else if (chartIndex % 4 == 2) {
// Use a smooth color scale as the fill color
int[] smoothColorScale = {0, 0x0022ff, 15, 0x0088ff, 30, 0x00ff00, 55, 0xffff00, 80,
0xff0000, 100, 0xff0000};
fillColor = m.getDrawArea().angleGradientColor(m.getWidth() / 2, m.getHeight() / 2, 0,
360, radius, radius - 20, smoothColorScale);
} else if (chartIndex % 4 == 3) {
// Use a step color scale as the fill color
int[] stepColorScale = {0, 0x0044ff, 20, 0x00ee00, 50, 0xeeee00, 70, 0xee0000, 100};
fillColor = m.getDrawArea().angleGradientColor(m.getWidth() / 2, m.getHeight() / 2,
-angleGap / 2, 360 - angleGap / 2, radius, radius - 20, stepColorScale);
}
//
// Now we draw the segments of the bar meter
//
// The segment that contains the value
int currentSegment = (int)(angle / angleStep);
// Segments after the current segment is colored with the blank color
for(int i = currentSegment + 1; i < segmentCount; ++i) {
m.addRingSector(radius, radius - 20, i * angleStep, (i + 1) * angleStep - angleGap,
blankColor);
}
// Segments before the current segment is colored with the fill color
for(int i = 0; i < currentSegment; ++i) {
m.addRingSector(radius, radius - 20, i * angleStep, (i + 1) * angleStep - angleGap,
fillColor);
}
// Segment that contains the angle will be partially filled and partially blank. We need to
// adjust the angle to compensated for the angle gap.
double adjustedAngle = currentSegment * angleStep + (angle - currentSegment * angleStep) * (1
- angleGap / angleStep);
// The blank part of the segment
if ((currentSegment + 1) * angleStep > angle) {
m.addRingSector(radius, radius - 20, adjustedAngle, (currentSegment + 1) * angleStep -
angleGap, blankColor);
}
// The filled part of the segment.
if (angle > currentSegment * angleStep) {
m.addRingSector(radius, radius - 20, currentSegment * angleStep, adjustedAngle, fillColor
);
}
// Add a label at the center to display the value
m.addText(m.getWidth() / 2, m.getHeight() / 2, m.formatValue(value, "{value}"), "Arial", 25,
Chart.TextColor, Chart.Center).setMargin(0);
// Output the chart
viewer.Image = m.makeWebImage(Chart.SVG);
}
}
}@{ Layout = null; }
<!DOCTYPE html>
<html>
<head>
<meta name="viewport" content="width=device-width" />
<title>@ViewBag.Title</title>
<style>
@ViewBag.Style
</style>
@Scripts.Render("~/Scripts/cdjcv.js")
</head>
<body style="margin:5px 0px 0px 5px">
<div style="font:bold 18pt verdana;">
@ViewBag.Title
</div>
<hr style="border:solid 1px #000080; background:#000080" />
<div>
@{
if (ViewBag.Viewer is Array)
{
// Display multiple charts
for (int i = 0; i < ViewBag.Viewer.Length; ++i)
{
@:@Html.Raw(ViewBag.Viewer[i].RenderHTML())
}
}
else
{
// Display one chart only
@:@Html.Raw(ViewBag.Viewer.RenderHTML())
}
}
</div>
</body>
</html>