[Windows Forms - C# version] NetWinCharts\CSharpWinCharts\colorvlinearmeter.cs
using System;
using ChartDirector;
namespace CSharpChartExplorer
{
public class colorvlinearmeter : DemoModule
{
//Name of demo module
public string getName() { return "Color Vertical Linear Meters"; }
//Number of charts produced in this demo module
public int getNoOfCharts() { return 6; }
//Main code for creating charts
public void createChart(WinChartViewer viewer, int chartIndex)
{
// The value to display on the meter
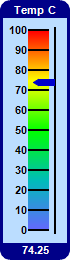
double value = 74.25;
// The background and border colors of the meters
int[] bgColor = {0xbbddff, 0xccffcc, 0xffccff, 0xffffaa, 0xffdddd, 0xeeeeee};
int[] borderColor = {0x000088, 0x006600, 0x6600aa, 0xee6600, 0x880000, 0x666666};
// Create a LinearMeter object of size 70 x 260 pixels with a 3-pixel thick rounded
// frame
LinearMeter m = new LinearMeter(70, 260, bgColor[chartIndex], borderColor[chartIndex]);
m.setRoundedFrame(Chart.Transparent);
m.setThickFrame(3);
// Set the scale region top-left corner at (28, 30), with size of 20 x 200 pixels. The
// scale labels are located on the left (default - implies vertical meter)
m.setMeter(28, 30, 20, 200);
// Set meter scale from 0 - 100, with a tick every 10 units
m.setScale(0, 100, 10);
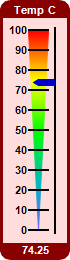
// Demostrate different types of color scales and putting them at different positions
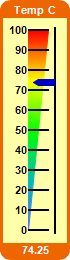
double[] smoothColorScale = {0, 0x6666ff, 25, 0x00bbbb, 50, 0x00ff00, 75, 0xffff00, 100,
0xff0000};
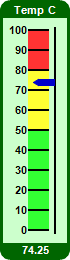
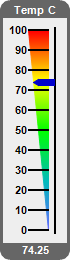
double[] stepColorScale = {0, 0x33ff33, 50, 0xffff33, 80, 0xff3333, 100};
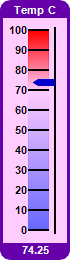
double[] highLowColorScale = {0, 0x6666ff, 70, Chart.Transparent, 100, 0xff0000};
if (chartIndex == 0) {
// Add the smooth color scale at the default position
m.addColorScale(smoothColorScale);
} else if (chartIndex == 1) {
// Add the step color scale at the default position
m.addColorScale(stepColorScale);
} else if (chartIndex == 2) {
// Add the high low scale at the default position
m.addColorScale(highLowColorScale);
} else if (chartIndex == 3) {
// Add the smooth color scale starting at x = 28 (left of scale) with zero width and
// ending at x = 28 with 20 pixels width
m.addColorScale(smoothColorScale, 28, 0, 28, 20);
} else if (chartIndex == 4) {
// Add the smooth color scale starting at x = 38 (center of scale) with zero width
// and ending at x = 28 with 20 pixels width
m.addColorScale(smoothColorScale, 38, 0, 28, 20);
} else {
// Add the smooth color scale starting at x = 48 (right of scale) with zero width
// and ending at x = 28 with 20 pixels width
m.addColorScale(smoothColorScale, 48, 0, 28, 20);
}
// Add a blue (0x0000cc) pointer at the specified value
m.addPointer(value, 0x0000cc);
// Add a title using white (0xffffff) 8pt Arial Bold font with a border color background
m.addTitle("Temp C", "Arial Bold", 8, 0xffffff).setBackground(borderColor[chartIndex]);
// Add a bottom title using white (0xffffff) 8pt Arial Bold font with a border color
// background to display the value
m.addTitle2(Chart.Bottom, m.formatValue(value, "2"), "Arial Bold", 8, 0xffffff
).setBackground(borderColor[chartIndex]);
// Output the chart
viewer.Chart = m;
}
}
}
[Windows Forms - VB Version] NetWinCharts\VBNetWinCharts\colorvlinearmeter.vb
Imports System
Imports Microsoft.VisualBasic
Imports ChartDirector

Public Class colorvlinearmeter
    Implements DemoModule

    'Name of demo module
    Public Function getName() As String Implements DemoModule.getName
        Return "Color Vertical Linear Meters"
    End Function

    'Number of charts produced in this demo module
    Public Function getNoOfCharts() As Integer Implements DemoModule.getNoOfCharts
        Return 6
    End Function

    'Main code for creating charts
    Public Sub createChart(viewer As WinChartViewer, chartIndex As Integer) _
        Implements DemoModule.createChart

        ' The value to display on the meter
        Dim value As Double = 74.25

        ' The background and border colors of the meters
        Dim bgColor() As Integer = {&Hbbddff, &Hccffcc, &Hffccff, &Hffffaa, &Hffdddd, &Heeeeee}
        Dim borderColor() As Integer = {&H000088, &H006600, &H6600aa, &Hee6600, &H880000, &H666666}

        ' Create a LinearMeter object of size 70 x 260 pixels with a 3-pixel thick rounded frame
        Dim m As LinearMeter = New LinearMeter(70, 260, bgColor(chartIndex), borderColor( _
            chartIndex))
        m.setRoundedFrame(Chart.Transparent)
        m.setThickFrame(3)

        ' Set the scale region top-left corner at (28, 30), with size of 20 x 200 pixels. The scale
        ' labels are located on the left (default - implies vertical meter)
        m.setMeter(28, 30, 20, 200)

        ' Set meter scale from 0 - 100, with a tick every 10 units
        m.setScale(0, 100, 10)

        ' Demostrate different types of color scales and putting them at different positions
        Dim smoothColorScale() As Double = {0, &H6666ff, 25, &H00bbbb, 50, &H00ff00, 75, &Hffff00, _
            100, &Hff0000}
        Dim stepColorScale() As Double = {0, &H33ff33, 50, &Hffff33, 80, &Hff3333, 100}
        Dim highLowColorScale() As Double = {0, &H6666ff, 70, Chart.Transparent, 100, &Hff0000}

        If chartIndex = 0 Then
            ' Add the smooth color scale at the default position
            m.addColorScale(smoothColorScale)
        ElseIf chartIndex = 1 Then
            ' Add the step color scale at the default position
            m.addColorScale(stepColorScale)
        ElseIf chartIndex = 2 Then
            ' Add the high low scale at the default position
            m.addColorScale(highLowColorScale)
        ElseIf chartIndex = 3 Then
            ' Add the smooth color scale starting at x = 28 (left of scale) with zero width and
            ' ending at x = 28 with 20 pixels width
            m.addColorScale(smoothColorScale, 28, 0, 28, 20)
        ElseIf chartIndex = 4 Then
            ' Add the smooth color scale starting at x = 38 (center of scale) with zero width and
            ' ending at x = 28 with 20 pixels width
            m.addColorScale(smoothColorScale, 38, 0, 28, 20)
        Else
            ' Add the smooth color scale starting at x = 48 (right of scale) with zero width and
            ' ending at x = 28 with 20 pixels width
            m.addColorScale(smoothColorScale, 48, 0, 28, 20)
        End If

        ' Add a blue (0x0000cc) pointer at the specified value
        m.addPointer(value, &H0000cc)

        ' Add a title using white (0xffffff) 8pt Arial Bold font with a border color background
        m.addTitle("Temp C", "Arial Bold", 8, &Hffffff).setBackground(borderColor(chartIndex))

        ' Add a bottom title using white (0xffffff) 8pt Arial Bold font with a border color
        ' background to display the value
        m.addTitle2(Chart.Bottom, m.formatValue(value, "2"), "Arial Bold", 8, &Hffffff _
            ).setBackground(borderColor(chartIndex))

        ' Output the chart
        viewer.Chart = m

    End Sub

End Class
[WPF - C#] NetWPFCharts\CSharpWPFCharts\colorvlinearmeter.cs
using System;
using ChartDirector;

namespace CSharpWPFCharts
{
    public class colorvlinearmeter : DemoModule
    {
        //Name of demo module
        public string getName() { return "Color Vertical Linear Meters"; }

        //Number of charts produced in this demo module
        public int getNoOfCharts() { return 6; }

        //Main code for creating charts
        public void createChart(WPFChartViewer viewer, int chartIndex)
        {
            // The value to display on the meter
            double value = 74.25;

            // The background and border colors of the meters
            int[] bgColor = {0xbbddff, 0xccffcc, 0xffccff, 0xffffaa, 0xffdddd, 0xeeeeee};
            int[] borderColor = {0x000088, 0x006600, 0x6600aa, 0xee6600, 0x880000, 0x666666};

            // Create a LinearMeter object of size 70 x 260 pixels with a 3-pixel thick rounded
            // frame
            LinearMeter m = new LinearMeter(70, 260, bgColor[chartIndex], borderColor[chartIndex]);
            m.setRoundedFrame(Chart.Transparent);
            m.setThickFrame(3);

            // Set the scale region top-left corner at (28, 30), with size of 20 x 200 pixels. The
            // scale labels are located on the left (default - implies vertical meter)
            m.setMeter(28, 30, 20, 200);

            // Set meter scale from 0 - 100, with a tick every 10 units
            m.setScale(0, 100, 10);

            // Demostrate different types of color scales and putting them at different positions
            double[] smoothColorScale = {0, 0x6666ff, 25, 0x00bbbb, 50, 0x00ff00, 75, 0xffff00, 100,
                0xff0000};
            double[] stepColorScale = {0, 0x33ff33, 50, 0xffff33, 80, 0xff3333, 100};
            double[] highLowColorScale = {0, 0x6666ff, 70, Chart.Transparent, 100, 0xff0000};

            if (chartIndex == 0) {
                // Add the smooth color scale at the default position
                m.addColorScale(smoothColorScale);
            } else if (chartIndex == 1) {
                // Add the step color scale at the default position
                m.addColorScale(stepColorScale);
            } else if (chartIndex == 2) {
                // Add the high low scale at the default position
                m.addColorScale(highLowColorScale);
            } else if (chartIndex == 3) {
                // Add the smooth color scale starting at x = 28 (left of scale) with zero width and
                // ending at x = 28 with 20 pixels width
                m.addColorScale(smoothColorScale, 28, 0, 28, 20);
            } else if (chartIndex == 4) {
                // Add the smooth color scale starting at x = 38 (center of scale) with zero width
                // and ending at x = 28 with 20 pixels width
                m.addColorScale(smoothColorScale, 38, 0, 28, 20);
            } else {
                // Add the smooth color scale starting at x = 48 (right of scale) with zero width
                // and ending at x = 28 with 20 pixels width
                m.addColorScale(smoothColorScale, 48, 0, 28, 20);
            }

            // Add a blue (0x0000cc) pointer at the specified value
            m.addPointer(value, 0x0000cc);

            // Add a title using white (0xffffff) 8pt Arial Bold font with a border color background
            m.addTitle("Temp C", "Arial Bold", 8, 0xffffff).setBackground(borderColor[chartIndex]);

            // Add a bottom title using white (0xffffff) 8pt Arial Bold font with a border color
            // background to display the value
            m.addTitle2(Chart.Bottom, m.formatValue(value, "2"), "Arial Bold", 8, 0xffffff
                ).setBackground(borderColor[chartIndex]);

            // Output the chart
            viewer.Chart = m;
        }
    }
}
[ASP.NET Web Forms - C# version] NetWebCharts\CSharpASP\colorvlinearmeter.aspx
(Click here on how to convert this code to code-behind style.)<%@ Page Language="C#" Debug="true" %>
<%@ Import Namespace="ChartDirector" %>
<%@ Register TagPrefix="chart" Namespace="ChartDirector" Assembly="netchartdir" %>
<!DOCTYPE html>
<script runat="server">
//
// Create chart
//
protected void createChart(WebChartViewer viewer, int chartIndex)
{
// The value to display on the meter
double value = 74.25;
// The background and border colors of the meters
int[] bgColor = {0xbbddff, 0xccffcc, 0xffccff, 0xffffaa, 0xffdddd, 0xeeeeee};
int[] borderColor = {0x000088, 0x006600, 0x6600aa, 0xee6600, 0x880000, 0x666666};
// Create a LinearMeter object of size 70 x 260 pixels with a 3-pixel thick rounded frame
LinearMeter m = new LinearMeter(70, 260, bgColor[chartIndex], borderColor[chartIndex]);
m.setRoundedFrame(Chart.Transparent);
m.setThickFrame(3);
// Set the scale region top-left corner at (28, 30), with size of 20 x 200 pixels. The scale
// labels are located on the left (default - implies vertical meter)
m.setMeter(28, 30, 20, 200);
// Set meter scale from 0 - 100, with a tick every 10 units
m.setScale(0, 100, 10);
// Demostrate different types of color scales and putting them at different positions
double[] smoothColorScale = {0, 0x6666ff, 25, 0x00bbbb, 50, 0x00ff00, 75, 0xffff00, 100,
0xff0000};
double[] stepColorScale = {0, 0x33ff33, 50, 0xffff33, 80, 0xff3333, 100};
double[] highLowColorScale = {0, 0x6666ff, 70, Chart.Transparent, 100, 0xff0000};
if (chartIndex == 0) {
// Add the smooth color scale at the default position
m.addColorScale(smoothColorScale);
} else if (chartIndex == 1) {
// Add the step color scale at the default position
m.addColorScale(stepColorScale);
} else if (chartIndex == 2) {
// Add the high low scale at the default position
m.addColorScale(highLowColorScale);
} else if (chartIndex == 3) {
// Add the smooth color scale starting at x = 28 (left of scale) with zero width and ending
// at x = 28 with 20 pixels width
m.addColorScale(smoothColorScale, 28, 0, 28, 20);
} else if (chartIndex == 4) {
// Add the smooth color scale starting at x = 38 (center of scale) with zero width and
// ending at x = 28 with 20 pixels width
m.addColorScale(smoothColorScale, 38, 0, 28, 20);
} else {
// Add the smooth color scale starting at x = 48 (right of scale) with zero width and ending
// at x = 28 with 20 pixels width
m.addColorScale(smoothColorScale, 48, 0, 28, 20);
}
// Add a blue (0x0000cc) pointer at the specified value
m.addPointer(value, 0x0000cc);
// Add a title using white (0xffffff) 8pt Arial Bold font with a border color background
m.addTitle("Temp C", "Arial Bold", 8, 0xffffff).setBackground(borderColor[chartIndex]);
// Add a bottom title using white (0xffffff) 8pt Arial Bold font with a border color background
// to display the value
m.addTitle2(Chart.Bottom, m.formatValue(value, "2"), "Arial Bold", 8, 0xffffff).setBackground(
borderColor[chartIndex]);
// Output the chart
viewer.Image = m.makeWebImage(Chart.SVG);
}
//
// Page Load event handler
//
protected void Page_Load(object sender, EventArgs e)
{
createChart(WebChartViewer0, 0);
createChart(WebChartViewer1, 1);
createChart(WebChartViewer2, 2);
createChart(WebChartViewer3, 3);
createChart(WebChartViewer4, 4);
createChart(WebChartViewer5, 5);
}
</script>
<html>
<head>
<script type="text/javascript" src="cdjcv.js"></script>
</head>
<body>
<chart:WebChartViewer id="WebChartViewer0" runat="server" style='margin-right:25px;' />
<chart:WebChartViewer id="WebChartViewer1" runat="server" style='margin-right:25px;' />
<chart:WebChartViewer id="WebChartViewer2" runat="server" style='margin-right:25px;' />
<chart:WebChartViewer id="WebChartViewer3" runat="server" style='margin-right:25px;' />
<chart:WebChartViewer id="WebChartViewer4" runat="server" style='margin-right:25px;' />
<chart:WebChartViewer id="WebChartViewer5" runat="server" />
</body>
</html>
[ASP.NET Web Forms - VB Version] NetWebCharts\VBNetASP\colorvlinearmeter.aspx
(Click here on how to convert this code to code-behind style.)<%@ Page Language="VB" Debug="true" %>
<%@ Import Namespace="ChartDirector" %>
<%@ Register TagPrefix="chart" Namespace="ChartDirector" Assembly="netchartdir" %>
<!DOCTYPE html>
<script runat="server">
'
' Create chart
'
Protected Sub createChart(viewer As WebChartViewer, chartIndex As Integer)
' The value to display on the meter
Dim value As Double = 74.25
' The background and border colors of the meters
Dim bgColor() As Integer = {&Hbbddff, &Hccffcc, &Hffccff, &Hffffaa, &Hffdddd, &Heeeeee}
Dim borderColor() As Integer = {&H000088, &H006600, &H6600aa, &Hee6600, &H880000, &H666666}
' Create a LinearMeter object of size 70 x 260 pixels with a 3-pixel thick rounded frame
Dim m As LinearMeter = New LinearMeter(70, 260, bgColor(chartIndex), borderColor(chartIndex))
m.setRoundedFrame(Chart.Transparent)
m.setThickFrame(3)
' Set the scale region top-left corner at (28, 30), with size of 20 x 200 pixels. The scale
' labels are located on the left (default - implies vertical meter)
m.setMeter(28, 30, 20, 200)
' Set meter scale from 0 - 100, with a tick every 10 units
m.setScale(0, 100, 10)
' Demostrate different types of color scales and putting them at different positions
Dim smoothColorScale() As Double = {0, &H6666ff, 25, &H00bbbb, 50, &H00ff00, 75, &Hffff00, _
100, &Hff0000}
Dim stepColorScale() As Double = {0, &H33ff33, 50, &Hffff33, 80, &Hff3333, 100}
Dim highLowColorScale() As Double = {0, &H6666ff, 70, Chart.Transparent, 100, &Hff0000}
If chartIndex = 0 Then
' Add the smooth color scale at the default position
m.addColorScale(smoothColorScale)
ElseIf chartIndex = 1 Then
' Add the step color scale at the default position
m.addColorScale(stepColorScale)
ElseIf chartIndex = 2 Then
' Add the high low scale at the default position
m.addColorScale(highLowColorScale)
ElseIf chartIndex = 3 Then
' Add the smooth color scale starting at x = 28 (left of scale) with zero width and ending
' at x = 28 with 20 pixels width
m.addColorScale(smoothColorScale, 28, 0, 28, 20)
ElseIf chartIndex = 4 Then
' Add the smooth color scale starting at x = 38 (center of scale) with zero width and ending
' at x = 28 with 20 pixels width
m.addColorScale(smoothColorScale, 38, 0, 28, 20)
Else
' Add the smooth color scale starting at x = 48 (right of scale) with zero width and ending
' at x = 28 with 20 pixels width
m.addColorScale(smoothColorScale, 48, 0, 28, 20)
End If
' Add a blue (0x0000cc) pointer at the specified value
m.addPointer(value, &H0000cc)
' Add a title using white (0xffffff) 8pt Arial Bold font with a border color background
m.addTitle("Temp C", "Arial Bold", 8, &Hffffff).setBackground(borderColor(chartIndex))
' Add a bottom title using white (0xffffff) 8pt Arial Bold font with a border color background
' to display the value
m.addTitle2(Chart.Bottom, m.formatValue(value, "2"), "Arial Bold", 8, &Hffffff).setBackground( _
borderColor(chartIndex))
' Output the chart
viewer.Image = m.makeWebImage(Chart.SVG)
End Sub
'
' Page Load event handler
'
Protected Sub Page_Load(ByVal sender As System.Object, ByVal e As System.EventArgs)
createChart(WebChartViewer0, 0)
createChart(WebChartViewer1, 1)
createChart(WebChartViewer2, 2)
createChart(WebChartViewer3, 3)
createChart(WebChartViewer4, 4)
createChart(WebChartViewer5, 5)
End Sub
</script>
<html>
<head>
<script type="text/javascript" src="cdjcv.js"></script>
</head>
<body>
<chart:WebChartViewer id="WebChartViewer0" runat="server" style='margin-right:25px;' />
<chart:WebChartViewer id="WebChartViewer1" runat="server" style='margin-right:25px;' />
<chart:WebChartViewer id="WebChartViewer2" runat="server" style='margin-right:25px;' />
<chart:WebChartViewer id="WebChartViewer3" runat="server" style='margin-right:25px;' />
<chart:WebChartViewer id="WebChartViewer4" runat="server" style='margin-right:25px;' />
<chart:WebChartViewer id="WebChartViewer5" runat="server" />
</body>
</html>
[ASP.NET MVC - Controller] NetMvcCharts\Controllers\ColorvlinearmeterController.cs
using System;
using System.Web.Mvc;
using ChartDirector;

namespace NetMvcCharts.Controllers
{
    public class ColorvlinearmeterController : Controller
    {
        //
        // Default Action
        //
        public ActionResult Index()
        {
            ViewBag.Title = "Color Vertical Linear Meters";

            // This example contains 6 charts.
            ViewBag.Viewer = new RazorChartViewer[6];
            for (int i = 0; i < ViewBag.Viewer.Length; ++i)
                createChart(ViewBag.Viewer[i] = new RazorChartViewer(HttpContext, "chart" + i), i);

            return View("~/Views/Shared/ChartView.cshtml");
        }

        //
        // Create chart
        //
        private void createChart(RazorChartViewer viewer, int chartIndex)
        {
            // The value to display on the meter
            double value = 74.25;

            // The background and border colors of the meters
            int[] bgColor = {0xbbddff, 0xccffcc, 0xffccff, 0xffffaa, 0xffdddd, 0xeeeeee};
            int[] borderColor = {0x000088, 0x006600, 0x6600aa, 0xee6600, 0x880000, 0x666666};

            // Create a LinearMeter object of size 70 x 260 pixels with a 3-pixel thick rounded frame
            LinearMeter m = new LinearMeter(70, 260, bgColor[chartIndex], borderColor[chartIndex]);
            m.setRoundedFrame(Chart.Transparent);
            m.setThickFrame(3);

            // Set the scale region top-left corner at (28, 30), with size of 20 x 200 pixels. The scale
            // labels are located on the left (default - implies vertical meter)
            m.setMeter(28, 30, 20, 200);

            // Set meter scale from 0 - 100, with a tick every 10 units
            m.setScale(0, 100, 10);

            // Demostrate different types of color scales and putting them at different positions
            double[] smoothColorScale = {0, 0x6666ff, 25, 0x00bbbb, 50, 0x00ff00, 75, 0xffff00, 100,
                0xff0000};
            double[] stepColorScale = {0, 0x33ff33, 50, 0xffff33, 80, 0xff3333, 100};
            double[] highLowColorScale = {0, 0x6666ff, 70, Chart.Transparent, 100, 0xff0000};

            if (chartIndex == 0) {
                // Add the smooth color scale at the default position
                m.addColorScale(smoothColorScale);
            } else if (chartIndex == 1) {
                // Add the step color scale at the default position
                m.addColorScale(stepColorScale);
            } else if (chartIndex == 2) {
                // Add the high low scale at the default position
                m.addColorScale(highLowColorScale);
            } else if (chartIndex == 3) {
                // Add the smooth color scale starting at x = 28 (left of scale) with zero width and
                // ending at x = 28 with 20 pixels width
                m.addColorScale(smoothColorScale, 28, 0, 28, 20);
            } else if (chartIndex == 4) {
                // Add the smooth color scale starting at x = 38 (center of scale) with zero width and
                // ending at x = 28 with 20 pixels width
                m.addColorScale(smoothColorScale, 38, 0, 28, 20);
            } else {
                // Add the smooth color scale starting at x = 48 (right of scale) with zero width and
                // ending at x = 28 with 20 pixels width
                m.addColorScale(smoothColorScale, 48, 0, 28, 20);
            }

            // Add a blue (0x0000cc) pointer at the specified value
            m.addPointer(value, 0x0000cc);

            // Add a title using white (0xffffff) 8pt Arial Bold font with a border color background
            m.addTitle("Temp C", "Arial Bold", 8, 0xffffff).setBackground(borderColor[chartIndex]);

            // Add a bottom title using white (0xffffff) 8pt Arial Bold font with a border color
            // background to display the value
            m.addTitle2(Chart.Bottom, m.formatValue(value, "2"), "Arial Bold", 8, 0xffffff
                ).setBackground(borderColor[chartIndex]);

            // Output the chart
            viewer.Image = m.makeWebImage(Chart.SVG);
        }
    }
}
[ASP.NET MVC - View] NetMvcCharts\Views\Shared\ChartView.cshtml
@{ Layout = null; }

<!DOCTYPE html>

<html>
<head>
    <meta name="viewport" content="width=device-width" />
    <title>@ViewBag.Title</title>
    <style>
        @ViewBag.Style
    </style>
    @Scripts.Render("~/Scripts/cdjcv.js")
</head>
<body style="margin:5px 0px 0px 5px">
    <div style="font:bold 18pt verdana;">
        @ViewBag.Title
    </div>
    <hr style="border:solid 1px #000080; background:#000080" />
    <div>
        @{
            if (ViewBag.Viewer is Array)
            {
                // Display multiple charts
                for (int i = 0; i < ViewBag.Viewer.Length; ++i)
                {
                    @:@Html.Raw(ViewBag.Viewer[i].RenderHTML())
                }
            }
            else
            {
                // Display one chart only
                @:@Html.Raw(ViewBag.Viewer.RenderHTML())
            }
        }
    </div>
</body>
</html>
© 2023 Advanced Software Engineering Limited. All rights reserved.