[Windows Forms - C# version] NetWinCharts\CSharpWinCharts\contourinterpolate.cs
using System;
using ChartDirector;
namespace CSharpChartExplorer
{
public class contourinterpolate : DemoModule
{
//Name of demo module
public string getName() { return "Contour Interpolation"; }
//Number of charts produced in this demo module
public int getNoOfCharts() { return 4; }
//Main code for creating charts
public void createChart(WinChartViewer viewer, int chartIndex)
{
// The x and y coordinates of the grid
double[] dataX = {-4, -3, -2, -1, 0, 1, 2, 3, 4};
double[] dataY = {-4, -3, -2, -1, 0, 1, 2, 3, 4};
// The values at the grid points. In this example, we will compute the values using the
// formula z = Sin(x * pi / 3) * Sin(y * pi / 3).
double[] dataZ = new double[dataX.Length * dataY.Length];
for(int yIndex = 0; yIndex < dataY.Length; ++yIndex) {
double y = dataY[yIndex];
for(int xIndex = 0; xIndex < dataX.Length; ++xIndex) {
double x = dataX[xIndex];
dataZ[yIndex * dataX.Length + xIndex] = Math.Sin(x * 3.1416 / 3) * Math.Sin(y *
3.1416 / 3);
}
}
// Create a XYChart object of size 360 x 360 pixels
XYChart c = new XYChart(360, 360);
// Set the plotarea at (30, 25) and of size 300 x 300 pixels. Use semi-transparent black
// (c0000000) for both horizontal and vertical grid lines
c.setPlotArea(30, 25, 300, 300, -1, -1, -1, unchecked((int)0xc0000000), -1);
// Add a contour layer using the given data
ContourLayer layer = c.addContourLayer(dataX, dataY, dataZ);
// Set the x-axis and y-axis scale
c.xAxis().setLinearScale(-4, 4, 1);
c.yAxis().setLinearScale(-4, 4, 1);
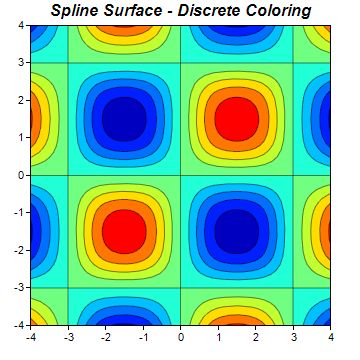
if (chartIndex == 0) {
// Discrete coloring, spline surface interpolation
c.addTitle("Spline Surface - Discrete Coloring", "Arial Bold Italic", 12);
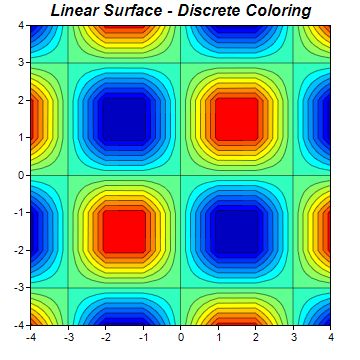
} else if (chartIndex == 1) {
// Discrete coloring, linear surface interpolation
c.addTitle("Linear Surface - Discrete Coloring", "Arial Bold Italic", 12);
layer.setSmoothInterpolation(false);
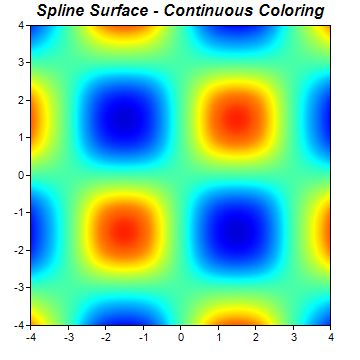
} else if (chartIndex == 2) {
// Smooth coloring, spline surface interpolation
c.addTitle("Spline Surface - Continuous Coloring", "Arial Bold Italic", 12);
layer.setContourColor(Chart.Transparent);
layer.colorAxis().setColorGradient(true);
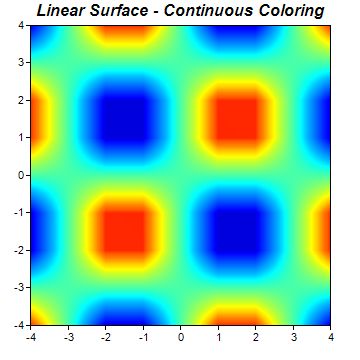
} else {
// Discrete coloring, linear surface interpolation
c.addTitle("Linear Surface - Continuous Coloring", "Arial Bold Italic", 12);
layer.setSmoothInterpolation(false);
layer.setContourColor(Chart.Transparent);
layer.colorAxis().setColorGradient(true);
}
// Output the chart
viewer.Chart = c;
}
}
}
[Windows Forms - VB Version] NetWinCharts\VBNetWinCharts\contourinterpolate.vb
Imports System
Imports Microsoft.VisualBasic
Imports ChartDirector

Public Class contourinterpolate
    Implements DemoModule

    'Name of demo module
    Public Function getName() As String Implements DemoModule.getName
        Return "Contour Interpolation"
    End Function

    'Number of charts produced in this demo module
    Public Function getNoOfCharts() As Integer Implements DemoModule.getNoOfCharts
        Return 4
    End Function

    'Main code for creating charts
    Public Sub createChart(viewer As WinChartViewer, chartIndex As Integer) _
        Implements DemoModule.createChart

        ' The x and y coordinates of the grid
        Dim dataX() As Double = {-4, -3, -2, -1, 0, 1, 2, 3, 4}
        Dim dataY() As Double = {-4, -3, -2, -1, 0, 1, 2, 3, 4}

        ' The values at the grid points. In this example, we will compute the values using the
        ' formula z = Sin(x * pi / 3) * Sin(y * pi / 3).
        Dim dataZ((UBound(dataX) + 1) * (UBound(dataY) + 1) - 1) As Double
        For yIndex As Integer = 0 To UBound(dataY)
            Dim y As Double = dataY(yIndex)
            For xIndex As Integer = 0 To UBound(dataX)
                Dim x As Double = dataX(xIndex)
                dataZ(yIndex * (UBound(dataX) + 1) + xIndex) = Math.Sin(x * 3.1416 / 3) * _
                    Math.Sin(y * 3.1416 / 3)
            Next
        Next

        ' Create a XYChart object of size 360 x 360 pixels
        Dim c As XYChart = New XYChart(360, 360)

        ' Set the plotarea at (30, 25) and of size 300 x 300 pixels. Use semi-transparent black
        ' (c0000000) for both horizontal and vertical grid lines
        c.setPlotArea(30, 25, 300, 300, -1, -1, -1, &Hc0000000, -1)

        ' Add a contour layer using the given data
        Dim layer As ContourLayer = c.addContourLayer(dataX, dataY, dataZ)

        ' Set the x-axis and y-axis scale
        c.xAxis().setLinearScale(-4, 4, 1)
        c.yAxis().setLinearScale(-4, 4, 1)

        If chartIndex = 0 Then
            ' Discrete coloring, spline surface interpolation
            c.addTitle("Spline Surface - Discrete Coloring", "Arial Bold Italic", 12)
        ElseIf chartIndex = 1 Then
            ' Discrete coloring, linear surface interpolation
            c.addTitle("Linear Surface - Discrete Coloring", "Arial Bold Italic", 12)
            layer.setSmoothInterpolation(False)
        ElseIf chartIndex = 2 Then
            ' Smooth coloring, spline surface interpolation
            c.addTitle("Spline Surface - Continuous Coloring", "Arial Bold Italic", 12)
            layer.setContourColor(Chart.Transparent)
            layer.colorAxis().setColorGradient(True)
        Else
            ' Discrete coloring, linear surface interpolation
            c.addTitle("Linear Surface - Continuous Coloring", "Arial Bold Italic", 12)
            layer.setSmoothInterpolation(False)
            layer.setContourColor(Chart.Transparent)
            layer.colorAxis().setColorGradient(True)
        End If

        ' Output the chart
        viewer.Chart = c

    End Sub

End Class
[WPF - C#] NetWPFCharts\CSharpWPFCharts\contourinterpolate.cs
using System;
using ChartDirector;

namespace CSharpWPFCharts
{
    public class contourinterpolate : DemoModule
    {
        //Name of demo module
        public string getName() { return "Contour Interpolation"; }

        //Number of charts produced in this demo module
        public int getNoOfCharts() { return 4; }

        //Main code for creating charts
        public void createChart(WPFChartViewer viewer, int chartIndex)
        {
            // The x and y coordinates of the grid
            double[] dataX = {-4, -3, -2, -1, 0, 1, 2, 3, 4};
            double[] dataY = {-4, -3, -2, -1, 0, 1, 2, 3, 4};

            // The values at the grid points. In this example, we will compute the values using the
            // formula z = Sin(x * pi / 3) * Sin(y * pi / 3).
            double[] dataZ = new double[dataX.Length * dataY.Length];
            for(int yIndex = 0; yIndex < dataY.Length; ++yIndex) {
                double y = dataY[yIndex];
                for(int xIndex = 0; xIndex < dataX.Length; ++xIndex) {
                    double x = dataX[xIndex];
                    dataZ[yIndex * dataX.Length + xIndex] = Math.Sin(x * 3.1416 / 3) * Math.Sin(y *
                        3.1416 / 3);
                }
            }

            // Create a XYChart object of size 360 x 360 pixels
            XYChart c = new XYChart(360, 360);

            // Set the plotarea at (30, 25) and of size 300 x 300 pixels. Use semi-transparent black
            // (c0000000) for both horizontal and vertical grid lines
            c.setPlotArea(30, 25, 300, 300, -1, -1, -1, unchecked((int)0xc0000000), -1);

            // Add a contour layer using the given data
            ContourLayer layer = c.addContourLayer(dataX, dataY, dataZ);

            // Set the x-axis and y-axis scale
            c.xAxis().setLinearScale(-4, 4, 1);
            c.yAxis().setLinearScale(-4, 4, 1);

            if (chartIndex == 0) {
                // Discrete coloring, spline surface interpolation
                c.addTitle("Spline Surface - Discrete Coloring", "Arial Bold Italic", 12);
            } else if (chartIndex == 1) {
                // Discrete coloring, linear surface interpolation
                c.addTitle("Linear Surface - Discrete Coloring", "Arial Bold Italic", 12);
                layer.setSmoothInterpolation(false);
            } else if (chartIndex == 2) {
                // Smooth coloring, spline surface interpolation
                c.addTitle("Spline Surface - Continuous Coloring", "Arial Bold Italic", 12);
                layer.setContourColor(Chart.Transparent);
                layer.colorAxis().setColorGradient(true);
            } else {
                // Discrete coloring, linear surface interpolation
                c.addTitle("Linear Surface - Continuous Coloring", "Arial Bold Italic", 12);
                layer.setSmoothInterpolation(false);
                layer.setContourColor(Chart.Transparent);
                layer.colorAxis().setColorGradient(true);
            }

            // Output the chart
            viewer.Chart = c;
        }
    }
}
[ASP.NET Web Forms - C# version] NetWebCharts\CSharpASP\contourinterpolate.aspx
(Click here on how to convert this code to code-behind style.)<%@ Page Language="C#" Debug="true" %>
<%@ Import Namespace="ChartDirector" %>
<%@ Register TagPrefix="chart" Namespace="ChartDirector" Assembly="netchartdir" %>
<!DOCTYPE html>
<script runat="server">
//
// Create chart
//
protected void createChart(WebChartViewer viewer, int chartIndex)
{
// The x and y coordinates of the grid
double[] dataX = {-4, -3, -2, -1, 0, 1, 2, 3, 4};
double[] dataY = {-4, -3, -2, -1, 0, 1, 2, 3, 4};
// The values at the grid points. In this example, we will compute the values using the formula
// z = Sin(x * pi / 3) * Sin(y * pi / 3).
double[] dataZ = new double[dataX.Length * dataY.Length];
for(int yIndex = 0; yIndex < dataY.Length; ++yIndex) {
double y = dataY[yIndex];
for(int xIndex = 0; xIndex < dataX.Length; ++xIndex) {
double x = dataX[xIndex];
dataZ[yIndex * dataX.Length + xIndex] = Math.Sin(x * 3.1416 / 3) * Math.Sin(y * 3.1416 /
3);
}
}
// Create a XYChart object of size 360 x 360 pixels
XYChart c = new XYChart(360, 360);
// Set the plotarea at (30, 25) and of size 300 x 300 pixels. Use semi-transparent black
// (c0000000) for both horizontal and vertical grid lines
c.setPlotArea(30, 25, 300, 300, -1, -1, -1, unchecked((int)0xc0000000), -1);
// Add a contour layer using the given data
ContourLayer layer = c.addContourLayer(dataX, dataY, dataZ);
// Set the x-axis and y-axis scale
c.xAxis().setLinearScale(-4, 4, 1);
c.yAxis().setLinearScale(-4, 4, 1);
if (chartIndex == 0) {
// Discrete coloring, spline surface interpolation
c.addTitle("Spline Surface - Discrete Coloring", "Arial Bold Italic", 12);
} else if (chartIndex == 1) {
// Discrete coloring, linear surface interpolation
c.addTitle("Linear Surface - Discrete Coloring", "Arial Bold Italic", 12);
layer.setSmoothInterpolation(false);
} else if (chartIndex == 2) {
// Smooth coloring, spline surface interpolation
c.addTitle("Spline Surface - Continuous Coloring", "Arial Bold Italic", 12);
layer.setContourColor(Chart.Transparent);
layer.colorAxis().setColorGradient(true);
} else {
// Discrete coloring, linear surface interpolation
c.addTitle("Linear Surface - Continuous Coloring", "Arial Bold Italic", 12);
layer.setSmoothInterpolation(false);
layer.setContourColor(Chart.Transparent);
layer.colorAxis().setColorGradient(true);
}
// Output the chart
viewer.Image = c.makeWebImage(Chart.SVG);
}
//
// Page Load event handler
//
protected void Page_Load(object sender, EventArgs e)
{
createChart(WebChartViewer0, 0);
createChart(WebChartViewer1, 1);
createChart(WebChartViewer2, 2);
createChart(WebChartViewer3, 3);
}
</script>
<html>
<head>
<script type="text/javascript" src="cdjcv.js"></script>
</head>
<body>
<chart:WebChartViewer id="WebChartViewer0" runat="server" />
<chart:WebChartViewer id="WebChartViewer1" runat="server" />
<chart:WebChartViewer id="WebChartViewer2" runat="server" />
<chart:WebChartViewer id="WebChartViewer3" runat="server" />
</body>
</html>
[ASP.NET Web Forms - VB Version] NetWebCharts\VBNetASP\contourinterpolate.aspx
(Click here on how to convert this code to code-behind style.)<%@ Page Language="VB" Debug="true" %>
<%@ Import Namespace="ChartDirector" %>
<%@ Register TagPrefix="chart" Namespace="ChartDirector" Assembly="netchartdir" %>
<!DOCTYPE html>
<script runat="server">
'
' Create chart
'
Protected Sub createChart(viewer As WebChartViewer, chartIndex As Integer)
' The x and y coordinates of the grid
Dim dataX() As Double = {-4, -3, -2, -1, 0, 1, 2, 3, 4}
Dim dataY() As Double = {-4, -3, -2, -1, 0, 1, 2, 3, 4}
' The values at the grid points. In this example, we will compute the values using the formula z
' = Sin(x * pi / 3) * Sin(y * pi / 3).
Dim dataZ((UBound(dataX) + 1) * (UBound(dataY) + 1) - 1) As Double
For yIndex As Integer = 0 To UBound(dataY)
Dim y As Double = dataY(yIndex)
For xIndex As Integer = 0 To UBound(dataX)
Dim x As Double = dataX(xIndex)
dataZ(yIndex * (UBound(dataX) + 1) + xIndex) = Math.Sin(x * 3.1416 / 3) * Math.Sin(y * _
3.1416 / 3)
Next
Next
' Create a XYChart object of size 360 x 360 pixels
Dim c As XYChart = New XYChart(360, 360)
' Set the plotarea at (30, 25) and of size 300 x 300 pixels. Use semi-transparent black
' (c0000000) for both horizontal and vertical grid lines
c.setPlotArea(30, 25, 300, 300, -1, -1, -1, &Hc0000000, -1)
' Add a contour layer using the given data
Dim layer As ContourLayer = c.addContourLayer(dataX, dataY, dataZ)
' Set the x-axis and y-axis scale
c.xAxis().setLinearScale(-4, 4, 1)
c.yAxis().setLinearScale(-4, 4, 1)
If chartIndex = 0 Then
' Discrete coloring, spline surface interpolation
c.addTitle("Spline Surface - Discrete Coloring", "Arial Bold Italic", 12)
ElseIf chartIndex = 1 Then
' Discrete coloring, linear surface interpolation
c.addTitle("Linear Surface - Discrete Coloring", "Arial Bold Italic", 12)
layer.setSmoothInterpolation(False)
ElseIf chartIndex = 2 Then
' Smooth coloring, spline surface interpolation
c.addTitle("Spline Surface - Continuous Coloring", "Arial Bold Italic", 12)
layer.setContourColor(Chart.Transparent)
layer.colorAxis().setColorGradient(True)
Else
' Discrete coloring, linear surface interpolation
c.addTitle("Linear Surface - Continuous Coloring", "Arial Bold Italic", 12)
layer.setSmoothInterpolation(False)
layer.setContourColor(Chart.Transparent)
layer.colorAxis().setColorGradient(True)
End If
' Output the chart
viewer.Image = c.makeWebImage(Chart.SVG)
End Sub
'
' Page Load event handler
'
Protected Sub Page_Load(ByVal sender As System.Object, ByVal e As System.EventArgs)
createChart(WebChartViewer0, 0)
createChart(WebChartViewer1, 1)
createChart(WebChartViewer2, 2)
createChart(WebChartViewer3, 3)
End Sub
</script>
<html>
<head>
<script type="text/javascript" src="cdjcv.js"></script>
</head>
<body>
<chart:WebChartViewer id="WebChartViewer0" runat="server" />
<chart:WebChartViewer id="WebChartViewer1" runat="server" />
<chart:WebChartViewer id="WebChartViewer2" runat="server" />
<chart:WebChartViewer id="WebChartViewer3" runat="server" />
</body>
</html>
[ASP.NET MVC - Controller] NetMvcCharts\Controllers\ContourinterpolateController.cs
using System;
using System.Web.Mvc;
using ChartDirector;

namespace NetMvcCharts.Controllers
{
    public class ContourinterpolateController : Controller
    {
        //
        // Default Action
        //
        public ActionResult Index()
        {
            ViewBag.Title = "Contour Interpolation";

            // This example contains 4 charts.
            ViewBag.Viewer = new RazorChartViewer[4];
            for (int i = 0; i < ViewBag.Viewer.Length; ++i)
                createChart(ViewBag.Viewer[i] = new RazorChartViewer(HttpContext, "chart" + i), i);

            return View("~/Views/Shared/ChartView.cshtml");
        }

        //
        // Create chart
        //
        private void createChart(RazorChartViewer viewer, int chartIndex)
        {
            // The x and y coordinates of the grid
            double[] dataX = {-4, -3, -2, -1, 0, 1, 2, 3, 4};
            double[] dataY = {-4, -3, -2, -1, 0, 1, 2, 3, 4};

            // The values at the grid points. In this example, we will compute the values using the
            // formula z = Sin(x * pi / 3) * Sin(y * pi / 3).
            double[] dataZ = new double[dataX.Length * dataY.Length];
            for(int yIndex = 0; yIndex < dataY.Length; ++yIndex) {
                double y = dataY[yIndex];
                for(int xIndex = 0; xIndex < dataX.Length; ++xIndex) {
                    double x = dataX[xIndex];
                    dataZ[yIndex * dataX.Length + xIndex] = Math.Sin(x * 3.1416 / 3) * Math.Sin(y *
                        3.1416 / 3);
                }
            }

            // Create a XYChart object of size 360 x 360 pixels
            XYChart c = new XYChart(360, 360);

            // Set the plotarea at (30, 25) and of size 300 x 300 pixels. Use semi-transparent black
            // (c0000000) for both horizontal and vertical grid lines
            c.setPlotArea(30, 25, 300, 300, -1, -1, -1, unchecked((int)0xc0000000), -1);

            // Add a contour layer using the given data
            ContourLayer layer = c.addContourLayer(dataX, dataY, dataZ);

            // Set the x-axis and y-axis scale
            c.xAxis().setLinearScale(-4, 4, 1);
            c.yAxis().setLinearScale(-4, 4, 1);

            if (chartIndex == 0) {
                // Discrete coloring, spline surface interpolation
                c.addTitle("Spline Surface - Discrete Coloring", "Arial Bold Italic", 12);
            } else if (chartIndex == 1) {
                // Discrete coloring, linear surface interpolation
                c.addTitle("Linear Surface - Discrete Coloring", "Arial Bold Italic", 12);
                layer.setSmoothInterpolation(false);
            } else if (chartIndex == 2) {
                // Smooth coloring, spline surface interpolation
                c.addTitle("Spline Surface - Continuous Coloring", "Arial Bold Italic", 12);
                layer.setContourColor(Chart.Transparent);
                layer.colorAxis().setColorGradient(true);
            } else {
                // Discrete coloring, linear surface interpolation
                c.addTitle("Linear Surface - Continuous Coloring", "Arial Bold Italic", 12);
                layer.setSmoothInterpolation(false);
                layer.setContourColor(Chart.Transparent);
                layer.colorAxis().setColorGradient(true);
            }

            // Output the chart
            viewer.Image = c.makeWebImage(Chart.SVG);
        }
    }
}
[ASP.NET MVC - View] NetMvcCharts\Views\Shared\ChartView.cshtml
@{ Layout = null; }

<!DOCTYPE html>

<html>
<head>
    <meta name="viewport" content="width=device-width" />
    <title>@ViewBag.Title</title>
    <style>
        @ViewBag.Style
    </style>
    @Scripts.Render("~/Scripts/cdjcv.js")
</head>
<body style="margin:5px 0px 0px 5px">
    <div style="font:bold 18pt verdana;">
        @ViewBag.Title
    </div>
    <hr style="border:solid 1px #000080; background:#000080" />
    <div>
        @{
            if (ViewBag.Viewer is Array)
            {
                // Display multiple charts
                for (int i = 0; i < ViewBag.Viewer.Length; ++i)
                {
                    @:@Html.Raw(ViewBag.Viewer[i].RenderHTML())
                }
            }
            else
            {
                // Display one chart only
                @:@Html.Raw(ViewBag.Viewer.RenderHTML())
            }
        }
    </div>
</body>
</html>
© 2023 Advanced Software Engineering Limited. All rights reserved.