[Windows Forms - C# version] NetWinCharts\CSharpWinCharts\datatable.cs
using System;
using ChartDirector;
namespace CSharpChartExplorer
{
public class datatable : DemoModule
{
//Name of demo module
public string getName() { return "Data Table (1)"; }
//Number of charts produced in this demo module
public int getNoOfCharts() { return 1; }
//Main code for creating chart.
//Note: the argument chartIndex is unused because this demo only has 1 chart.
public void createChart(WinChartViewer viewer, int chartIndex)
{
// The data for the line chart
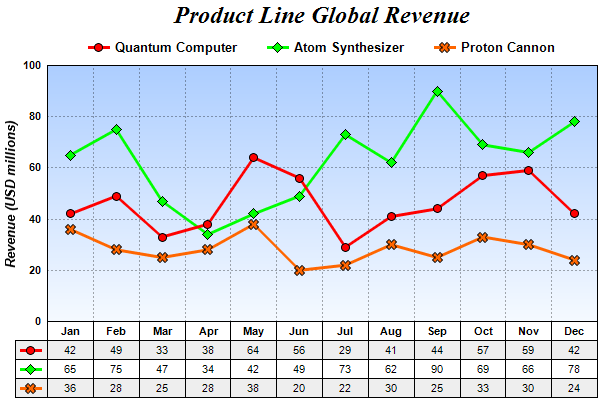
double[] data0 = {42, 49, 33, 38, 64, 56, 29, 41, 44, 57, 59, 42};
double[] data1 = {65, 75, 47, 34, 42, 49, 73, 62, 90, 69, 66, 78};
double[] data2 = {36, 28, 25, 28, 38, 20, 22, 30, 25, 33, 30, 24};
string[] labels = {"Jan", "Feb", "Mar", "Apr", "May", "Jun", "Jul", "Aug", "Sep", "Oct",
"Nov", "Dec"};
// Create a XYChart object of size 600 x 400 pixels
XYChart c = new XYChart(600, 400);
// Add a title to the chart using 18pt Times Bold Italic font
ChartDirector.TextBox title = c.addTitle("Product Line Global Revenue",
"Times New Roman Bold Italic", 18);
// Tentatively set the plotarea at (50, 55) and of (chart_width - 100) x (chart_height -
// 120) pixels in size. Use a vertical gradient color from sky blue (aaccff) t0 light
// blue (f9f9ff) as background. Set both horizontal and vertical grid lines to dotted
// semi-transprent black (aa000000).
PlotArea plotArea = c.setPlotArea(50, 55, c.getWidth() - 100, c.getHeight() - 120,
c.linearGradientColor(0, 55, 0, 55 + c.getHeight() - 120, 0xaaccff, 0xf9fcff), -1,
-1, c.dashLineColor(unchecked((int)0xaa000000), Chart.DotLine), -1);
// Add a legend box and anchored the top center at the horizontal center of the chart,
// just under the title. Use 10pt Arial Bold as font, with transparent background and
// border.
LegendBox legendBox = c.addLegend(c.getWidth() / 2, title.getHeight(), false,
"Arial Bold", 10);
legendBox.setAlignment(Chart.TopCenter);
legendBox.setBackground(Chart.Transparent, Chart.Transparent);
// Set y-axis title using 10 points Arial Bold Italic font, label style to 8 points
// Arial Bold, and axis color to transparent
c.yAxis().setTitle("Revenue (USD millions)", "Arial Bold Italic", 10);
c.yAxis().setLabelStyle("Arial Bold", 8);
c.yAxis().setColors(Chart.Transparent);
// Set y-axis tick density to 30 pixels. ChartDirector auto-scaling will use this as the
// guideline when putting ticks on the y-axis.
c.yAxis().setTickDensity(30);
// Add a line layer to the chart
LineLayer layer = c.addLineLayer2();
// Set the line width to 3 pixels
layer.setLineWidth(3);
// Add the three data sets to the line layer, using circles, diamands and X shapes as
// symbols
layer.addDataSet(data0, 0xff0000, "Quantum Computer").setDataSymbol(Chart.CircleSymbol,
9);
layer.addDataSet(data1, 0x00ff00, "Atom Synthesizer").setDataSymbol(Chart.DiamondSymbol,
11);
layer.addDataSet(data2, 0xff6600, "Proton Cannon").setDataSymbol(Chart.Cross2Shape(), 11
);
// Set the x axis labels
c.xAxis().setLabels(labels);
// Convert the labels on the x-axis to a CDMLTable
CDMLTable table = c.xAxis().makeLabelTable();
// Set the default top/bottom margins of the cells to 3 pixels
table.getStyle().setMargin2(0, 0, 3, 3);
// Use Arial Bold as the font for the first row
table.getRowStyle(0).setFontStyle("Arial Bold");
//
// We can add more information to the table. In this sample code, we add the data series
// and the legend icons to the table.
//
// Add 3 more rows to the table. Set the background of the 1st and 3rd rows to light
// grey (eeeeee).
table.appendRow().setBackground(0xeeeeee, Chart.LineColor);
table.appendRow();
table.appendRow().setBackground(0xeeeeee, Chart.LineColor);
// Put the values of the 3 data series to the cells in the 3 rows
for(int i = 0; i < data0.Length; ++i) {
table.setText(i, 1, (data0[i]).ToString());
table.setText(i, 2, (data1[i]).ToString());
table.setText(i, 3, (data2[i]).ToString());
}
// Insert a column on the left for the legend icons. Use 5 pixels left/right margins and
// 3 pixels top/bottom margins for the cells in this column.
table.insertCol(0).setMargin2(5, 5, 3, 3);
// The top cell is set to transparent, so it is invisible
table.getCell(0, 0).setBackground(Chart.Transparent, Chart.Transparent);
// The other 3 cells are set to the legend icons of the 3 data series
table.setText(0, 1, layer.getLegendIcon(0));
table.setText(0, 2, layer.getLegendIcon(1));
table.setText(0, 3, layer.getLegendIcon(2));
// Layout legend box first, so we can get its size
c.layoutLegend();
// Adjust the plot area size, such that the bounding box (inclusive of axes) is 2 pixels
// from the left, right and bottom edge, and is just under the legend box.
c.packPlotArea(2, legendBox.getTopY() + legendBox.getHeight(), c.getWidth() - 3,
c.getHeight() - 3);
// After determining the exact plot area position, we may adjust the legend box and the
// title positions so that they are centered relative to the plot area (instead of the
// chart)
legendBox.setPos(plotArea.getLeftX() + (plotArea.getWidth() - legendBox.getWidth()) / 2,
legendBox.getTopY());
title.setPos(plotArea.getLeftX() + (plotArea.getWidth() - title.getWidth()) / 2,
title.getTopY());
// Output the chart
viewer.Chart = c;
//include tool tip for the chart
viewer.ImageMap = c.getHTMLImageMap("clickable", "",
"title='Revenue of {dataSetName} in {xLabel}: US$ {value}M'");
}
}
}
[Windows Forms - VB Version] NetWinCharts\VBNetWinCharts\datatable.vb
Imports System
Imports Microsoft.VisualBasic
Imports ChartDirector

Public Class datatable
    Implements DemoModule

    'Name of demo module
    Public Function getName() As String Implements DemoModule.getName
        Return "Data Table (1)"
    End Function

    'Number of charts produced in this demo module
    Public Function getNoOfCharts() As Integer Implements DemoModule.getNoOfCharts
        Return 1
    End Function

    'Main code for creating chart.
    'Note: the argument chartIndex is unused because this demo only has 1 chart.
    Public Sub createChart(viewer As WinChartViewer, chartIndex As Integer) _
        Implements DemoModule.createChart

        ' The data for the line chart
        Dim data0() As Double = {42, 49, 33, 38, 64, 56, 29, 41, 44, 57, 59, 42}
        Dim data1() As Double = {65, 75, 47, 34, 42, 49, 73, 62, 90, 69, 66, 78}
        Dim data2() As Double = {36, 28, 25, 28, 38, 20, 22, 30, 25, 33, 30, 24}
        Dim labels() As String = {"Jan", "Feb", "Mar", "Apr", "May", "Jun", "Jul", "Aug", "Sep", _
            "Oct", "Nov", "Dec"}

        ' Create a XYChart object of size 600 x 400 pixels
        Dim c As XYChart = New XYChart(600, 400)

        ' Add a title to the chart using 18pt Times Bold Italic font
        Dim title As ChartDirector.TextBox = c.addTitle("Product Line Global Revenue", _
            "Times New Roman Bold Italic", 18)

        ' Tentatively set the plotarea at (50, 55) and of (chart_width - 100) x (chart_height - 120)
        ' pixels in size. Use a vertical gradient color from sky blue (aaccff) t0 light blue
        ' (f9f9ff) as background. Set both horizontal and vertical grid lines to dotted
        ' semi-transprent black (aa000000).
        Dim plotArea As PlotArea = c.setPlotArea(50, 55, c.getWidth() - 100, c.getHeight() - 120, _
            c.linearGradientColor(0, 55, 0, 55 + c.getHeight() - 120, &Haaccff, &Hf9fcff), -1, -1, _
            c.dashLineColor(&Haa000000, Chart.DotLine), -1)

        ' Add a legend box and anchored the top center at the horizontal center of the chart, just
        ' under the title. Use 10pt Arial Bold as font, with transparent background and border.
        Dim legendBox As LegendBox = c.addLegend(c.getWidth() / 2, title.getHeight(), False, _
            "Arial Bold", 10)
        legendBox.setAlignment(Chart.TopCenter)
        legendBox.setBackground(Chart.Transparent, Chart.Transparent)

        ' Set y-axis title using 10 points Arial Bold Italic font, label style to 8 points Arial
        ' Bold, and axis color to transparent
        c.yAxis().setTitle("Revenue (USD millions)", "Arial Bold Italic", 10)
        c.yAxis().setLabelStyle("Arial Bold", 8)
        c.yAxis().setColors(Chart.Transparent)

        ' Set y-axis tick density to 30 pixels. ChartDirector auto-scaling will use this as the
        ' guideline when putting ticks on the y-axis.
        c.yAxis().setTickDensity(30)

        ' Add a line layer to the chart
        Dim layer As LineLayer = c.addLineLayer2()

        ' Set the line width to 3 pixels
        layer.setLineWidth(3)

        ' Add the three data sets to the line layer, using circles, diamands and X shapes as symbols
        layer.addDataSet(data0, &Hff0000, "Quantum Computer").setDataSymbol(Chart.CircleSymbol, 9)
        layer.addDataSet(data1, &H00ff00, "Atom Synthesizer").setDataSymbol(Chart.DiamondSymbol, _
            11)
        layer.addDataSet(data2, &Hff6600, "Proton Cannon").setDataSymbol(Chart.Cross2Shape(), 11)

        ' Set the x axis labels
        c.xAxis().setLabels(labels)

        ' Convert the labels on the x-axis to a CDMLTable
        Dim table As CDMLTable = c.xAxis().makeLabelTable()

        ' Set the default top/bottom margins of the cells to 3 pixels
        table.getStyle().setMargin2(0, 0, 3, 3)

        ' Use Arial Bold as the font for the first row
        table.getRowStyle(0).setFontStyle("Arial Bold")

        '
        ' We can add more information to the table. In this sample code, we add the data series and
        ' the legend icons to the table.
        '

        ' Add 3 more rows to the table. Set the background of the 1st and 3rd rows to light grey
        ' (eeeeee).
        table.appendRow().setBackground(&Heeeeee, Chart.LineColor)
        table.appendRow()
        table.appendRow().setBackground(&Heeeeee, Chart.LineColor)

        ' Put the values of the 3 data series to the cells in the 3 rows
        For i As Integer = 0 To UBound(data0)
            table.setText(i, 1, CStr(data0(i)))
            table.setText(i, 2, CStr(data1(i)))
            table.setText(i, 3, CStr(data2(i)))
        Next

        ' Insert a column on the left for the legend icons. Use 5 pixels left/right margins and 3
        ' pixels top/bottom margins for the cells in this column.
        table.insertCol(0).setMargin2(5, 5, 3, 3)

        ' The top cell is set to transparent, so it is invisible
        table.getCell(0, 0).setBackground(Chart.Transparent, Chart.Transparent)

        ' The other 3 cells are set to the legend icons of the 3 data series
        table.setText(0, 1, layer.getLegendIcon(0))
        table.setText(0, 2, layer.getLegendIcon(1))
        table.setText(0, 3, layer.getLegendIcon(2))

        ' Layout legend box first, so we can get its size
        c.layoutLegend()

        ' Adjust the plot area size, such that the bounding box (inclusive of axes) is 2 pixels from
        ' the left, right and bottom edge, and is just under the legend box.
        c.packPlotArea(2, legendBox.getTopY() + legendBox.getHeight(), c.getWidth() - 3, _
            c.getHeight() - 3)

        ' After determining the exact plot area position, we may adjust the legend box and the title
        ' positions so that they are centered relative to the plot area (instead of the chart)
        legendBox.setPos(plotArea.getLeftX() + (plotArea.getWidth() - legendBox.getWidth()) / 2, _
            legendBox.getTopY())
        title.setPos(plotArea.getLeftX() + (plotArea.getWidth() - title.getWidth()) / 2, _
            title.getTopY())

        ' Output the chart
        viewer.Chart = c

        'include tool tip for the chart
        viewer.ImageMap = c.getHTMLImageMap("clickable", "", _
            "title='Revenue of {dataSetName} in {xLabel}: US$ {value}M'")

    End Sub

End Class
[WPF - C#] NetWPFCharts\CSharpWPFCharts\datatable.cs
using System;
using ChartDirector;

namespace CSharpWPFCharts
{
    public class datatable : DemoModule
    {
        //Name of demo module
        public string getName() { return "Data Table (1)"; }

        //Number of charts produced in this demo module
        public int getNoOfCharts() { return 1; }

        //Main code for creating chart.
        //Note: the argument chartIndex is unused because this demo only has 1 chart.
        public void createChart(WPFChartViewer viewer, int chartIndex)
        {
            // The data for the line chart
            double[] data0 = {42, 49, 33, 38, 64, 56, 29, 41, 44, 57, 59, 42};
            double[] data1 = {65, 75, 47, 34, 42, 49, 73, 62, 90, 69, 66, 78};
            double[] data2 = {36, 28, 25, 28, 38, 20, 22, 30, 25, 33, 30, 24};
            string[] labels = {"Jan", "Feb", "Mar", "Apr", "May", "Jun", "Jul", "Aug", "Sep", "Oct",
                "Nov", "Dec"};

            // Create a XYChart object of size 600 x 400 pixels
            XYChart c = new XYChart(600, 400);

            // Add a title to the chart using 18pt Times Bold Italic font
            ChartDirector.TextBox title = c.addTitle("Product Line Global Revenue",
                "Times New Roman Bold Italic", 18);

            // Tentatively set the plotarea at (50, 55) and of (chart_width - 100) x (chart_height -
            // 120) pixels in size. Use a vertical gradient color from sky blue (aaccff) t0 light
            // blue (f9f9ff) as background. Set both horizontal and vertical grid lines to dotted
            // semi-transprent black (aa000000).
            PlotArea plotArea = c.setPlotArea(50, 55, c.getWidth() - 100, c.getHeight() - 120,
                c.linearGradientColor(0, 55, 0, 55 + c.getHeight() - 120, 0xaaccff, 0xf9fcff), -1,
                -1, c.dashLineColor(unchecked((int)0xaa000000), Chart.DotLine), -1);

            // Add a legend box and anchored the top center at the horizontal center of the chart,
            // just under the title. Use 10pt Arial Bold as font, with transparent background and
            // border.
            LegendBox legendBox = c.addLegend(c.getWidth() / 2, title.getHeight(), false,
                "Arial Bold", 10);
            legendBox.setAlignment(Chart.TopCenter);
            legendBox.setBackground(Chart.Transparent, Chart.Transparent);

            // Set y-axis title using 10 points Arial Bold Italic font, label style to 8 points
            // Arial Bold, and axis color to transparent
            c.yAxis().setTitle("Revenue (USD millions)", "Arial Bold Italic", 10);
            c.yAxis().setLabelStyle("Arial Bold", 8);
            c.yAxis().setColors(Chart.Transparent);

            // Set y-axis tick density to 30 pixels. ChartDirector auto-scaling will use this as the
            // guideline when putting ticks on the y-axis.
            c.yAxis().setTickDensity(30);

            // Add a line layer to the chart
            LineLayer layer = c.addLineLayer2();

            // Set the line width to 3 pixels
            layer.setLineWidth(3);

            // Add the three data sets to the line layer, using circles, diamands and X shapes as
            // symbols
            layer.addDataSet(data0, 0xff0000, "Quantum Computer").setDataSymbol(Chart.CircleSymbol,
                9);
            layer.addDataSet(data1, 0x00ff00, "Atom Synthesizer").setDataSymbol(Chart.DiamondSymbol,
                11);
            layer.addDataSet(data2, 0xff6600, "Proton Cannon").setDataSymbol(Chart.Cross2Shape(), 11
                );

            // Set the x axis labels
            c.xAxis().setLabels(labels);

            // Convert the labels on the x-axis to a CDMLTable
            CDMLTable table = c.xAxis().makeLabelTable();

            // Set the default top/bottom margins of the cells to 3 pixels
            table.getStyle().setMargin2(0, 0, 3, 3);

            // Use Arial Bold as the font for the first row
            table.getRowStyle(0).setFontStyle("Arial Bold");

            //
            // We can add more information to the table. In this sample code, we add the data series
            // and the legend icons to the table.
            //

            // Add 3 more rows to the table. Set the background of the 1st and 3rd rows to light
            // grey (eeeeee).
            table.appendRow().setBackground(0xeeeeee, Chart.LineColor);
            table.appendRow();
            table.appendRow().setBackground(0xeeeeee, Chart.LineColor);

            // Put the values of the 3 data series to the cells in the 3 rows
            for(int i = 0; i < data0.Length; ++i) {
                table.setText(i, 1, (data0[i]).ToString());
                table.setText(i, 2, (data1[i]).ToString());
                table.setText(i, 3, (data2[i]).ToString());
            }

            // Insert a column on the left for the legend icons. Use 5 pixels left/right margins and
            // 3 pixels top/bottom margins for the cells in this column.
            table.insertCol(0).setMargin2(5, 5, 3, 3);

            // The top cell is set to transparent, so it is invisible
            table.getCell(0, 0).setBackground(Chart.Transparent, Chart.Transparent);

            // The other 3 cells are set to the legend icons of the 3 data series
            table.setText(0, 1, layer.getLegendIcon(0));
            table.setText(0, 2, layer.getLegendIcon(1));
            table.setText(0, 3, layer.getLegendIcon(2));

            // Layout legend box first, so we can get its size
            c.layoutLegend();

            // Adjust the plot area size, such that the bounding box (inclusive of axes) is 2 pixels
            // from the left, right and bottom edge, and is just under the legend box.
            c.packPlotArea(2, legendBox.getTopY() + legendBox.getHeight(), c.getWidth() - 3,
                c.getHeight() - 3);

            // After determining the exact plot area position, we may adjust the legend box and the
            // title positions so that they are centered relative to the plot area (instead of the
            // chart)
            legendBox.setPos(plotArea.getLeftX() + (plotArea.getWidth() - legendBox.getWidth()) / 2,
                legendBox.getTopY());
            title.setPos(plotArea.getLeftX() + (plotArea.getWidth() - title.getWidth()) / 2,
                title.getTopY());

            // Output the chart
            viewer.Chart = c;

            //include tool tip for the chart
            viewer.ImageMap = c.getHTMLImageMap("clickable", "",
                "title='Revenue of {dataSetName} in {xLabel}: US$ {value}M'");
        }
    }
}
[ASP.NET Web Forms - C# version] NetWebCharts\CSharpASP\datatable.aspx
(Click here on how to convert this code to code-behind style.)<%@ Page Language="C#" Debug="true" %>
<%@ Import Namespace="ChartDirector" %>
<%@ Register TagPrefix="chart" Namespace="ChartDirector" Assembly="netchartdir" %>
<!DOCTYPE html>
<script runat="server">
//
// Page Load event handler
//
protected void Page_Load(object sender, EventArgs e)
{
// The data for the line chart
double[] data0 = {42, 49, 33, 38, 64, 56, 29, 41, 44, 57, 59, 42};
double[] data1 = {65, 75, 47, 34, 42, 49, 73, 62, 90, 69, 66, 78};
double[] data2 = {36, 28, 25, 28, 38, 20, 22, 30, 25, 33, 30, 24};
string[] labels = {"Jan", "Feb", "Mar", "Apr", "May", "Jun", "Jul", "Aug", "Sep", "Oct", "Nov",
"Dec"};
// Create a XYChart object of size 600 x 400 pixels
XYChart c = new XYChart(600, 400);
// Add a title to the chart using 18pt Times Bold Italic font
ChartDirector.TextBox title = c.addTitle("Product Line Global Revenue",
"Times New Roman Bold Italic", 18);
// Tentatively set the plotarea at (50, 55) and of (chart_width - 100) x (chart_height - 120)
// pixels in size. Use a vertical gradient color from sky blue (aaccff) t0 light blue (f9f9ff)
// as background. Set both horizontal and vertical grid lines to dotted semi-transprent black
// (aa000000).
PlotArea plotArea = c.setPlotArea(50, 55, c.getWidth() - 100, c.getHeight() - 120,
c.linearGradientColor(0, 55, 0, 55 + c.getHeight() - 120, 0xaaccff, 0xf9fcff), -1, -1,
c.dashLineColor(unchecked((int)0xaa000000), Chart.DotLine), -1);
// Add a legend box and anchored the top center at the horizontal center of the chart, just
// under the title. Use 10pt Arial Bold as font, with transparent background and border.
LegendBox legendBox = c.addLegend(c.getWidth() / 2, title.getHeight(), false, "Arial Bold", 10);
legendBox.setAlignment(Chart.TopCenter);
legendBox.setBackground(Chart.Transparent, Chart.Transparent);
// Set y-axis title using 10 points Arial Bold Italic font, label style to 8 points Arial Bold,
// and axis color to transparent
c.yAxis().setTitle("Revenue (USD millions)", "Arial Bold Italic", 10);
c.yAxis().setLabelStyle("Arial Bold", 8);
c.yAxis().setColors(Chart.Transparent);
// Set y-axis tick density to 30 pixels. ChartDirector auto-scaling will use this as the
// guideline when putting ticks on the y-axis.
c.yAxis().setTickDensity(30);
// Add a line layer to the chart
LineLayer layer = c.addLineLayer2();
// Set the line width to 3 pixels
layer.setLineWidth(3);
// Add the three data sets to the line layer, using circles, diamands and X shapes as symbols
layer.addDataSet(data0, 0xff0000, "Quantum Computer").setDataSymbol(Chart.CircleSymbol, 9);
layer.addDataSet(data1, 0x00ff00, "Atom Synthesizer").setDataSymbol(Chart.DiamondSymbol, 11);
layer.addDataSet(data2, 0xff6600, "Proton Cannon").setDataSymbol(Chart.Cross2Shape(), 11);
// Set the x axis labels
c.xAxis().setLabels(labels);
// Convert the labels on the x-axis to a CDMLTable
CDMLTable table = c.xAxis().makeLabelTable();
// Set the default top/bottom margins of the cells to 3 pixels
table.getStyle().setMargin2(0, 0, 3, 3);
// Use Arial Bold as the font for the first row
table.getRowStyle(0).setFontStyle("Arial Bold");
//
// We can add more information to the table. In this sample code, we add the data series and the
// legend icons to the table.
//
// Add 3 more rows to the table. Set the background of the 1st and 3rd rows to light grey
// (eeeeee).
table.appendRow().setBackground(0xeeeeee, Chart.LineColor);
table.appendRow();
table.appendRow().setBackground(0xeeeeee, Chart.LineColor);
// Put the values of the 3 data series to the cells in the 3 rows
for(int i = 0; i < data0.Length; ++i) {
table.setText(i, 1, (data0[i]).ToString());
table.setText(i, 2, (data1[i]).ToString());
table.setText(i, 3, (data2[i]).ToString());
}
// Insert a column on the left for the legend icons. Use 5 pixels left/right margins and 3
// pixels top/bottom margins for the cells in this column.
table.insertCol(0).setMargin2(5, 5, 3, 3);
// The top cell is set to transparent, so it is invisible
table.getCell(0, 0).setBackground(Chart.Transparent, Chart.Transparent);
// The other 3 cells are set to the legend icons of the 3 data series
table.setText(0, 1, layer.getLegendIcon(0));
table.setText(0, 2, layer.getLegendIcon(1));
table.setText(0, 3, layer.getLegendIcon(2));
// Layout legend box first, so we can get its size
c.layoutLegend();
// Adjust the plot area size, such that the bounding box (inclusive of axes) is 2 pixels from
// the left, right and bottom edge, and is just under the legend box.
c.packPlotArea(2, legendBox.getTopY() + legendBox.getHeight(), c.getWidth() - 3, c.getHeight() -
3);
// After determining the exact plot area position, we may adjust the legend box and the title
// positions so that they are centered relative to the plot area (instead of the chart)
legendBox.setPos(plotArea.getLeftX() + (plotArea.getWidth() - legendBox.getWidth()) / 2,
legendBox.getTopY());
title.setPos(plotArea.getLeftX() + (plotArea.getWidth() - title.getWidth()) / 2, title.getTopY()
);
// Output the chart
WebChartViewer1.Image = c.makeWebImage(Chart.SVG);
// Include tool tip for the chart
WebChartViewer1.ImageMap = c.getHTMLImageMap("", "",
"title='Revenue of {dataSetName} in {xLabel}: US$ {value}M'");
}
</script>
<html>
<head>
<script type="text/javascript" src="cdjcv.js"></script>
</head>
<body>
<chart:WebChartViewer id="WebChartViewer1" runat="server" />
</body>
</html>
[ASP.NET Web Forms - VB Version] NetWebCharts\VBNetASP\datatable.aspx
(Click here on how to convert this code to code-behind style.)<%@ Page Language="VB" Debug="true" %>
<%@ Import Namespace="ChartDirector" %>
<%@ Register TagPrefix="chart" Namespace="ChartDirector" Assembly="netchartdir" %>
<!DOCTYPE html>
<script runat="server">
'
' Page Load event handler
'
Protected Sub Page_Load(ByVal sender As System.Object, ByVal e As System.EventArgs)
' The data for the line chart
Dim data0() As Double = {42, 49, 33, 38, 64, 56, 29, 41, 44, 57, 59, 42}
Dim data1() As Double = {65, 75, 47, 34, 42, 49, 73, 62, 90, 69, 66, 78}
Dim data2() As Double = {36, 28, 25, 28, 38, 20, 22, 30, 25, 33, 30, 24}
Dim labels() As String = {"Jan", "Feb", "Mar", "Apr", "May", "Jun", "Jul", "Aug", "Sep", _
"Oct", "Nov", "Dec"}
' Create a XYChart object of size 600 x 400 pixels
Dim c As XYChart = New XYChart(600, 400)
' Add a title to the chart using 18pt Times Bold Italic font
Dim title As ChartDirector.TextBox = c.addTitle("Product Line Global Revenue", _
"Times New Roman Bold Italic", 18)
' Tentatively set the plotarea at (50, 55) and of (chart_width - 100) x (chart_height - 120)
' pixels in size. Use a vertical gradient color from sky blue (aaccff) t0 light blue (f9f9ff) as
' background. Set both horizontal and vertical grid lines to dotted semi-transprent black
' (aa000000).
Dim plotArea As PlotArea = c.setPlotArea(50, 55, c.getWidth() - 100, c.getHeight() - 120, _
c.linearGradientColor(0, 55, 0, 55 + c.getHeight() - 120, &Haaccff, &Hf9fcff), -1, -1, _
c.dashLineColor(&Haa000000, Chart.DotLine), -1)
' Add a legend box and anchored the top center at the horizontal center of the chart, just under
' the title. Use 10pt Arial Bold as font, with transparent background and border.
Dim legendBox As LegendBox = c.addLegend(c.getWidth() / 2, title.getHeight(), False, _
"Arial Bold", 10)
legendBox.setAlignment(Chart.TopCenter)
legendBox.setBackground(Chart.Transparent, Chart.Transparent)
' Set y-axis title using 10 points Arial Bold Italic font, label style to 8 points Arial Bold,
' and axis color to transparent
c.yAxis().setTitle("Revenue (USD millions)", "Arial Bold Italic", 10)
c.yAxis().setLabelStyle("Arial Bold", 8)
c.yAxis().setColors(Chart.Transparent)
' Set y-axis tick density to 30 pixels. ChartDirector auto-scaling will use this as the
' guideline when putting ticks on the y-axis.
c.yAxis().setTickDensity(30)
' Add a line layer to the chart
Dim layer As LineLayer = c.addLineLayer2()
' Set the line width to 3 pixels
layer.setLineWidth(3)
' Add the three data sets to the line layer, using circles, diamands and X shapes as symbols
layer.addDataSet(data0, &Hff0000, "Quantum Computer").setDataSymbol(Chart.CircleSymbol, 9)
layer.addDataSet(data1, &H00ff00, "Atom Synthesizer").setDataSymbol(Chart.DiamondSymbol, 11)
layer.addDataSet(data2, &Hff6600, "Proton Cannon").setDataSymbol(Chart.Cross2Shape(), 11)
' Set the x axis labels
c.xAxis().setLabels(labels)
' Convert the labels on the x-axis to a CDMLTable
Dim table As CDMLTable = c.xAxis().makeLabelTable()
' Set the default top/bottom margins of the cells to 3 pixels
table.getStyle().setMargin2(0, 0, 3, 3)
' Use Arial Bold as the font for the first row
table.getRowStyle(0).setFontStyle("Arial Bold")
'
' We can add more information to the table. In this sample code, we add the data series and the
' legend icons to the table.
'
' Add 3 more rows to the table. Set the background of the 1st and 3rd rows to light grey
' (eeeeee).
table.appendRow().setBackground(&Heeeeee, Chart.LineColor)
table.appendRow()
table.appendRow().setBackground(&Heeeeee, Chart.LineColor)
' Put the values of the 3 data series to the cells in the 3 rows
For i As Integer = 0 To UBound(data0)
table.setText(i, 1, CStr(data0(i)))
table.setText(i, 2, CStr(data1(i)))
table.setText(i, 3, CStr(data2(i)))
Next
' Insert a column on the left for the legend icons. Use 5 pixels left/right margins and 3 pixels
' top/bottom margins for the cells in this column.
table.insertCol(0).setMargin2(5, 5, 3, 3)
' The top cell is set to transparent, so it is invisible
table.getCell(0, 0).setBackground(Chart.Transparent, Chart.Transparent)
' The other 3 cells are set to the legend icons of the 3 data series
table.setText(0, 1, layer.getLegendIcon(0))
table.setText(0, 2, layer.getLegendIcon(1))
table.setText(0, 3, layer.getLegendIcon(2))
' Layout legend box first, so we can get its size
c.layoutLegend()
' Adjust the plot area size, such that the bounding box (inclusive of axes) is 2 pixels from the
' left, right and bottom edge, and is just under the legend box.
c.packPlotArea(2, legendBox.getTopY() + legendBox.getHeight(), c.getWidth() - 3, c.getHeight() _
- 3)
' After determining the exact plot area position, we may adjust the legend box and the title
' positions so that they are centered relative to the plot area (instead of the chart)
legendBox.setPos(plotArea.getLeftX() + (plotArea.getWidth() - legendBox.getWidth()) / 2, _
legendBox.getTopY())
title.setPos(plotArea.getLeftX() + (plotArea.getWidth() - title.getWidth()) / 2, _
title.getTopY())
' Output the chart
WebChartViewer1.Image = c.makeWebImage(Chart.SVG)
' Include tool tip for the chart
WebChartViewer1.ImageMap = c.getHTMLImageMap("", "", _
"title='Revenue of {dataSetName} in {xLabel}: US$ {value}M'")
End Sub
</script>
<html>
<head>
<script type="text/javascript" src="cdjcv.js"></script>
</head>
<body>
<chart:WebChartViewer id="WebChartViewer1" runat="server" />
</body>
</html>
[ASP.NET MVC - Controller] NetMvcCharts\Controllers\DatatableController.cs
using System;
using System.Web.Mvc;
using ChartDirector;

namespace NetMvcCharts.Controllers
{
    public class DatatableController : Controller
    {
        //
        // Default Action
        //
        public ActionResult Index()
        {
            ViewBag.Title = "Data Table (1)";
            createChart(ViewBag.Viewer = new RazorChartViewer(HttpContext, "chart1"));
            return View("~/Views/Shared/ChartView.cshtml");
        }

        //
        // Create chart
        //
        private void createChart(RazorChartViewer viewer)
        {
            // The data for the line chart
            double[] data0 = {42, 49, 33, 38, 64, 56, 29, 41, 44, 57, 59, 42};
            double[] data1 = {65, 75, 47, 34, 42, 49, 73, 62, 90, 69, 66, 78};
            double[] data2 = {36, 28, 25, 28, 38, 20, 22, 30, 25, 33, 30, 24};
            string[] labels = {"Jan", "Feb", "Mar", "Apr", "May", "Jun", "Jul", "Aug", "Sep", "Oct",
                "Nov", "Dec"};

            // Create a XYChart object of size 600 x 400 pixels
            XYChart c = new XYChart(600, 400);

            // Add a title to the chart using 18pt Times Bold Italic font
            ChartDirector.TextBox title = c.addTitle("Product Line Global Revenue",
                "Times New Roman Bold Italic", 18);

            // Tentatively set the plotarea at (50, 55) and of (chart_width - 100) x (chart_height - 120)
            // pixels in size. Use a vertical gradient color from sky blue (aaccff) t0 light blue
            // (f9f9ff) as background. Set both horizontal and vertical grid lines to dotted
            // semi-transprent black (aa000000).
            PlotArea plotArea = c.setPlotArea(50, 55, c.getWidth() - 100, c.getHeight() - 120,
                c.linearGradientColor(0, 55, 0, 55 + c.getHeight() - 120, 0xaaccff, 0xf9fcff), -1, -1,
                c.dashLineColor(unchecked((int)0xaa000000), Chart.DotLine), -1);

            // Add a legend box and anchored the top center at the horizontal center of the chart, just
            // under the title. Use 10pt Arial Bold as font, with transparent background and border.
            LegendBox legendBox = c.addLegend(c.getWidth() / 2, title.getHeight(), false, "Arial Bold",
                10);
            legendBox.setAlignment(Chart.TopCenter);
            legendBox.setBackground(Chart.Transparent, Chart.Transparent);

            // Set y-axis title using 10 points Arial Bold Italic font, label style to 8 points Arial
            // Bold, and axis color to transparent
            c.yAxis().setTitle("Revenue (USD millions)", "Arial Bold Italic", 10);
            c.yAxis().setLabelStyle("Arial Bold", 8);
            c.yAxis().setColors(Chart.Transparent);

            // Set y-axis tick density to 30 pixels. ChartDirector auto-scaling will use this as the
            // guideline when putting ticks on the y-axis.
            c.yAxis().setTickDensity(30);

            // Add a line layer to the chart
            LineLayer layer = c.addLineLayer2();

            // Set the line width to 3 pixels
            layer.setLineWidth(3);

            // Add the three data sets to the line layer, using circles, diamands and X shapes as symbols
            layer.addDataSet(data0, 0xff0000, "Quantum Computer").setDataSymbol(Chart.CircleSymbol, 9);
            layer.addDataSet(data1, 0x00ff00, "Atom Synthesizer").setDataSymbol(Chart.DiamondSymbol, 11);
            layer.addDataSet(data2, 0xff6600, "Proton Cannon").setDataSymbol(Chart.Cross2Shape(), 11);

            // Set the x axis labels
            c.xAxis().setLabels(labels);

            // Convert the labels on the x-axis to a CDMLTable
            CDMLTable table = c.xAxis().makeLabelTable();

            // Set the default top/bottom margins of the cells to 3 pixels
            table.getStyle().setMargin2(0, 0, 3, 3);

            // Use Arial Bold as the font for the first row
            table.getRowStyle(0).setFontStyle("Arial Bold");

            //
            // We can add more information to the table. In this sample code, we add the data series and
            // the legend icons to the table.
            //

            // Add 3 more rows to the table. Set the background of the 1st and 3rd rows to light grey
            // (eeeeee).
            table.appendRow().setBackground(0xeeeeee, Chart.LineColor);
            table.appendRow();
            table.appendRow().setBackground(0xeeeeee, Chart.LineColor);

            // Put the values of the 3 data series to the cells in the 3 rows
            for(int i = 0; i < data0.Length; ++i) {
                table.setText(i, 1, (data0[i]).ToString());
                table.setText(i, 2, (data1[i]).ToString());
                table.setText(i, 3, (data2[i]).ToString());
            }

            // Insert a column on the left for the legend icons. Use 5 pixels left/right margins and 3
            // pixels top/bottom margins for the cells in this column.
            table.insertCol(0).setMargin2(5, 5, 3, 3);

            // The top cell is set to transparent, so it is invisible
            table.getCell(0, 0).setBackground(Chart.Transparent, Chart.Transparent);

            // The other 3 cells are set to the legend icons of the 3 data series
            table.setText(0, 1, layer.getLegendIcon(0));
            table.setText(0, 2, layer.getLegendIcon(1));
            table.setText(0, 3, layer.getLegendIcon(2));

            // Layout legend box first, so we can get its size
            c.layoutLegend();

            // Adjust the plot area size, such that the bounding box (inclusive of axes) is 2 pixels from
            // the left, right and bottom edge, and is just under the legend box.
            c.packPlotArea(2, legendBox.getTopY() + legendBox.getHeight(), c.getWidth() - 3, c.getHeight(
                ) - 3);

            // After determining the exact plot area position, we may adjust the legend box and the title
            // positions so that they are centered relative to the plot area (instead of the chart)
            legendBox.setPos(plotArea.getLeftX() + (plotArea.getWidth() - legendBox.getWidth()) / 2,
                legendBox.getTopY());
            title.setPos(plotArea.getLeftX() + (plotArea.getWidth() - title.getWidth()) / 2,
                title.getTopY());

            // Output the chart
            viewer.Image = c.makeWebImage(Chart.SVG);

            // Include tool tip for the chart
            viewer.ImageMap = c.getHTMLImageMap("", "",
                "title='Revenue of {dataSetName} in {xLabel}: US$ {value}M'");
        }
    }
}
[ASP.NET MVC - View] NetMvcCharts\Views\Shared\ChartView.cshtml
@{ Layout = null; }

<!DOCTYPE html>

<html>
<head>
    <meta name="viewport" content="width=device-width" />
    <title>@ViewBag.Title</title>
    <style>
        @ViewBag.Style
    </style>
    @Scripts.Render("~/Scripts/cdjcv.js")
</head>
<body style="margin:5px 0px 0px 5px">
    <div style="font:bold 18pt verdana;">
        @ViewBag.Title
    </div>
    <hr style="border:solid 1px #000080; background:#000080" />
    <div>
        @{
            if (ViewBag.Viewer is Array)
            {
                // Display multiple charts
                for (int i = 0; i < ViewBag.Viewer.Length; ++i)
                {
                    @:@Html.Raw(ViewBag.Viewer[i].RenderHTML())
                }
            }
            else
            {
                // Display one chart only
                @:@Html.Raw(ViewBag.Viewer.RenderHTML())
            }
        }
    </div>
</body>
</html>
© 2023 Advanced Software Engineering Limited. All rights reserved.