[Windows Forms - C# version] NetWinCharts\CSharpWinCharts\datatable2.cs
using System;
using ChartDirector;
namespace CSharpChartExplorer
{
public class datatable2 : DemoModule
{
//Name of demo module
public string getName() { return "Data Table (2)"; }
//Number of charts produced in this demo module
public int getNoOfCharts() { return 1; }
//Main code for creating chart.
//Note: the argument chartIndex is unused because this demo only has 1 chart.
public void createChart(WinChartViewer viewer, int chartIndex)
{
// The data for the line chart
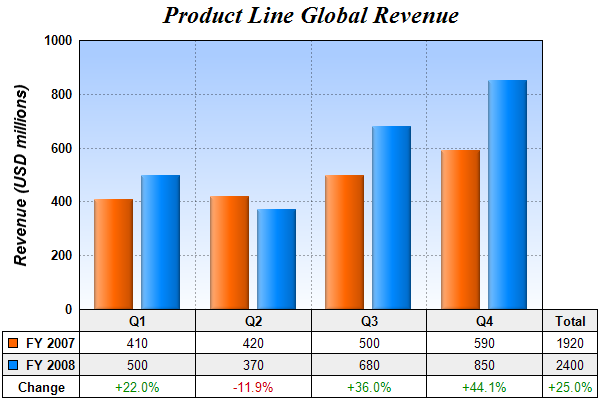
double[] data0 = {410, 420, 500, 590};
double[] data1 = {500, 370, 680, 850};
string[] labels = {"Q1", "Q2", "Q3", "Q4"};
// Create a XYChart object of size 600 x 400 pixels
XYChart c = new XYChart(600, 400);
// Add a title to the chart using 18pt Times Bold Italic font
ChartDirector.TextBox title = c.addTitle("Product Line Global Revenue",
"Times New Roman Bold Italic", 18);
// Tentatively set the plotarea at (50, 55) and of (chart_width - 100) x (chart_height -
// 150) pixels in size. Use a vertical gradient color from sky blue (aaccff) t0 light
// blue (f9f9ff) as background. Set both horizontal and vertical grid lines to dotted
// semi-transprent black (aa000000).
PlotArea plotArea = c.setPlotArea(50, 55, c.getWidth() - 100, c.getHeight() - 150,
c.linearGradientColor(0, 55, 0, 55 + c.getHeight() - 150, 0xaaccff, 0xf9fcff), -1,
-1, c.dashLineColor(unchecked((int)0xaa000000), Chart.DotLine), -1);
// Set y-axis title using 12 points Arial Bold Italic font, and set its position 10
// pixels from the axis.
c.yAxis().setTitle("Revenue (USD millions)", "Arial Bold Italic", 12);
c.yAxis().setTitlePos(Chart.Left, 10);
// Set y-axis label style to 10 points Arial Bold and axis color to transparent
c.yAxis().setLabelStyle("Arial Bold", 10);
c.yAxis().setColors(Chart.Transparent);
// Set y-axis tick density to 30 pixels. ChartDirector auto-scaling will use this as the
// guideline when putting ticks on the y-axis.
c.yAxis().setTickDensity(30);
// Add a bar layer to the chart with side layout
BarLayer layer = c.addBarLayer2(Chart.Side);
// Add two data sets to the bar layer
layer.addDataSet(data0, 0xff6600, "FY 2007");
layer.addDataSet(data1, 0x0088ff, "FY 2008");
// Use soft lighting effect with light direction from the left
layer.setBorderColor(Chart.Transparent, Chart.softLighting(Chart.Left));
// Set the x axis labels
c.xAxis().setLabels(labels);
// Convert the labels on the x-axis to a CDMLTable
CDMLTable table = c.xAxis().makeLabelTable();
// Set the default left/right margins to 5 pixels and top/bottom margins to 3 pixels.
// Set the default font size to 10 points
ChartDirector.TextBox cellStyle = table.getStyle();
cellStyle.setMargin2(5, 5, 4, 3);
cellStyle.setFontSize(10);
// Set the first row to use Arial Bold font, with a light grey (eeeeee) background.
ChartDirector.TextBox firstRowStyle = table.getRowStyle(0);
firstRowStyle.setFontStyle("Arial Bold");
firstRowStyle.setBackground(0xeeeeee, Chart.LineColor);
//
// We can add more information to the table. In this sample code, we add the data series
// and the legend icons to the table.
//
// Add 3 more rows to the table. Set the background of the 2nd row to light grey
// (eeeeee).
table.appendRow();
table.appendRow().setBackground(0xeeeeee, Chart.LineColor);
table.appendRow();
// Put the values of the 2 data series in the first 2 rows. Put the percentage
// differences in the 3rd row.
for(int i = 0; i < data0.Length; ++i) {
table.setText(i, 1, (data0[i]).ToString());
table.setText(i, 2, (data1[i]).ToString());
double percentageDiff = 100.0 * (data1[i] - data0[i]) / data0[i];
// Use red or green color depending on whether the difference is positive or
// negative
string formatString = "<*color=008800*>+{value|1}%";
if (percentageDiff < 0) {
formatString = "<*color=cc0000*>{value|1}%";
}
table.setText(i, 3, c.formatValue(percentageDiff, formatString));
}
// Insert a column on the left for the legend icons using Arial Bold font.
table.insertCol(0).setFontStyle("Arial Bold");
// The top cell is set to transparent, so it is invisible
table.getCell(0, 0).setBackground(Chart.Transparent, Chart.Transparent);
// The next 2 cells are set to the legend icons and names of the 2 data series
table.setText(0, 1, layer.getLegendIcon(0) + " FY 2007");
table.setText(0, 2, layer.getLegendIcon(1) + " FY 2008");
// The last cell is set to "Change"
table.setText(0, 3, "Change");
// Append a column on the right for the total values.
table.appendCol();
// Put "Total" in the top cell as the heading of this column
table.setText(table.getColCount() - 1, 0, "Total");
// The next two cells are the total of the data series
double total0 = new ArrayMath(data0).sum();
double total1 = new ArrayMath(data1).sum();
table.setText(table.getColCount() - 1, 1, (total0).ToString());
table.setText(table.getColCount() - 1, 2, (total1).ToString());
// The last cell is the percentage differences of the total
double totalPercentageDiff = (total1 - total0) / total0 * 100;
// Use red or green color depending on whether the difference is positive or negative
string totalFormatString = "<*color=008800*>+{value|1}%";
if (totalPercentageDiff < 0) {
totalFormatString = "<*color=cc0000*>{value|1}%";
}
table.setText(table.getColCount() - 1, 3, c.formatValue(totalPercentageDiff,
totalFormatString));
//
// We now demonstrate how to adjust the plot area positions, to allow space for the
// newly inserted left and right columns in the table.
//
// We layout the axis first in order to get the axis metrics (including table metrics)
c.layoutAxes();
// If the first column is wider than the left y-axis, we need to reserve for some left
// margin to ensure the first column stays within the chart.
int leftMargin = 0;
if (table.getColWidth(0) > c.yAxis().getThickness()) {
leftMargin = table.getColWidth(0) - c.yAxis().getThickness();
}
// Similarly, we need to reserve some right margin for the last column
int rightMargin = table.getColWidth(table.getColCount() - 1);
// Adjust the plot area size, such that the bounding box (inclusive of axes) using the
// given left and right margin, plus 2 more pixels. Put the plot area 10 pixels below
// the title and use 2 pixels as the bottom margin. from the left, right and bottom
// edge, and is just under the legend box.
c.packPlotArea(leftMargin + 2, title.getHeight() + 10, c.getWidth() - 3 - rightMargin,
c.getHeight() - 3);
// After determining the exact plot area position, we may adjust title position so that
// it is centered relative to the plot area (instead of the chart)
title.setPos(plotArea.getLeftX() + (plotArea.getWidth() - title.getWidth()) / 2,
title.getTopY());
// Output the chart
viewer.Chart = c;
//include tool tip for the chart
viewer.ImageMap = c.getHTMLImageMap("clickable", "",
"title='Revenue in {xLabel} {dataSetName}: US$ {value}M'");
}
}
}
[Windows Forms - VB Version] NetWinCharts\VBNetWinCharts\datatable2.vb
Imports System
Imports Microsoft.VisualBasic
Imports ChartDirector

Public Class datatable2
    Implements DemoModule

    'Name of demo module
    Public Function getName() As String Implements DemoModule.getName
        Return "Data Table (2)"
    End Function

    'Number of charts produced in this demo module
    Public Function getNoOfCharts() As Integer Implements DemoModule.getNoOfCharts
        Return 1
    End Function

    'Main code for creating chart.
    'Note: the argument chartIndex is unused because this demo only has 1 chart.
    Public Sub createChart(viewer As WinChartViewer, chartIndex As Integer) _
        Implements DemoModule.createChart

        ' The data for the line chart
        Dim data0() As Double = {410, 420, 500, 590}
        Dim data1() As Double = {500, 370, 680, 850}
        Dim labels() As String = {"Q1", "Q2", "Q3", "Q4"}

        ' Create a XYChart object of size 600 x 400 pixels
        Dim c As XYChart = New XYChart(600, 400)

        ' Add a title to the chart using 18pt Times Bold Italic font
        Dim title As ChartDirector.TextBox = c.addTitle("Product Line Global Revenue", _
            "Times New Roman Bold Italic", 18)

        ' Tentatively set the plotarea at (50, 55) and of (chart_width - 100) x (chart_height - 150)
        ' pixels in size. Use a vertical gradient color from sky blue (aaccff) t0 light blue
        ' (f9f9ff) as background. Set both horizontal and vertical grid lines to dotted
        ' semi-transprent black (aa000000).
        Dim plotArea As PlotArea = c.setPlotArea(50, 55, c.getWidth() - 100, c.getHeight() - 150, _
            c.linearGradientColor(0, 55, 0, 55 + c.getHeight() - 150, &Haaccff, &Hf9fcff), -1, -1, _
            c.dashLineColor(&Haa000000, Chart.DotLine), -1)

        ' Set y-axis title using 12 points Arial Bold Italic font, and set its position 10 pixels
        ' from the axis.
        c.yAxis().setTitle("Revenue (USD millions)", "Arial Bold Italic", 12)
        c.yAxis().setTitlePos(Chart.Left, 10)

        ' Set y-axis label style to 10 points Arial Bold and axis color to transparent
        c.yAxis().setLabelStyle("Arial Bold", 10)
        c.yAxis().setColors(Chart.Transparent)

        ' Set y-axis tick density to 30 pixels. ChartDirector auto-scaling will use this as the
        ' guideline when putting ticks on the y-axis.
        c.yAxis().setTickDensity(30)

        ' Add a bar layer to the chart with side layout
        Dim layer As BarLayer = c.addBarLayer2(Chart.Side)

        ' Add two data sets to the bar layer
        layer.addDataSet(data0, &Hff6600, "FY 2007")
        layer.addDataSet(data1, &H0088ff, "FY 2008")

        ' Use soft lighting effect with light direction from the left
        layer.setBorderColor(Chart.Transparent, Chart.softLighting(Chart.Left))

        ' Set the x axis labels
        c.xAxis().setLabels(labels)

        ' Convert the labels on the x-axis to a CDMLTable
        Dim table As CDMLTable = c.xAxis().makeLabelTable()

        ' Set the default left/right margins to 5 pixels and top/bottom margins to 3 pixels. Set the
        ' default font size to 10 points
        Dim cellStyle As ChartDirector.TextBox = table.getStyle()
        cellStyle.setMargin2(5, 5, 4, 3)
        cellStyle.setFontSize(10)

        ' Set the first row to use Arial Bold font, with a light grey (eeeeee) background.
        Dim firstRowStyle As ChartDirector.TextBox = table.getRowStyle(0)
        firstRowStyle.setFontStyle("Arial Bold")
        firstRowStyle.setBackground(&Heeeeee, Chart.LineColor)

        '
        ' We can add more information to the table. In this sample code, we add the data series and
        ' the legend icons to the table.
        '

        ' Add 3 more rows to the table. Set the background of the 2nd row to light grey (eeeeee).
        table.appendRow()
        table.appendRow().setBackground(&Heeeeee, Chart.LineColor)
        table.appendRow()

        ' Put the values of the 2 data series in the first 2 rows. Put the percentage differences in
        ' the 3rd row.
        For i As Integer = 0 To UBound(data0)
            table.setText(i, 1, CStr(data0(i)))
            table.setText(i, 2, CStr(data1(i)))

            Dim percentageDiff As Double = 100.0 * (data1(i) - data0(i)) / data0(i)

            ' Use red or green color depending on whether the difference is positive or negative
            Dim formatString As String = "<*color=008800*>+{value|1}%"
            If percentageDiff < 0 Then
                formatString = "<*color=cc0000*>{value|1}%"
            End If
            table.setText(i, 3, c.formatValue(percentageDiff, formatString))
        Next

        ' Insert a column on the left for the legend icons using Arial Bold font.
        table.insertCol(0).setFontStyle("Arial Bold")

        ' The top cell is set to transparent, so it is invisible
        table.getCell(0, 0).setBackground(Chart.Transparent, Chart.Transparent)

        ' The next 2 cells are set to the legend icons and names of the 2 data series
        table.setText(0, 1, layer.getLegendIcon(0) & "  FY 2007")
        table.setText(0, 2, layer.getLegendIcon(1) & "  FY 2008")

        ' The last cell is set to "Change"
        table.setText(0, 3, "Change")

        ' Append a column on the right for the total values.
        table.appendCol()

        ' Put "Total" in the top cell as the heading of this column
        table.setText(table.getColCount() - 1, 0, "Total")

        ' The next two cells are the total of the data series
        Dim total0 As Double = New ArrayMath(data0).sum()
        Dim total1 As Double = New ArrayMath(data1).sum()
        table.setText(table.getColCount() - 1, 1, CStr(total0))
        table.setText(table.getColCount() - 1, 2, CStr(total1))

        ' The last cell is the percentage differences of the total
        Dim totalPercentageDiff As Double = (total1 - total0) / total0 * 100

        ' Use red or green color depending on whether the difference is positive or negative
        Dim totalFormatString As String = "<*color=008800*>+{value|1}%"
        If totalPercentageDiff < 0 Then
            totalFormatString = "<*color=cc0000*>{value|1}%"
        End If
        table.setText(table.getColCount() - 1, 3, c.formatValue(totalPercentageDiff, _
            totalFormatString))

        '
        ' We now demonstrate how to adjust the plot area positions, to allow space for the newly
        ' inserted left and right columns in the table.
        '

        ' We layout the axis first in order to get the axis metrics (including table metrics)
        c.layoutAxes()

        ' If the first column is wider than the left y-axis, we need to reserve for some left margin
        ' to ensure the first column stays within the chart.
        Dim leftMargin As Integer = 0
        If table.getColWidth(0) > c.yAxis().getThickness() Then
            leftMargin = table.getColWidth(0) - c.yAxis().getThickness()
        End If

        ' Similarly, we need to reserve some right margin for the last column
        Dim rightMargin As Integer = table.getColWidth(table.getColCount() - 1)

        ' Adjust the plot area size, such that the bounding box (inclusive of axes) using the given
        ' left and right margin, plus 2 more pixels. Put the plot area 10 pixels below the title and
        ' use 2 pixels as the bottom margin. from the left, right and bottom edge, and is just under
        ' the legend box.
        c.packPlotArea(leftMargin + 2, title.getHeight() + 10, c.getWidth() - 3 - rightMargin, _
            c.getHeight() - 3)

        ' After determining the exact plot area position, we may adjust title position so that it is
        ' centered relative to the plot area (instead of the chart)
        title.setPos(plotArea.getLeftX() + (plotArea.getWidth() - title.getWidth()) / 2, _
            title.getTopY())

        ' Output the chart
        viewer.Chart = c

        'include tool tip for the chart
        viewer.ImageMap = c.getHTMLImageMap("clickable", "", _
            "title='Revenue in {xLabel} {dataSetName}: US$ {value}M'")

    End Sub

End Class
[WPF - C#] NetWPFCharts\CSharpWPFCharts\datatable2.cs
using System;
using ChartDirector;

namespace CSharpWPFCharts
{
    public class datatable2 : DemoModule
    {
        //Name of demo module
        public string getName() { return "Data Table (2)"; }

        //Number of charts produced in this demo module
        public int getNoOfCharts() { return 1; }

        //Main code for creating chart.
        //Note: the argument chartIndex is unused because this demo only has 1 chart.
        public void createChart(WPFChartViewer viewer, int chartIndex)
        {
            // The data for the line chart
            double[] data0 = {410, 420, 500, 590};
            double[] data1 = {500, 370, 680, 850};
            string[] labels = {"Q1", "Q2", "Q3", "Q4"};

            // Create a XYChart object of size 600 x 400 pixels
            XYChart c = new XYChart(600, 400);

            // Add a title to the chart using 18pt Times Bold Italic font
            ChartDirector.TextBox title = c.addTitle("Product Line Global Revenue",
                "Times New Roman Bold Italic", 18);

            // Tentatively set the plotarea at (50, 55) and of (chart_width - 100) x (chart_height -
            // 150) pixels in size. Use a vertical gradient color from sky blue (aaccff) t0 light
            // blue (f9f9ff) as background. Set both horizontal and vertical grid lines to dotted
            // semi-transprent black (aa000000).
            PlotArea plotArea = c.setPlotArea(50, 55, c.getWidth() - 100, c.getHeight() - 150,
                c.linearGradientColor(0, 55, 0, 55 + c.getHeight() - 150, 0xaaccff, 0xf9fcff), -1,
                -1, c.dashLineColor(unchecked((int)0xaa000000), Chart.DotLine), -1);

            // Set y-axis title using 12 points Arial Bold Italic font, and set its position 10
            // pixels from the axis.
            c.yAxis().setTitle("Revenue (USD millions)", "Arial Bold Italic", 12);
            c.yAxis().setTitlePos(Chart.Left, 10);

            // Set y-axis label style to 10 points Arial Bold and axis color to transparent
            c.yAxis().setLabelStyle("Arial Bold", 10);
            c.yAxis().setColors(Chart.Transparent);

            // Set y-axis tick density to 30 pixels. ChartDirector auto-scaling will use this as the
            // guideline when putting ticks on the y-axis.
            c.yAxis().setTickDensity(30);

            // Add a bar layer to the chart with side layout
            BarLayer layer = c.addBarLayer2(Chart.Side);

            // Add two data sets to the bar layer
            layer.addDataSet(data0, 0xff6600, "FY 2007");
            layer.addDataSet(data1, 0x0088ff, "FY 2008");

            // Use soft lighting effect with light direction from the left
            layer.setBorderColor(Chart.Transparent, Chart.softLighting(Chart.Left));

            // Set the x axis labels
            c.xAxis().setLabels(labels);

            // Convert the labels on the x-axis to a CDMLTable
            CDMLTable table = c.xAxis().makeLabelTable();

            // Set the default left/right margins to 5 pixels and top/bottom margins to 3 pixels.
            // Set the default font size to 10 points
            ChartDirector.TextBox cellStyle = table.getStyle();
            cellStyle.setMargin2(5, 5, 4, 3);
            cellStyle.setFontSize(10);

            // Set the first row to use Arial Bold font, with a light grey (eeeeee) background.
            ChartDirector.TextBox firstRowStyle = table.getRowStyle(0);
            firstRowStyle.setFontStyle("Arial Bold");
            firstRowStyle.setBackground(0xeeeeee, Chart.LineColor);

            //
            // We can add more information to the table. In this sample code, we add the data series
            // and the legend icons to the table.
            //

            // Add 3 more rows to the table. Set the background of the 2nd row to light grey
            // (eeeeee).
            table.appendRow();
            table.appendRow().setBackground(0xeeeeee, Chart.LineColor);
            table.appendRow();

            // Put the values of the 2 data series in the first 2 rows. Put the percentage
            // differences in the 3rd row.
            for(int i = 0; i < data0.Length; ++i) {
                table.setText(i, 1, (data0[i]).ToString());
                table.setText(i, 2, (data1[i]).ToString());

                double percentageDiff = 100.0 * (data1[i] - data0[i]) / data0[i];

                // Use red or green color depending on whether the difference is positive or
                // negative
                string formatString = "<*color=008800*>+{value|1}%";
                if (percentageDiff < 0) {
                    formatString = "<*color=cc0000*>{value|1}%";
                }
                table.setText(i, 3, c.formatValue(percentageDiff, formatString));
            }

            // Insert a column on the left for the legend icons using Arial Bold font.
            table.insertCol(0).setFontStyle("Arial Bold");

            // The top cell is set to transparent, so it is invisible
            table.getCell(0, 0).setBackground(Chart.Transparent, Chart.Transparent);

            // The next 2 cells are set to the legend icons and names of the 2 data series
            table.setText(0, 1, layer.getLegendIcon(0) + "  FY 2007");
            table.setText(0, 2, layer.getLegendIcon(1) + "  FY 2008");

            // The last cell is set to "Change"
            table.setText(0, 3, "Change");

            // Append a column on the right for the total values.
            table.appendCol();

            // Put "Total" in the top cell as the heading of this column
            table.setText(table.getColCount() - 1, 0, "Total");

            // The next two cells are the total of the data series
            double total0 = new ArrayMath(data0).sum();
            double total1 = new ArrayMath(data1).sum();
            table.setText(table.getColCount() - 1, 1, (total0).ToString());
            table.setText(table.getColCount() - 1, 2, (total1).ToString());

            // The last cell is the percentage differences of the total
            double totalPercentageDiff = (total1 - total0) / total0 * 100;

            // Use red or green color depending on whether the difference is positive or negative
            string totalFormatString = "<*color=008800*>+{value|1}%";
            if (totalPercentageDiff < 0) {
                totalFormatString = "<*color=cc0000*>{value|1}%";
            }
            table.setText(table.getColCount() - 1, 3, c.formatValue(totalPercentageDiff,
                totalFormatString));

            //
            // We now demonstrate how to adjust the plot area positions, to allow space for the
            // newly inserted left and right columns in the table.
            //

            // We layout the axis first in order to get the axis metrics (including table metrics)
            c.layoutAxes();

            // If the first column is wider than the left y-axis, we need to reserve for some left
            // margin to ensure the first column stays within the chart.
            int leftMargin = 0;
            if (table.getColWidth(0) > c.yAxis().getThickness()) {
                leftMargin = table.getColWidth(0) - c.yAxis().getThickness();
            }

            // Similarly, we need to reserve some right margin for the last column
            int rightMargin = table.getColWidth(table.getColCount() - 1);

            // Adjust the plot area size, such that the bounding box (inclusive of axes) using the
            // given left and right margin, plus 2 more pixels. Put the plot area 10 pixels below
            // the title and use 2 pixels as the bottom margin. from the left, right and bottom
            // edge, and is just under the legend box.
            c.packPlotArea(leftMargin + 2, title.getHeight() + 10, c.getWidth() - 3 - rightMargin,
                c.getHeight() - 3);

            // After determining the exact plot area position, we may adjust title position so that
            // it is centered relative to the plot area (instead of the chart)
            title.setPos(plotArea.getLeftX() + (plotArea.getWidth() - title.getWidth()) / 2,
                title.getTopY());

            // Output the chart
            viewer.Chart = c;

            //include tool tip for the chart
            viewer.ImageMap = c.getHTMLImageMap("clickable", "",
                "title='Revenue in {xLabel} {dataSetName}: US$ {value}M'");
        }
    }
}
[ASP.NET Web Forms - C# version] NetWebCharts\CSharpASP\datatable2.aspx
(Click here on how to convert this code to code-behind style.)<%@ Page Language="C#" Debug="true" %>
<%@ Import Namespace="ChartDirector" %>
<%@ Register TagPrefix="chart" Namespace="ChartDirector" Assembly="netchartdir" %>
<!DOCTYPE html>
<script runat="server">
//
// Page Load event handler
//
protected void Page_Load(object sender, EventArgs e)
{
// The data for the line chart
double[] data0 = {410, 420, 500, 590};
double[] data1 = {500, 370, 680, 850};
string[] labels = {"Q1", "Q2", "Q3", "Q4"};
// Create a XYChart object of size 600 x 400 pixels
XYChart c = new XYChart(600, 400);
// Add a title to the chart using 18pt Times Bold Italic font
ChartDirector.TextBox title = c.addTitle("Product Line Global Revenue",
"Times New Roman Bold Italic", 18);
// Tentatively set the plotarea at (50, 55) and of (chart_width - 100) x (chart_height - 150)
// pixels in size. Use a vertical gradient color from sky blue (aaccff) t0 light blue (f9f9ff)
// as background. Set both horizontal and vertical grid lines to dotted semi-transprent black
// (aa000000).
PlotArea plotArea = c.setPlotArea(50, 55, c.getWidth() - 100, c.getHeight() - 150,
c.linearGradientColor(0, 55, 0, 55 + c.getHeight() - 150, 0xaaccff, 0xf9fcff), -1, -1,
c.dashLineColor(unchecked((int)0xaa000000), Chart.DotLine), -1);
// Set y-axis title using 12 points Arial Bold Italic font, and set its position 10 pixels from
// the axis.
c.yAxis().setTitle("Revenue (USD millions)", "Arial Bold Italic", 12);
c.yAxis().setTitlePos(Chart.Left, 10);
// Set y-axis label style to 10 points Arial Bold and axis color to transparent
c.yAxis().setLabelStyle("Arial Bold", 10);
c.yAxis().setColors(Chart.Transparent);
// Set y-axis tick density to 30 pixels. ChartDirector auto-scaling will use this as the
// guideline when putting ticks on the y-axis.
c.yAxis().setTickDensity(30);
// Add a bar layer to the chart with side layout
BarLayer layer = c.addBarLayer2(Chart.Side);
// Add two data sets to the bar layer
layer.addDataSet(data0, 0xff6600, "FY 2007");
layer.addDataSet(data1, 0x0088ff, "FY 2008");
// Use soft lighting effect with light direction from the left
layer.setBorderColor(Chart.Transparent, Chart.softLighting(Chart.Left));
// Set the x axis labels
c.xAxis().setLabels(labels);
// Convert the labels on the x-axis to a CDMLTable
CDMLTable table = c.xAxis().makeLabelTable();
// Set the default left/right margins to 5 pixels and top/bottom margins to 3 pixels. Set the
// default font size to 10 points
ChartDirector.TextBox cellStyle = table.getStyle();
cellStyle.setMargin2(5, 5, 4, 3);
cellStyle.setFontSize(10);
// Set the first row to use Arial Bold font, with a light grey (eeeeee) background.
ChartDirector.TextBox firstRowStyle = table.getRowStyle(0);
firstRowStyle.setFontStyle("Arial Bold");
firstRowStyle.setBackground(0xeeeeee, Chart.LineColor);
//
// We can add more information to the table. In this sample code, we add the data series and the
// legend icons to the table.
//
// Add 3 more rows to the table. Set the background of the 2nd row to light grey (eeeeee).
table.appendRow();
table.appendRow().setBackground(0xeeeeee, Chart.LineColor);
table.appendRow();
// Put the values of the 2 data series in the first 2 rows. Put the percentage differences in
// the 3rd row.
for(int i = 0; i < data0.Length; ++i) {
table.setText(i, 1, (data0[i]).ToString());
table.setText(i, 2, (data1[i]).ToString());
double percentageDiff = 100.0 * (data1[i] - data0[i]) / data0[i];
// Use red or green color depending on whether the difference is positive or negative
string formatString = "<*color=008800*>+{value|1}%";
if (percentageDiff < 0) {
formatString = "<*color=cc0000*>{value|1}%";
}
table.setText(i, 3, c.formatValue(percentageDiff, formatString));
}
// Insert a column on the left for the legend icons using Arial Bold font.
table.insertCol(0).setFontStyle("Arial Bold");
// The top cell is set to transparent, so it is invisible
table.getCell(0, 0).setBackground(Chart.Transparent, Chart.Transparent);
// The next 2 cells are set to the legend icons and names of the 2 data series
table.setText(0, 1, layer.getLegendIcon(0) + " FY 2007");
table.setText(0, 2, layer.getLegendIcon(1) + " FY 2008");
// The last cell is set to "Change"
table.setText(0, 3, "Change");
// Append a column on the right for the total values.
table.appendCol();
// Put "Total" in the top cell as the heading of this column
table.setText(table.getColCount() - 1, 0, "Total");
// The next two cells are the total of the data series
double total0 = new ArrayMath(data0).sum();
double total1 = new ArrayMath(data1).sum();
table.setText(table.getColCount() - 1, 1, (total0).ToString());
table.setText(table.getColCount() - 1, 2, (total1).ToString());
// The last cell is the percentage differences of the total
double totalPercentageDiff = (total1 - total0) / total0 * 100;
// Use red or green color depending on whether the difference is positive or negative
string totalFormatString = "<*color=008800*>+{value|1}%";
if (totalPercentageDiff < 0) {
totalFormatString = "<*color=cc0000*>{value|1}%";
}
table.setText(table.getColCount() - 1, 3, c.formatValue(totalPercentageDiff, totalFormatString))
;
//
// We now demonstrate how to adjust the plot area positions, to allow space for the newly
// inserted left and right columns in the table.
//
// We layout the axis first in order to get the axis metrics (including table metrics)
c.layoutAxes();
// If the first column is wider than the left y-axis, we need to reserve for some left margin to
// ensure the first column stays within the chart.
int leftMargin = 0;
if (table.getColWidth(0) > c.yAxis().getThickness()) {
leftMargin = table.getColWidth(0) - c.yAxis().getThickness();
}
// Similarly, we need to reserve some right margin for the last column
int rightMargin = table.getColWidth(table.getColCount() - 1);
// Adjust the plot area size, such that the bounding box (inclusive of axes) using the given
// left and right margin, plus 2 more pixels. Put the plot area 10 pixels below the title and
// use 2 pixels as the bottom margin. from the left, right and bottom edge, and is just under
// the legend box.
c.packPlotArea(leftMargin + 2, title.getHeight() + 10, c.getWidth() - 3 - rightMargin,
c.getHeight() - 3);
// After determining the exact plot area position, we may adjust title position so that it is
// centered relative to the plot area (instead of the chart)
title.setPos(plotArea.getLeftX() + (plotArea.getWidth() - title.getWidth()) / 2, title.getTopY()
);
// Output the chart
WebChartViewer1.Image = c.makeWebImage(Chart.SVG);
// Include tool tip for the chart
WebChartViewer1.ImageMap = c.getHTMLImageMap("", "",
"title='Revenue in {xLabel} {dataSetName}: US$ {value}M'");
}
</script>
<html>
<head>
<script type="text/javascript" src="cdjcv.js"></script>
</head>
<body>
<chart:WebChartViewer id="WebChartViewer1" runat="server" />
</body>
</html>
[ASP.NET Web Forms - VB Version] NetWebCharts\VBNetASP\datatable2.aspx
(Click here on how to convert this code to code-behind style.)<%@ Page Language="VB" Debug="true" %>
<%@ Import Namespace="ChartDirector" %>
<%@ Register TagPrefix="chart" Namespace="ChartDirector" Assembly="netchartdir" %>
<!DOCTYPE html>
<script runat="server">
'
' Page Load event handler
'
Protected Sub Page_Load(ByVal sender As System.Object, ByVal e As System.EventArgs)
' The data for the line chart
Dim data0() As Double = {410, 420, 500, 590}
Dim data1() As Double = {500, 370, 680, 850}
Dim labels() As String = {"Q1", "Q2", "Q3", "Q4"}
' Create a XYChart object of size 600 x 400 pixels
Dim c As XYChart = New XYChart(600, 400)
' Add a title to the chart using 18pt Times Bold Italic font
Dim title As ChartDirector.TextBox = c.addTitle("Product Line Global Revenue", _
"Times New Roman Bold Italic", 18)
' Tentatively set the plotarea at (50, 55) and of (chart_width - 100) x (chart_height - 150)
' pixels in size. Use a vertical gradient color from sky blue (aaccff) t0 light blue (f9f9ff) as
' background. Set both horizontal and vertical grid lines to dotted semi-transprent black
' (aa000000).
Dim plotArea As PlotArea = c.setPlotArea(50, 55, c.getWidth() - 100, c.getHeight() - 150, _
c.linearGradientColor(0, 55, 0, 55 + c.getHeight() - 150, &Haaccff, &Hf9fcff), -1, -1, _
c.dashLineColor(&Haa000000, Chart.DotLine), -1)
' Set y-axis title using 12 points Arial Bold Italic font, and set its position 10 pixels from
' the axis.
c.yAxis().setTitle("Revenue (USD millions)", "Arial Bold Italic", 12)
c.yAxis().setTitlePos(Chart.Left, 10)
' Set y-axis label style to 10 points Arial Bold and axis color to transparent
c.yAxis().setLabelStyle("Arial Bold", 10)
c.yAxis().setColors(Chart.Transparent)
' Set y-axis tick density to 30 pixels. ChartDirector auto-scaling will use this as the
' guideline when putting ticks on the y-axis.
c.yAxis().setTickDensity(30)
' Add a bar layer to the chart with side layout
Dim layer As BarLayer = c.addBarLayer2(Chart.Side)
' Add two data sets to the bar layer
layer.addDataSet(data0, &Hff6600, "FY 2007")
layer.addDataSet(data1, &H0088ff, "FY 2008")
' Use soft lighting effect with light direction from the left
layer.setBorderColor(Chart.Transparent, Chart.softLighting(Chart.Left))
' Set the x axis labels
c.xAxis().setLabels(labels)
' Convert the labels on the x-axis to a CDMLTable
Dim table As CDMLTable = c.xAxis().makeLabelTable()
' Set the default left/right margins to 5 pixels and top/bottom margins to 3 pixels. Set the
' default font size to 10 points
Dim cellStyle As ChartDirector.TextBox = table.getStyle()
cellStyle.setMargin2(5, 5, 4, 3)
cellStyle.setFontSize(10)
' Set the first row to use Arial Bold font, with a light grey (eeeeee) background.
Dim firstRowStyle As ChartDirector.TextBox = table.getRowStyle(0)
firstRowStyle.setFontStyle("Arial Bold")
firstRowStyle.setBackground(&Heeeeee, Chart.LineColor)
'
' We can add more information to the table. In this sample code, we add the data series and the
' legend icons to the table.
'
' Add 3 more rows to the table. Set the background of the 2nd row to light grey (eeeeee).
table.appendRow()
table.appendRow().setBackground(&Heeeeee, Chart.LineColor)
table.appendRow()
' Put the values of the 2 data series in the first 2 rows. Put the percentage differences in the
' 3rd row.
For i As Integer = 0 To UBound(data0)
table.setText(i, 1, CStr(data0(i)))
table.setText(i, 2, CStr(data1(i)))
Dim percentageDiff As Double = 100.0 * (data1(i) - data0(i)) / data0(i)
' Use red or green color depending on whether the difference is positive or negative
Dim formatString As String = "<*color=008800*>+{value|1}%"
If percentageDiff < 0 Then
formatString = "<*color=cc0000*>{value|1}%"
End If
table.setText(i, 3, c.formatValue(percentageDiff, formatString))
Next
' Insert a column on the left for the legend icons using Arial Bold font.
table.insertCol(0).setFontStyle("Arial Bold")
' The top cell is set to transparent, so it is invisible
table.getCell(0, 0).setBackground(Chart.Transparent, Chart.Transparent)
' The next 2 cells are set to the legend icons and names of the 2 data series
table.setText(0, 1, layer.getLegendIcon(0) & " FY 2007")
table.setText(0, 2, layer.getLegendIcon(1) & " FY 2008")
' The last cell is set to "Change"
table.setText(0, 3, "Change")
' Append a column on the right for the total values.
table.appendCol()
' Put "Total" in the top cell as the heading of this column
table.setText(table.getColCount() - 1, 0, "Total")
' The next two cells are the total of the data series
Dim total0 As Double = New ArrayMath(data0).sum()
Dim total1 As Double = New ArrayMath(data1).sum()
table.setText(table.getColCount() - 1, 1, CStr(total0))
table.setText(table.getColCount() - 1, 2, CStr(total1))
' The last cell is the percentage differences of the total
Dim totalPercentageDiff As Double = (total1 - total0) / total0 * 100
' Use red or green color depending on whether the difference is positive or negative
Dim totalFormatString As String = "<*color=008800*>+{value|1}%"
If totalPercentageDiff < 0 Then
totalFormatString = "<*color=cc0000*>{value|1}%"
End If
table.setText(table.getColCount() - 1, 3, c.formatValue(totalPercentageDiff, totalFormatString))
'
' We now demonstrate how to adjust the plot area positions, to allow space for the newly
' inserted left and right columns in the table.
'
' We layout the axis first in order to get the axis metrics (including table metrics)
c.layoutAxes()
' If the first column is wider than the left y-axis, we need to reserve for some left margin to
' ensure the first column stays within the chart.
Dim leftMargin As Integer = 0
If table.getColWidth(0) > c.yAxis().getThickness() Then
leftMargin = table.getColWidth(0) - c.yAxis().getThickness()
End If
' Similarly, we need to reserve some right margin for the last column
Dim rightMargin As Integer = table.getColWidth(table.getColCount() - 1)
' Adjust the plot area size, such that the bounding box (inclusive of axes) using the given left
' and right margin, plus 2 more pixels. Put the plot area 10 pixels below the title and use 2
' pixels as the bottom margin. from the left, right and bottom edge, and is just under the
' legend box.
c.packPlotArea(leftMargin + 2, title.getHeight() + 10, c.getWidth() - 3 - rightMargin, _
c.getHeight() - 3)
' After determining the exact plot area position, we may adjust title position so that it is
' centered relative to the plot area (instead of the chart)
title.setPos(plotArea.getLeftX() + (plotArea.getWidth() - title.getWidth()) / 2, _
title.getTopY())
' Output the chart
WebChartViewer1.Image = c.makeWebImage(Chart.SVG)
' Include tool tip for the chart
WebChartViewer1.ImageMap = c.getHTMLImageMap("", "", _
"title='Revenue in {xLabel} {dataSetName}: US$ {value}M'")
End Sub
</script>
<html>
<head>
<script type="text/javascript" src="cdjcv.js"></script>
</head>
<body>
<chart:WebChartViewer id="WebChartViewer1" runat="server" />
</body>
</html>
[ASP.NET MVC - Controller] NetMvcCharts\Controllers\Datatable2Controller.cs
using System;
using System.Web.Mvc;
using ChartDirector;

namespace NetMvcCharts.Controllers
{
    public class Datatable2Controller : Controller
    {
        //
        // Default Action
        //
        public ActionResult Index()
        {
            ViewBag.Title = "Data Table (2)";
            createChart(ViewBag.Viewer = new RazorChartViewer(HttpContext, "chart1"));
            return View("~/Views/Shared/ChartView.cshtml");
        }

        //
        // Create chart
        //
        private void createChart(RazorChartViewer viewer)
        {
            // The data for the line chart
            double[] data0 = {410, 420, 500, 590};
            double[] data1 = {500, 370, 680, 850};
            string[] labels = {"Q1", "Q2", "Q3", "Q4"};

            // Create a XYChart object of size 600 x 400 pixels
            XYChart c = new XYChart(600, 400);

            // Add a title to the chart using 18pt Times Bold Italic font
            ChartDirector.TextBox title = c.addTitle("Product Line Global Revenue",
                "Times New Roman Bold Italic", 18);

            // Tentatively set the plotarea at (50, 55) and of (chart_width - 100) x (chart_height - 150)
            // pixels in size. Use a vertical gradient color from sky blue (aaccff) t0 light blue
            // (f9f9ff) as background. Set both horizontal and vertical grid lines to dotted
            // semi-transprent black (aa000000).
            PlotArea plotArea = c.setPlotArea(50, 55, c.getWidth() - 100, c.getHeight() - 150,
                c.linearGradientColor(0, 55, 0, 55 + c.getHeight() - 150, 0xaaccff, 0xf9fcff), -1, -1,
                c.dashLineColor(unchecked((int)0xaa000000), Chart.DotLine), -1);

            // Set y-axis title using 12 points Arial Bold Italic font, and set its position 10 pixels
            // from the axis.
            c.yAxis().setTitle("Revenue (USD millions)", "Arial Bold Italic", 12);
            c.yAxis().setTitlePos(Chart.Left, 10);

            // Set y-axis label style to 10 points Arial Bold and axis color to transparent
            c.yAxis().setLabelStyle("Arial Bold", 10);
            c.yAxis().setColors(Chart.Transparent);

            // Set y-axis tick density to 30 pixels. ChartDirector auto-scaling will use this as the
            // guideline when putting ticks on the y-axis.
            c.yAxis().setTickDensity(30);

            // Add a bar layer to the chart with side layout
            BarLayer layer = c.addBarLayer2(Chart.Side);

            // Add two data sets to the bar layer
            layer.addDataSet(data0, 0xff6600, "FY 2007");
            layer.addDataSet(data1, 0x0088ff, "FY 2008");

            // Use soft lighting effect with light direction from the left
            layer.setBorderColor(Chart.Transparent, Chart.softLighting(Chart.Left));

            // Set the x axis labels
            c.xAxis().setLabels(labels);

            // Convert the labels on the x-axis to a CDMLTable
            CDMLTable table = c.xAxis().makeLabelTable();

            // Set the default left/right margins to 5 pixels and top/bottom margins to 3 pixels. Set the
            // default font size to 10 points
            ChartDirector.TextBox cellStyle = table.getStyle();
            cellStyle.setMargin2(5, 5, 4, 3);
            cellStyle.setFontSize(10);

            // Set the first row to use Arial Bold font, with a light grey (eeeeee) background.
            ChartDirector.TextBox firstRowStyle = table.getRowStyle(0);
            firstRowStyle.setFontStyle("Arial Bold");
            firstRowStyle.setBackground(0xeeeeee, Chart.LineColor);

            //
            // We can add more information to the table. In this sample code, we add the data series and
            // the legend icons to the table.
            //

            // Add 3 more rows to the table. Set the background of the 2nd row to light grey (eeeeee).
            table.appendRow();
            table.appendRow().setBackground(0xeeeeee, Chart.LineColor);
            table.appendRow();

            // Put the values of the 2 data series in the first 2 rows. Put the percentage differences in
            // the 3rd row.
            for(int i = 0; i < data0.Length; ++i) {
                table.setText(i, 1, (data0[i]).ToString());
                table.setText(i, 2, (data1[i]).ToString());

                double percentageDiff = 100.0 * (data1[i] - data0[i]) / data0[i];

                // Use red or green color depending on whether the difference is positive or negative
                string formatString = "<*color=008800*>+{value|1}%";
                if (percentageDiff < 0) {
                    formatString = "<*color=cc0000*>{value|1}%";
                }
                table.setText(i, 3, c.formatValue(percentageDiff, formatString));
            }

            // Insert a column on the left for the legend icons using Arial Bold font.
            table.insertCol(0).setFontStyle("Arial Bold");

            // The top cell is set to transparent, so it is invisible
            table.getCell(0, 0).setBackground(Chart.Transparent, Chart.Transparent);

            // The next 2 cells are set to the legend icons and names of the 2 data series
            table.setText(0, 1, layer.getLegendIcon(0) + "  FY 2007");
            table.setText(0, 2, layer.getLegendIcon(1) + "  FY 2008");

            // The last cell is set to "Change"
            table.setText(0, 3, "Change");

            // Append a column on the right for the total values.
            table.appendCol();

            // Put "Total" in the top cell as the heading of this column
            table.setText(table.getColCount() - 1, 0, "Total");

            // The next two cells are the total of the data series
            double total0 = new ArrayMath(data0).sum();
            double total1 = new ArrayMath(data1).sum();
            table.setText(table.getColCount() - 1, 1, (total0).ToString());
            table.setText(table.getColCount() - 1, 2, (total1).ToString());

            // The last cell is the percentage differences of the total
            double totalPercentageDiff = (total1 - total0) / total0 * 100;

            // Use red or green color depending on whether the difference is positive or negative
            string totalFormatString = "<*color=008800*>+{value|1}%";
            if (totalPercentageDiff < 0) {
                totalFormatString = "<*color=cc0000*>{value|1}%";
            }
            table.setText(table.getColCount() - 1, 3, c.formatValue(totalPercentageDiff,
                totalFormatString));

            //
            // We now demonstrate how to adjust the plot area positions, to allow space for the newly
            // inserted left and right columns in the table.
            //

            // We layout the axis first in order to get the axis metrics (including table metrics)
            c.layoutAxes();

            // If the first column is wider than the left y-axis, we need to reserve for some left margin
            // to ensure the first column stays within the chart.
            int leftMargin = 0;
            if (table.getColWidth(0) > c.yAxis().getThickness()) {
                leftMargin = table.getColWidth(0) - c.yAxis().getThickness();
            }

            // Similarly, we need to reserve some right margin for the last column
            int rightMargin = table.getColWidth(table.getColCount() - 1);

            // Adjust the plot area size, such that the bounding box (inclusive of axes) using the given
            // left and right margin, plus 2 more pixels. Put the plot area 10 pixels below the title and
            // use 2 pixels as the bottom margin. from the left, right and bottom edge, and is just under
            // the legend box.
            c.packPlotArea(leftMargin + 2, title.getHeight() + 10, c.getWidth() - 3 - rightMargin,
                c.getHeight() - 3);

            // After determining the exact plot area position, we may adjust title position so that it is
            // centered relative to the plot area (instead of the chart)
            title.setPos(plotArea.getLeftX() + (plotArea.getWidth() - title.getWidth()) / 2,
                title.getTopY());

            // Output the chart
            viewer.Image = c.makeWebImage(Chart.SVG);

            // Include tool tip for the chart
            viewer.ImageMap = c.getHTMLImageMap("", "",
                "title='Revenue in {xLabel} {dataSetName}: US$ {value}M'");
        }
    }
}
[ASP.NET MVC - View] NetMvcCharts\Views\Shared\ChartView.cshtml
@{ Layout = null; }

<!DOCTYPE html>

<html>
<head>
    <meta name="viewport" content="width=device-width" />
    <title>@ViewBag.Title</title>
    <style>
        @ViewBag.Style
    </style>
    @Scripts.Render("~/Scripts/cdjcv.js")
</head>
<body style="margin:5px 0px 0px 5px">
    <div style="font:bold 18pt verdana;">
        @ViewBag.Title
    </div>
    <hr style="border:solid 1px #000080; background:#000080" />
    <div>
        @{
            if (ViewBag.Viewer is Array)
            {
                // Display multiple charts
                for (int i = 0; i < ViewBag.Viewer.Length; ++i)
                {
                    @:@Html.Raw(ViewBag.Viewer[i].RenderHTML())
                }
            }
            else
            {
                // Display one chart only
                @:@Html.Raw(ViewBag.Viewer.RenderHTML())
            }
        }
    </div>
</body>
</html>
© 2023 Advanced Software Engineering Limited. All rights reserved.