[Windows Forms - C# version] NetWinCharts\CSharpWinCharts\dualyaxis.cs
using System;
using ChartDirector;
namespace CSharpChartExplorer
{
public class dualyaxis : DemoModule
{
//Name of demo module
public string getName() { return "Dual Y-Axis"; }
//Number of charts produced in this demo module
public int getNoOfCharts() { return 1; }
//Main code for creating chart.
//Note: the argument chartIndex is unused because this demo only has 1 chart.
public void createChart(WinChartViewer viewer, int chartIndex)
{
// The data for the chart
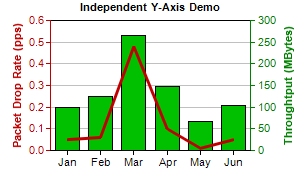
double[] data0 = {0.05, 0.06, 0.48, 0.1, 0.01, 0.05};
double[] data1 = {100, 125, 265, 147, 67, 105};
string[] labels = {"Jan", "Feb", "Mar", "Apr", "May", "Jun"};
// Create a XYChart object of size 300 x 180 pixels
XYChart c = new XYChart(300, 180);
// Set the plot area at (50, 20) and of size 200 x 130 pixels
c.setPlotArea(50, 20, 200, 130);
// Add a title to the chart using 8pt Arial Bold font
c.addTitle("Independent Y-Axis Demo", "Arial Bold", 8);
// Set the labels on the x axis.
c.xAxis().setLabels(labels);
// Add a title to the primary (left) y axis
c.yAxis().setTitle("Packet Drop Rate (pps)");
// Set the axis, label and title colors for the primary y axis to red (0xc00000) to
// match the first data set
c.yAxis().setColors(0xc00000, 0xc00000, 0xc00000);
// Add a title to the secondary (right) y axis
c.yAxis2().setTitle("Throughtput (MBytes)");
// set the axis, label and title colors for the primary y axis to green (0x008000) to
// match the second data set
c.yAxis2().setColors(0x008000, 0x008000, 0x008000);
// Add a line layer to for the first data set using red (0xc00000) color with a line
// width to 3 pixels
LineLayer lineLayer = c.addLineLayer(data0, 0xc00000);
lineLayer.setLineWidth(3);
// tool tip for the line layer
lineLayer.setHTMLImageMap("", "", "title='Packet Drop Rate on {xLabel}: {value} pps'");
// Add a bar layer to for the second data set using green (0x00C000) color. Bind the
// second data set to the secondary (right) y axis
BarLayer barLayer = c.addBarLayer(data1, 0x00c000);
barLayer.setUseYAxis2();
// tool tip for the bar layer
barLayer.setHTMLImageMap("", "", "title='Throughput on {xLabel}: {value} MBytes'");
// Output the chart
viewer.Chart = c;
// include tool tip for the chart
viewer.ImageMap = c.getHTMLImageMap("clickable");
}
}
}
[Windows Forms - VB Version] NetWinCharts\VBNetWinCharts\dualyaxis.vb
Imports System
Imports Microsoft.VisualBasic
Imports ChartDirector

Public Class dualyaxis
    Implements DemoModule

    'Name of demo module
    Public Function getName() As String Implements DemoModule.getName
        Return "Dual Y-Axis"
    End Function

    'Number of charts produced in this demo module
    Public Function getNoOfCharts() As Integer Implements DemoModule.getNoOfCharts
        Return 1
    End Function

    'Main code for creating chart.
    'Note: the argument chartIndex is unused because this demo only has 1 chart.
    Public Sub createChart(viewer As WinChartViewer, chartIndex As Integer) _
        Implements DemoModule.createChart

        ' The data for the chart
        Dim data0() As Double = {0.05, 0.06, 0.48, 0.1, 0.01, 0.05}
        Dim data1() As Double = {100, 125, 265, 147, 67, 105}
        Dim labels() As String = {"Jan", "Feb", "Mar", "Apr", "May", "Jun"}

        ' Create a XYChart object of size 300 x 180 pixels
        Dim c As XYChart = New XYChart(300, 180)

        ' Set the plot area at (50, 20) and of size 200 x 130 pixels
        c.setPlotArea(50, 20, 200, 130)

        ' Add a title to the chart using 8pt Arial Bold font
        c.addTitle("Independent Y-Axis Demo", "Arial Bold", 8)

        ' Set the labels on the x axis.
        c.xAxis().setLabels(labels)

        ' Add a title to the primary (left) y axis
        c.yAxis().setTitle("Packet Drop Rate (pps)")

        ' Set the axis, label and title colors for the primary y axis to red (0xc00000) to match the
        ' first data set
        c.yAxis().setColors(&Hc00000, &Hc00000, &Hc00000)

        ' Add a title to the secondary (right) y axis
        c.yAxis2().setTitle("Throughtput (MBytes)")

        ' set the axis, label and title colors for the primary y axis to green (0x008000) to match
        ' the second data set
        c.yAxis2().setColors(&H008000, &H008000, &H008000)

        ' Add a line layer to for the first data set using red (0xc00000) color with a line width to
        ' 3 pixels
        Dim lineLayer As LineLayer = c.addLineLayer(data0, &Hc00000)
        lineLayer.setLineWidth(3)

        ' tool tip for the line layer
        lineLayer.setHTMLImageMap("", "", "title='Packet Drop Rate on {xLabel}: {value} pps'")

        ' Add a bar layer to for the second data set using green (0x00C000) color. Bind the second
        ' data set to the secondary (right) y axis
        Dim barLayer As BarLayer = c.addBarLayer(data1, &H00c000)
        barLayer.setUseYAxis2()

        ' tool tip for the bar layer
        barLayer.setHTMLImageMap("", "", "title='Throughput on {xLabel}: {value} MBytes'")

        ' Output the chart
        viewer.Chart = c

        ' include tool tip for the chart
        viewer.ImageMap = c.getHTMLImageMap("clickable")

    End Sub

End Class
[WPF - C#] NetWPFCharts\CSharpWPFCharts\dualyaxis.cs
using System;
using ChartDirector;

namespace CSharpWPFCharts
{
    public class dualyaxis : DemoModule
    {
        //Name of demo module
        public string getName() { return "Dual Y-Axis"; }

        //Number of charts produced in this demo module
        public int getNoOfCharts() { return 1; }

        //Main code for creating chart.
        //Note: the argument chartIndex is unused because this demo only has 1 chart.
        public void createChart(WPFChartViewer viewer, int chartIndex)
        {
            // The data for the chart
            double[] data0 = {0.05, 0.06, 0.48, 0.1, 0.01, 0.05};
            double[] data1 = {100, 125, 265, 147, 67, 105};
            string[] labels = {"Jan", "Feb", "Mar", "Apr", "May", "Jun"};

            // Create a XYChart object of size 300 x 180 pixels
            XYChart c = new XYChart(300, 180);

            // Set the plot area at (50, 20) and of size 200 x 130 pixels
            c.setPlotArea(50, 20, 200, 130);

            // Add a title to the chart using 8pt Arial Bold font
            c.addTitle("Independent Y-Axis Demo", "Arial Bold", 8);

            // Set the labels on the x axis.
            c.xAxis().setLabels(labels);

            // Add a title to the primary (left) y axis
            c.yAxis().setTitle("Packet Drop Rate (pps)");

            // Set the axis, label and title colors for the primary y axis to red (0xc00000) to
            // match the first data set
            c.yAxis().setColors(0xc00000, 0xc00000, 0xc00000);

            // Add a title to the secondary (right) y axis
            c.yAxis2().setTitle("Throughtput (MBytes)");

            // set the axis, label and title colors for the primary y axis to green (0x008000) to
            // match the second data set
            c.yAxis2().setColors(0x008000, 0x008000, 0x008000);

            // Add a line layer to for the first data set using red (0xc00000) color with a line
            // width to 3 pixels
            LineLayer lineLayer = c.addLineLayer(data0, 0xc00000);
            lineLayer.setLineWidth(3);

            // tool tip for the line layer
            lineLayer.setHTMLImageMap("", "", "title='Packet Drop Rate on {xLabel}: {value} pps'");

            // Add a bar layer to for the second data set using green (0x00C000) color. Bind the
            // second data set to the secondary (right) y axis
            BarLayer barLayer = c.addBarLayer(data1, 0x00c000);
            barLayer.setUseYAxis2();

            // tool tip for the bar layer
            barLayer.setHTMLImageMap("", "", "title='Throughput on {xLabel}: {value} MBytes'");

            // Output the chart
            viewer.Chart = c;

            // include tool tip for the chart
            viewer.ImageMap = c.getHTMLImageMap("clickable");
        }
    }
}
[ASP.NET Web Forms - C# version] NetWebCharts\CSharpASP\dualyaxis.aspx
(Click here on how to convert this code to code-behind style.)<%@ Page Language="C#" Debug="true" %>
<%@ Import Namespace="ChartDirector" %>
<%@ Register TagPrefix="chart" Namespace="ChartDirector" Assembly="netchartdir" %>
<!DOCTYPE html>
<script runat="server">
//
// Page Load event handler
//
protected void Page_Load(object sender, EventArgs e)
{
// The data for the chart
double[] data0 = {0.05, 0.06, 0.48, 0.1, 0.01, 0.05};
double[] data1 = {100, 125, 265, 147, 67, 105};
string[] labels = {"Jan", "Feb", "Mar", "Apr", "May", "Jun"};
// Create a XYChart object of size 300 x 180 pixels
XYChart c = new XYChart(300, 180);
// Set the plot area at (50, 20) and of size 200 x 130 pixels
c.setPlotArea(50, 20, 200, 130);
// Add a title to the chart using 8pt Arial Bold font
c.addTitle("Independent Y-Axis Demo", "Arial Bold", 8);
// Set the labels on the x axis.
c.xAxis().setLabels(labels);
// Add a title to the primary (left) y axis
c.yAxis().setTitle("Packet Drop Rate (pps)");
// Set the axis, label and title colors for the primary y axis to red (0xc00000) to match the
// first data set
c.yAxis().setColors(0xc00000, 0xc00000, 0xc00000);
// Add a title to the secondary (right) y axis
c.yAxis2().setTitle("Throughtput (MBytes)");
// set the axis, label and title colors for the primary y axis to green (0x008000) to match the
// second data set
c.yAxis2().setColors(0x008000, 0x008000, 0x008000);
// Add a line layer to for the first data set using red (0xc00000) color with a line width to 3
// pixels
LineLayer lineLayer = c.addLineLayer(data0, 0xc00000);
lineLayer.setLineWidth(3);
// tool tip for the line layer
lineLayer.setHTMLImageMap("", "", "title='Packet Drop Rate on {xLabel}: {value} pps'");
// Add a bar layer to for the second data set using green (0x00C000) color. Bind the second data
// set to the secondary (right) y axis
BarLayer barLayer = c.addBarLayer(data1, 0x00c000);
barLayer.setUseYAxis2();
// tool tip for the bar layer
barLayer.setHTMLImageMap("", "", "title='Throughput on {xLabel}: {value} MBytes'");
// Output the chart
WebChartViewer1.Image = c.makeWebImage(Chart.SVG);
// include tool tip for the chart
WebChartViewer1.ImageMap = c.getHTMLImageMap("");
}
</script>
<html>
<head>
<script type="text/javascript" src="cdjcv.js"></script>
</head>
<body>
<chart:WebChartViewer id="WebChartViewer1" runat="server" />
</body>
</html>
[ASP.NET Web Forms - VB Version] NetWebCharts\VBNetASP\dualyaxis.aspx
(Click here on how to convert this code to code-behind style.)<%@ Page Language="VB" Debug="true" %>
<%@ Import Namespace="ChartDirector" %>
<%@ Register TagPrefix="chart" Namespace="ChartDirector" Assembly="netchartdir" %>
<!DOCTYPE html>
<script runat="server">
'
' Page Load event handler
'
Protected Sub Page_Load(ByVal sender As System.Object, ByVal e As System.EventArgs)
' The data for the chart
Dim data0() As Double = {0.05, 0.06, 0.48, 0.1, 0.01, 0.05}
Dim data1() As Double = {100, 125, 265, 147, 67, 105}
Dim labels() As String = {"Jan", "Feb", "Mar", "Apr", "May", "Jun"}
' Create a XYChart object of size 300 x 180 pixels
Dim c As XYChart = New XYChart(300, 180)
' Set the plot area at (50, 20) and of size 200 x 130 pixels
c.setPlotArea(50, 20, 200, 130)
' Add a title to the chart using 8pt Arial Bold font
c.addTitle("Independent Y-Axis Demo", "Arial Bold", 8)
' Set the labels on the x axis.
c.xAxis().setLabels(labels)
' Add a title to the primary (left) y axis
c.yAxis().setTitle("Packet Drop Rate (pps)")
' Set the axis, label and title colors for the primary y axis to red (0xc00000) to match the
' first data set
c.yAxis().setColors(&Hc00000, &Hc00000, &Hc00000)
' Add a title to the secondary (right) y axis
c.yAxis2().setTitle("Throughtput (MBytes)")
' set the axis, label and title colors for the primary y axis to green (0x008000) to match the
' second data set
c.yAxis2().setColors(&H008000, &H008000, &H008000)
' Add a line layer to for the first data set using red (0xc00000) color with a line width to 3
' pixels
Dim lineLayer As LineLayer = c.addLineLayer(data0, &Hc00000)
lineLayer.setLineWidth(3)
' tool tip for the line layer
lineLayer.setHTMLImageMap("", "", "title='Packet Drop Rate on {xLabel}: {value} pps'")
' Add a bar layer to for the second data set using green (0x00C000) color. Bind the second data
' set to the secondary (right) y axis
Dim barLayer As BarLayer = c.addBarLayer(data1, &H00c000)
barLayer.setUseYAxis2()
' tool tip for the bar layer
barLayer.setHTMLImageMap("", "", "title='Throughput on {xLabel}: {value} MBytes'")
' Output the chart
WebChartViewer1.Image = c.makeWebImage(Chart.SVG)
' include tool tip for the chart
WebChartViewer1.ImageMap = c.getHTMLImageMap("")
End Sub
</script>
<html>
<head>
<script type="text/javascript" src="cdjcv.js"></script>
</head>
<body>
<chart:WebChartViewer id="WebChartViewer1" runat="server" />
</body>
</html>
[ASP.NET MVC - Controller] NetMvcCharts\Controllers\DualyaxisController.cs
using System;
using System.Web.Mvc;
using ChartDirector;

namespace NetMvcCharts.Controllers
{
    public class DualyaxisController : Controller
    {
        //
        // Default Action
        //
        public ActionResult Index()
        {
            ViewBag.Title = "Dual Y-Axis";
            createChart(ViewBag.Viewer = new RazorChartViewer(HttpContext, "chart1"));
            return View("~/Views/Shared/ChartView.cshtml");
        }

        //
        // Create chart
        //
        private void createChart(RazorChartViewer viewer)
        {
            // The data for the chart
            double[] data0 = {0.05, 0.06, 0.48, 0.1, 0.01, 0.05};
            double[] data1 = {100, 125, 265, 147, 67, 105};
            string[] labels = {"Jan", "Feb", "Mar", "Apr", "May", "Jun"};

            // Create a XYChart object of size 300 x 180 pixels
            XYChart c = new XYChart(300, 180);

            // Set the plot area at (50, 20) and of size 200 x 130 pixels
            c.setPlotArea(50, 20, 200, 130);

            // Add a title to the chart using 8pt Arial Bold font
            c.addTitle("Independent Y-Axis Demo", "Arial Bold", 8);

            // Set the labels on the x axis.
            c.xAxis().setLabels(labels);

            // Add a title to the primary (left) y axis
            c.yAxis().setTitle("Packet Drop Rate (pps)");

            // Set the axis, label and title colors for the primary y axis to red (0xc00000) to match the
            // first data set
            c.yAxis().setColors(0xc00000, 0xc00000, 0xc00000);

            // Add a title to the secondary (right) y axis
            c.yAxis2().setTitle("Throughtput (MBytes)");

            // set the axis, label and title colors for the primary y axis to green (0x008000) to match
            // the second data set
            c.yAxis2().setColors(0x008000, 0x008000, 0x008000);

            // Add a line layer to for the first data set using red (0xc00000) color with a line width to
            // 3 pixels
            LineLayer lineLayer = c.addLineLayer(data0, 0xc00000);
            lineLayer.setLineWidth(3);

            // tool tip for the line layer
            lineLayer.setHTMLImageMap("", "", "title='Packet Drop Rate on {xLabel}: {value} pps'");

            // Add a bar layer to for the second data set using green (0x00C000) color. Bind the second
            // data set to the secondary (right) y axis
            BarLayer barLayer = c.addBarLayer(data1, 0x00c000);
            barLayer.setUseYAxis2();

            // tool tip for the bar layer
            barLayer.setHTMLImageMap("", "", "title='Throughput on {xLabel}: {value} MBytes'");

            // Output the chart
            viewer.Image = c.makeWebImage(Chart.SVG);

            // include tool tip for the chart
            viewer.ImageMap = c.getHTMLImageMap("");
        }
    }
}
[ASP.NET MVC - View] NetMvcCharts\Views\Shared\ChartView.cshtml
@{ Layout = null; }

<!DOCTYPE html>

<html>
<head>
    <meta name="viewport" content="width=device-width" />
    <title>@ViewBag.Title</title>
    <style>
        @ViewBag.Style
    </style>
    @Scripts.Render("~/Scripts/cdjcv.js")
</head>
<body style="margin:5px 0px 0px 5px">
    <div style="font:bold 18pt verdana;">
        @ViewBag.Title
    </div>
    <hr style="border:solid 1px #000080; background:#000080" />
    <div>
        @{
            if (ViewBag.Viewer is Array)
            {
                // Display multiple charts
                for (int i = 0; i < ViewBag.Viewer.Length; ++i)
                {
                    @:@Html.Raw(ViewBag.Viewer[i].RenderHTML())
                }
            }
            else
            {
                // Display one chart only
                @:@Html.Raw(ViewBag.Viewer.RenderHTML())
            }
        }
    </div>
</body>
</html>
© 2023 Advanced Software Engineering Limited. All rights reserved.