[ASP.NET Web Forms - C# version] NetWebCharts\CSharpASP\financedemo.aspx
(Click here on how to convert this code to code-behind style.)<%@ Page Language="C#" Debug="true" %>
<%@ Import Namespace="ChartDirector" %>
<%@ Register TagPrefix="chart" Namespace="ChartDirector" Assembly="netchartdir" %>
<script runat="server">
// The timeStamps, volume, high, low, open and close data
DateTime[] timeStamps = null;
double[] volData = null;
double[] highData = null;
double[] lowData = null;
double[] openData = null;
double[] closeData = null;
// An extra data series to compare with the close data
double[] compareData = null;
// The resolution of the data in seconds. 1 day = 86400 seconds.
int resolution = 86400;
/// <summary>
/// Get the timeStamps, highData, lowData, openData, closeData and volData.
/// </summary>
/// <param name="ticker">The ticker symbol for the data series.</param>
/// <param name="startDate">The starting date/time for the data series.</param>
/// <param name="endDate">The ending date/time for the data series.</param>
/// <param name="durationInDays">The number of trading days to get.</param>
/// <param name="extraPoints">The extra leading data points needed in order to
/// compute moving averages.</param>
/// <returns>True if successfully obtain the data, otherwise false.</returns>
protected bool getData(string ticker, DateTime startDate, DateTime endDate, int durationInDays,
int extraPoints)
{
// This method should return false if the ticker symbol is invalid. In this sample code, as we
// are using a random number generator for the data, all ticker symbol is allowed, but we still
// assumed an empty symbol is invalid.
if (ticker == "") {
return false;
}
// In this demo, we can get 15 min, daily, weekly or monthly data depending on the time range.
resolution = 86400;
if (durationInDays <= 10) {
// 10 days or less, we assume 15 minute data points are available
resolution = 900;
// We need to adjust the startDate backwards for the extraPoints. We assume 6.5 hours
// trading time per day, and 5 trading days per week.
double dataPointsPerDay = 6.5 * 3600 / resolution;
DateTime adjustedStartDate = startDate.AddDays(-Math.Ceiling(extraPoints / dataPointsPerDay
* 7 / 5) - 2);
// Get the required 15 min data
get15MinData(ticker, adjustedStartDate, endDate);
} else if (durationInDays >= 4.5 * 360) {
// 4 years or more - use monthly data points.
resolution = 30 * 86400;
// Adjust startDate backwards to cater for extraPoints
DateTime adjustedStartDate = startDate.Date.AddMonths(-extraPoints);
// Get the required monthly data
getMonthlyData(ticker, adjustedStartDate, endDate);
} else if (durationInDays >= 1.5 * 360) {
// 1 year or more - use weekly points.
resolution = 7 * 86400;
// Adjust startDate backwards to cater for extraPoints
DateTime adjustedStartDate = startDate.Date.AddDays(-extraPoints * 7 - 6);
// Get the required weekly data
getWeeklyData(ticker, adjustedStartDate, endDate);
} else {
// Default - use daily points
resolution = 86400;
// Adjust startDate backwards to cater for extraPoints. We multiply the days by 7/5 as we
// assume 1 week has 5 trading days.
DateTime adjustedStartDate = startDate.Date.AddDays(-Math.Ceiling(extraPoints * 7.0 / 5) - 2
);
// Get the required daily data
getDailyData(ticker, adjustedStartDate, endDate);
}
return true;
}
/// <summary>
/// Get 15 minutes data series for timeStamps, highData, lowData, openData, closeData
/// and volData.
/// </summary>
/// <param name="ticker">The ticker symbol for the data series.</param>
/// <param name="startDate">The starting date/time for the data series.</param>
/// <param name="endDate">The ending date/time for the data series.</param>
protected void get15MinData(string ticker, DateTime startDate, DateTime endDate)
{
//
// In this demo, we use a random number generator to generate the data. In practice, you may get
// the data from a database or by other means. If you do not have 15 minute data, you may modify
// the "drawChart" method below to not using 15 minute data.
//
generateRandomData(ticker, startDate, endDate, 900);
}
/// <summary>
/// Get daily data series for timeStamps, highData, lowData, openData, closeData
/// and volData.
/// </summary>
/// <param name="ticker">The ticker symbol for the data series.</param>
/// <param name="startDate">The starting date/time for the data series.</param>
/// <param name="endDate">The ending date/time for the data series.</param>
protected void getDailyData(string ticker, DateTime startDate, DateTime endDate)
{
//
// In this demo, we use a random number generator to generate the data. In practice, you may get
// the data from a database or by other means.
//
// A typical database code example is like below. (This only shows a general idea. The exact
// details may differ depending on your database brand and schema. The SQL, in particular the
// date format, may be different depending on which brand of database you use.)
//
// // Open the database connection to MS SQL
// System.Data.IDbConnection dbconn = new System.Data.SqlClient.SqlConnection(
// "..... put your database connection string here .......");
// dbconn.Open();
//
// // SQL statement to get the data
// System.Data.IDbCommand sqlCmd = dbconn.CreateCommand();
// sqlCmd.CommandText = "Select recordDate, highData, lowData, openData, " +
// "closeData, volData From dailyFinanceTable Where ticker = '" + ticker +
// "' And recordDate >= '" + startDate.ToString("yyyyMMdd") + "' And " +
// "recordDate <= '" + endDate.ToString("yyyyMMdd") + "' Order By recordDate";
//
// // The most convenient way to read the SQL result into arrays is to use the
// // ChartDirector DBTable utility.
// DBTable table = new DBTable(sqlCmd.ExecuteReader());
// dbconn.Close();
//
// // Now get the data into arrays
// timeStamps = table.getColAsDateTime(0);
// highData = table.getCol(1);
// lowData = table.getCol(2);
// openData = table.getCol(3);
// closeData = table.getCol(4);
// volData = table.getCol(5);
//
generateRandomData(ticker, startDate, endDate, 86400);
}
/// <summary>
/// Get weekly data series for timeStamps, highData, lowData, openData, closeData
/// and volData.
/// </summary>
/// <param name="ticker">The ticker symbol for the data series.</param>
/// <param name="startDate">The starting date/time for the data series.</param>
/// <param name="endDate">The ending date/time for the data series.</param>
protected void getWeeklyData(string ticker, DateTime startDate, DateTime endDate)
{
//
// If you do not have weekly data, you may call "getDailyData(startDate, endDate)" to get daily
// data, then call "convertDailyToWeeklyData()" to convert to weekly data.
//
generateRandomData(ticker, startDate, endDate, 86400 * 7);
}
/// <summary>
/// Get monthly data series for timeStamps, highData, lowData, openData, closeData
/// and volData.
/// </summary>
/// <param name="ticker">The ticker symbol for the data series.</param>
/// <param name="startDate">The starting date/time for the data series.</param>
/// <param name="endDate">The ending date/time for the data series.</param>
protected void getMonthlyData(string ticker, DateTime startDate, DateTime endDate)
{
//
// If you do not have weekly data, you may call "getDailyData(startDate, endDate)" to get daily
// data, then call "convertDailyToMonthlyData()" to convert to monthly data.
//
generateRandomData(ticker, startDate, endDate, 86400 * 30);
}
/// <summary>
/// A random number generator designed to generate realistic financial data.
/// </summary>
/// <param name="ticker">The ticker symbol for the data series.</param>
/// <param name="startDate">The starting date/time for the data series.</param>
/// <param name="endDate">The ending date/time for the data series.</param>
/// <param name="resolution">The period of the data series.</param>
protected void generateRandomData(string ticker, DateTime startDate, DateTime endDate,
int resolution)
{
FinanceSimulator db = new FinanceSimulator(ticker, startDate, endDate, resolution);
timeStamps = db.getTimeStamps();
highData = db.getHighData();
lowData = db.getLowData();
openData = db.getOpenData();
closeData = db.getCloseData();
volData = db.getVolData();
}
/// <summary>
/// A utility to convert daily to weekly data.
/// </summary>
protected void convertDailyToWeeklyData()
{
aggregateData(new ArrayMath(timeStamps).selectStartOfWeek());
}
/// <summary>
/// A utility to convert daily to monthly data.
/// </summary>
protected void convertDailyToMonthlyData()
{
aggregateData(new ArrayMath(timeStamps).selectStartOfMonth());
}
/// <summary>
/// An internal method used to aggregate daily data.
/// </summary>
protected void aggregateData(ArrayMath aggregator)
{
timeStamps = Chart.NTime(aggregator.aggregate(Chart.CTime(timeStamps), Chart.AggregateFirst));
highData = aggregator.aggregate(highData, Chart.AggregateMax);
lowData = aggregator.aggregate(lowData, Chart.AggregateMin);
openData = aggregator.aggregate(openData, Chart.AggregateFirst);
closeData = aggregator.aggregate(closeData, Chart.AggregateLast);
volData = aggregator.aggregate(volData, Chart.AggregateSum);
}
/// <summary>
/// Create a financial chart according to user selections. The user selections are
/// encoded in the query parameters.
/// </summary>
public BaseChart drawChart()
{
// In this demo, we just assume we plot up to the latest time. So end date is now.
DateTime endDate = DateTime.Now;
// If the trading day has not yet started (before 9:30am), or if the end date is on on Sat or
// Sun, we set the end date to 4:00pm of the last trading day
while ((endDate.TimeOfDay.CompareTo(new TimeSpan(9, 30, 0)) < 0) || (endDate.DayOfWeek ==
DayOfWeek.Sunday) || (endDate.DayOfWeek == DayOfWeek.Saturday)) {
endDate = endDate.Date.AddDays(-1).Add(new TimeSpan(16, 0, 0));
}
// The duration selected by the user
int durationInDays = int.Parse(TimeRange.SelectedItem.Value);
// Compute the start date by subtracting the duration from the end date.
DateTime startDate = endDate;
if (durationInDays >= 30) {
// More or equal to 30 days - so we use months as the unit
startDate = new DateTime(endDate.Year, endDate.Month, 1).AddMonths(-durationInDays / 30);
} else {
// Less than 30 days - use day as the unit. The starting point of the axis is always at the
// start of the day (9:30am). Note that we use trading days, so we skip Sat and Sun in
// counting the days.
startDate = endDate.Date;
for(int i = 1; i < durationInDays; ++i) {
if (startDate.DayOfWeek == DayOfWeek.Monday) {
startDate = startDate.AddDays(-3);
} else {
startDate = startDate.AddDays(-1);
}
}
}
// The moving average periods selected by the user.
int avgPeriod1 = 0;
int.TryParse(movAvg1.Text, out avgPeriod1);
int avgPeriod2 = 0;
int.TryParse(movAvg2.Text, out avgPeriod2);
if (avgPeriod1 < 0) {
avgPeriod1 = 0;
} else if (avgPeriod1 > 300) {
avgPeriod1 = 300;
}
if (avgPeriod2 < 0) {
avgPeriod2 = 0;
} else if (avgPeriod2 > 300) {
avgPeriod2 = 300;
}
// We need extra leading data points in order to compute moving averages.
int extraPoints = 20;
if (avgPeriod1 > extraPoints) {
extraPoints = avgPeriod1;
}
if (avgPeriod2 > extraPoints) {
extraPoints = avgPeriod2;
}
// Get the data series to compare with, if any.
string compareKey = CompareWith.Text.Trim();
compareData = null;
if (getData(compareKey, startDate, endDate, durationInDays, extraPoints)) {
compareData = closeData;
}
// The data series we want to get.
string tickerKey = TickerSymbol.Text.Trim();
if (!getData(tickerKey, startDate, endDate, durationInDays, extraPoints)) {
return errMsg("Please enter a valid ticker symbol");
}
// We now confirm the actual number of extra points (data points that are before the start date)
// as inferred using actual data from the database.
extraPoints = timeStamps.Length;
for(int i = 0; i < timeStamps.Length; ++i) {
if (timeStamps[i] >= startDate) {
extraPoints = i;
break;
}
}
// Check if there is any valid data
if (extraPoints >= timeStamps.Length) {
// No data - just display the no data message.
return errMsg("No data available for the specified time period");
}
// In some finance chart presentation style, even if the data for the latest day is not fully
// available, the axis for the entire day will still be drawn, where no data will appear near
// the end of the axis.
if (resolution < 86400) {
// Add extra points to the axis until it reaches the end of the day. The end of day is
// assumed to be 16:00 (it depends on the stock exchange).
DateTime lastTime = timeStamps[timeStamps.Length - 1];
int extraTrailingPoints = (int)(new TimeSpan(16, 0, 0).Subtract(lastTime.TimeOfDay
).TotalSeconds / resolution);
if (extraTrailingPoints > 0) {
DateTime[] extendedTimeStamps = new DateTime[timeStamps.Length + extraTrailingPoints];
Array.Copy(timeStamps, 0, extendedTimeStamps, 0, timeStamps.Length);
for(int i = 0; i < extraTrailingPoints; ++i) {
extendedTimeStamps[i + timeStamps.Length] = lastTime.AddSeconds(resolution * (i + 1)
);
}
timeStamps = extendedTimeStamps;
}
}
//
// At this stage, all data are available. We can draw the chart as according to user input.
//
//
// Determine the chart size. In this demo, user can select 4 different chart sizes. Default is
// the large chart size.
//
int width = 780;
int mainHeight = 255;
int indicatorHeight = 80;
string size = ChartSize.SelectedItem.Value;
if (size == "S") {
// Small chart size
width = 450;
mainHeight = 160;
indicatorHeight = 60;
} else if (size == "M") {
// Medium chart size
width = 620;
mainHeight = 215;
indicatorHeight = 70;
} else if (size == "H") {
// Huge chart size
width = 1000;
mainHeight = 320;
indicatorHeight = 90;
}
// Create the chart object using the selected size
FinanceChart m = new FinanceChart(width);
// Set the data into the chart object
m.setData(timeStamps, highData, lowData, openData, closeData, volData, extraPoints);
//
// We configure the title of the chart. In this demo chart design, we put the company name as
// the top line of the title with left alignment.
//
m.addPlotAreaTitle(Chart.TopLeft, tickerKey);
// We displays the current date as well as the data resolution on the next line.
string resolutionText = "";
if (resolution == 30 * 86400) {
resolutionText = "Monthly";
} else if (resolution == 7 * 86400) {
resolutionText = "Weekly";
} else if (resolution == 86400) {
resolutionText = "Daily";
} else if (resolution == 900) {
resolutionText = "15-min";
}
m.addPlotAreaTitle(Chart.BottomLeft, "<*font=Arial,size=8*>" + m.formatValue(DateTime.Now,
"mmm dd, yyyy") + " - " + resolutionText + " chart");
// A copyright message at the bottom left corner the title area
m.addPlotAreaTitle(Chart.BottomRight, "<*font=Arial,size=8*>(c) Advanced Software Engineering");
//
// Add the first techical indicator according. In this demo, we draw the first indicator on top
// of the main chart.
//
addIndicator(m, Indicator1.SelectedItem.Value, indicatorHeight);
//
// Add the main chart
//
m.addMainChart(mainHeight);
//
// Set log or linear scale according to user preference
//
if (LogScale.Checked) {
m.setLogScale(true);
}
//
// Set axis labels to show data values or percentage change to user preference
//
if (PercentageScale.Checked) {
m.setPercentageAxis();
}
//
// Draw any price line the user has selected
//
string mainType = ChartType.SelectedItem.Value;
if (mainType == "Close") {
m.addCloseLine(0x000040);
} else if (mainType == "TP") {
m.addTypicalPrice(0x000040);
} else if (mainType == "WC") {
m.addWeightedClose(0x000040);
} else if (mainType == "Median") {
m.addMedianPrice(0x000040);
}
//
// Add comparison line if there is data for comparison
//
if (compareData != null) {
if (compareData.Length > extraPoints) {
m.addComparison(compareData, 0x0000ff, compareKey);
}
}
//
// Add moving average lines.
//
addMovingAvg(m, avgType1.SelectedItem.Value, avgPeriod1, 0x663300);
addMovingAvg(m, avgType2.SelectedItem.Value, avgPeriod2, 0x9900ff);
//
// Draw candlesticks or OHLC symbols if the user has selected them.
//
if (mainType == "CandleStick") {
m.addCandleStick(0x33ff33, 0xff3333);
} else if (mainType == "OHLC") {
m.addHLOC(0x008800, 0xcc0000);
}
//
// Add parabolic SAR if necessary
//
if (ParabolicSAR.Checked) {
m.addParabolicSAR(0.02, 0.02, 0.2, Chart.DiamondShape, 5, 0x008800, 0x000000);
}
//
// Add price band/channel/envelop to the chart according to user selection
//
string bandType = Band.SelectedItem.Value;
if (bandType == "BB") {
m.addBollingerBand(20, 2, 0x9999ff, unchecked((int)0xc06666ff));
} else if (bandType == "DC") {
m.addDonchianChannel(20, 0x9999ff, unchecked((int)0xc06666ff));
} else if (bandType == "Envelop") {
m.addEnvelop(20, 0.1, 0x9999ff, unchecked((int)0xc06666ff));
}
//
// Add volume bars to the main chart if necessary
//
if (Volume.Checked) {
m.addVolBars(indicatorHeight, 0x99ff99, 0xff9999, 0xc0c0c0);
}
//
// Add additional indicators as according to user selection.
//
addIndicator(m, Indicator2.SelectedItem.Value, indicatorHeight);
addIndicator(m, Indicator3.SelectedItem.Value, indicatorHeight);
addIndicator(m, Indicator4.SelectedItem.Value, indicatorHeight);
return m;
}
/// <summary>
/// Add a moving average line to the FinanceChart object.
/// </summary>
/// <param name="m">The FinanceChart object to add the line to.</param>
/// <param name="avgType">The moving average type (SMA/EMA/TMA/WMA).</param>
/// <param name="avgPeriod">The moving average period.</param>
/// <param name="color">The color of the line.</param>
/// <returns>The LineLayer object representing line layer created.</returns>
protected LineLayer addMovingAvg(FinanceChart m, string avgType, int avgPeriod, int color)
{
if (avgPeriod > 1) {
if (avgType == "SMA") {
return m.addSimpleMovingAvg(avgPeriod, color);
} else if (avgType == "EMA") {
return m.addExpMovingAvg(avgPeriod, color);
} else if (avgType == "TMA") {
return m.addTriMovingAvg(avgPeriod, color);
} else if (avgType == "WMA") {
return m.addWeightedMovingAvg(avgPeriod, color);
}
}
return null;
}
/// <summary>
/// Add an indicator chart to the FinanceChart object. In this demo example, the
/// indicator parameters (such as the period used to compute RSI, colors of the lines,
/// etc.) are hard coded to commonly used values. You are welcome to design a more
/// complex user interface to allow users to set the parameters.
/// </summary>
/// <param name="m">The FinanceChart object to add the line to.</param>
/// <param name="indicator">The selected indicator.</param>
/// <param name="height">Height of the chart in pixels</param>
/// <returns>The XYChart object representing indicator chart.</returns>
protected XYChart addIndicator(FinanceChart m, string indicator, int height)
{
if (indicator == "RSI") {
return m.addRSI(height, 14, 0x800080, 20, 0xff6666, 0x6666ff);
} else if (indicator == "StochRSI") {
return m.addStochRSI(height, 14, 0x800080, 30, 0xff6666, 0x6666ff);
} else if (indicator == "MACD") {
return m.addMACD(height, 26, 12, 9, 0x0000ff, 0xff00ff, 0x008000);
} else if (indicator == "FStoch") {
return m.addFastStochastic(height, 14, 3, 0x006060, 0x606000);
} else if (indicator == "SStoch") {
return m.addSlowStochastic(height, 14, 3, 0x006060, 0x606000);
} else if (indicator == "ATR") {
return m.addATR(height, 14, 0x808080, 0x0000ff);
} else if (indicator == "ADX") {
return m.addADX(height, 14, 0x008000, 0x800000, 0x000080);
} else if (indicator == "DCW") {
return m.addDonchianWidth(height, 20, 0x0000ff);
} else if (indicator == "BBW") {
return m.addBollingerWidth(height, 20, 2, 0x0000ff);
} else if (indicator == "DPO") {
return m.addDPO(height, 20, 0x0000ff);
} else if (indicator == "PVT") {
return m.addPVT(height, 0x0000ff);
} else if (indicator == "Momentum") {
return m.addMomentum(height, 12, 0x0000ff);
} else if (indicator == "Performance") {
return m.addPerformance(height, 0x0000ff);
} else if (indicator == "ROC") {
return m.addROC(height, 12, 0x0000ff);
} else if (indicator == "OBV") {
return m.addOBV(height, 0x0000ff);
} else if (indicator == "AccDist") {
return m.addAccDist(height, 0x0000ff);
} else if (indicator == "CLV") {
return m.addCLV(height, 0x0000ff);
} else if (indicator == "WilliamR") {
return m.addWilliamR(height, 14, 0x800080, 30, 0xff6666, 0x6666ff);
} else if (indicator == "Aroon") {
return m.addAroon(height, 14, 0x339933, 0x333399);
} else if (indicator == "AroonOsc") {
return m.addAroonOsc(height, 14, 0x0000ff);
} else if (indicator == "CCI") {
return m.addCCI(height, 20, 0x800080, 100, 0xff6666, 0x6666ff);
} else if (indicator == "EMV") {
return m.addEaseOfMovement(height, 9, 0x006060, 0x606000);
} else if (indicator == "MDX") {
return m.addMassIndex(height, 0x800080, 0xff6666, 0x6666ff);
} else if (indicator == "CVolatility") {
return m.addChaikinVolatility(height, 10, 10, 0x0000ff);
} else if (indicator == "COscillator") {
return m.addChaikinOscillator(height, 0x0000ff);
} else if (indicator == "CMF") {
return m.addChaikinMoneyFlow(height, 21, 0x008000);
} else if (indicator == "NVI") {
return m.addNVI(height, 255, 0x0000ff, 0x883333);
} else if (indicator == "PVI") {
return m.addPVI(height, 255, 0x0000ff, 0x883333);
} else if (indicator == "MFI") {
return m.addMFI(height, 14, 0x800080, 30, 0xff6666, 0x6666ff);
} else if (indicator == "PVO") {
return m.addPVO(height, 26, 12, 9, 0x0000ff, 0xff00ff, 0x008000);
} else if (indicator == "PPO") {
return m.addPPO(height, 26, 12, 9, 0x0000ff, 0xff00ff, 0x008000);
} else if (indicator == "UO") {
return m.addUltimateOscillator(height, 7, 14, 28, 0x800080, 20, 0xff6666, 0x6666ff);
} else if (indicator == "Vol") {
return m.addVolIndicator(height, 0x99ff99, 0xff9999, 0xc0c0c0);
} else if (indicator == "TRIX") {
return m.addTRIX(height, 12, 0x0000ff);
}
return null;
}
/// <summary>
/// Creates a dummy chart to show an error message.
/// </summary>
/// <param name="msg">The error message.
/// <returns>The BaseChart object containing the error message.</returns>
protected BaseChart errMsg(string msg)
{
MultiChart m = new MultiChart(400, 200);
m.addTitle2(Chart.Center, msg, "Arial", 10).setMaxWidth(m.getWidth());
return m;
}
//
// Page Load event handler
//
protected void Page_Load(object sender, EventArgs e)
{
// Create the finance chart
BaseChart c = drawChart();
// Output the chart
WebChartViewer1.Image = c.makeWebImage(Chart.SVG);
}
</script>
<!DOCTYPE html>
<html>
<head>
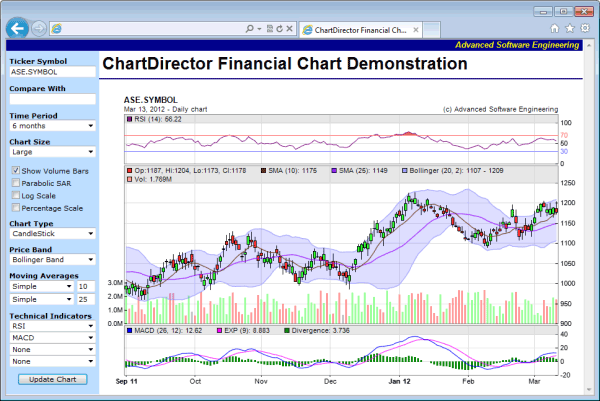
<title>ChartDirector Financial Chart Demonstration</title>
<style>
.inputtitle {font:11px verdana; margin:10px 5px;}
.input {font:11px verdana}
</style>
</head>
<body style="margin:0px">
<table style="border:0px; padding:0px; border-spacing:0px;">
<tr>
<td align="right" colspan="2" style="background:#000088">
<div style="padding:0px 3px 2px 0px; font:bold italic 10pt arial;">
<a style="color:#ffff00; text-decoration:none" href="http://www.advsofteng.com">
Advanced Software Engineering
</a>
</div>
</td>
</tr>
<tr valign="top">
<td style="width:150px; background:#bbddff">
<form id="Form1" method="post" runat="server">
<div class="inputtitle">
<b>Ticker Symbol</b><br />
<asp:TextBox runat="server" id="TickerSymbol" class="input" style="width:140px;">ASE.SYMBOL</asp:TextBox>
</div>
<div class="inputtitle">
<b>Compare With</b><br />
<asp:TextBox runat="server" id="CompareWith" class="input" style="width:140px;"></asp:TextBox>
</div>
<div class="inputtitle">
<b>Time Period</b><br />
<asp:DropDownList runat="server" id="TimeRange" class="input" style="width:140px;">
<asp:ListItem value="1">1 day</asp:ListItem>
<asp:ListItem value="2">2 days</asp:ListItem>
<asp:ListItem value="5">5 days</asp:ListItem>
<asp:ListItem value="10">10 days</asp:ListItem>
<asp:ListItem value="30">1 month</asp:ListItem>
<asp:ListItem value="60">2 months</asp:ListItem>
<asp:ListItem value="90">3 months</asp:ListItem>
<asp:ListItem value="180" Selected="True">6 months</asp:ListItem>
<asp:ListItem value="360">1 year</asp:ListItem>
<asp:ListItem value="720">2 years</asp:ListItem>
<asp:ListItem value="1080">3 years</asp:ListItem>
<asp:ListItem value="1440">4 years</asp:ListItem>
<asp:ListItem value="1800">5 years</asp:ListItem>
<asp:ListItem value="3600">10 years</asp:ListItem>
</asp:DropDownList>
</div>
<div class="inputtitle">
<b>Chart Size</b><br />
<asp:DropDownList runat="server" id="ChartSize" class="input" style="width:140px;">
<asp:ListItem value="S">Small</asp:ListItem>
<asp:ListItem value="M">Medium</asp:ListItem>
<asp:ListItem value="L" Selected="True">Large</asp:ListItem>
<asp:ListItem value="H">Huge</asp:ListItem>
</asp:DropDownList><br />
</div>
<div class="inputtitle">
<asp:CheckBox runat="server" Text="Show Volume Bars" id="Volume" Checked="True"></asp:CheckBox><br />
<asp:CheckBox runat="server" Text="Parabolic SAR" id="ParabolicSAR"></asp:CheckBox><br />
<asp:CheckBox runat="server" Text="Log Scale" id="LogScale"></asp:CheckBox><br />
<asp:CheckBox runat="server" Text="Percentage Scale" id="PercentageScale"></asp:CheckBox><br />
</div>
<div class="inputtitle">
<b>Chart Type</b><br />
<asp:DropDownList runat="server" id="ChartType" class="input" style="width:140px;">
<asp:ListItem value="None">None</asp:ListItem>
<asp:ListItem value="CandleStick" Selected="True">CandleStick</asp:ListItem>
<asp:ListItem value="Close">Closing Price</asp:ListItem>
<asp:ListItem value="Median">Median Price</asp:ListItem>
<asp:ListItem value="OHLC">OHLC</asp:ListItem>
<asp:ListItem value="TP">Typical Price</asp:ListItem>
<asp:ListItem value="WC">Weighted Close</asp:ListItem>
</asp:DropDownList>
</div>
<div class="inputtitle">
<b>Price Band</b><br />
<asp:DropDownList runat="server" id="Band" class="input" style="width:140px;">
<asp:ListItem value="None">None</asp:ListItem>
<asp:ListItem value="BB" Selected="True">Bollinger Band</asp:ListItem>
<asp:ListItem value="DC">Donchian Channel</asp:ListItem>
<asp:ListItem value="Envelop">Envelop (SMA 20 +/- 10%)</asp:ListItem>
</asp:DropDownList>
</div>
<div class="inputtitle">
<b>Moving Averages</b><br />
<asp:DropDownList runat="server" id="avgType1" class="input" style="width:105px;">
<asp:ListItem value="None">None</asp:ListItem>
<asp:ListItem value="SMA" Selected="True">Simple</asp:ListItem>
<asp:ListItem value="EMA">Exponential</asp:ListItem>
<asp:ListItem value="TMA">Triangular</asp:ListItem>
<asp:ListItem value="WMA">Weighted</asp:ListItem>
</asp:DropDownList>
<asp:TextBox runat="server" id="movAvg1" class="input" style="width:30px;">10</asp:TextBox><br />
<asp:DropDownList runat="server" id="avgType2" class="input" style="width:105px;">
<asp:ListItem value="None">None</asp:ListItem>
<asp:ListItem value="SMA" Selected="True">Simple</asp:ListItem>
<asp:ListItem value="EMA">Exponential</asp:ListItem>
<asp:ListItem value="TMA">Triangular</asp:ListItem>
<asp:ListItem value="WMA">Weighted</asp:ListItem>
</asp:DropDownList>
<asp:TextBox runat="server" id="movAvg2" class="input" style="width:30px;">25</asp:TextBox><br />
</div>
<div class="inputtitle">
<b>Technical Indicators</b><br />
<asp:DropDownList runat="server" id="Indicator1" class="input" style="width:140px;">
<asp:ListItem value="None">None</asp:ListItem>
<asp:ListItem value="AccDist">Accumulation/Distribution</asp:ListItem>
<asp:ListItem value="AroonOsc">Aroon Oscillator</asp:ListItem>
<asp:ListItem value="Aroon">Aroon Up/Down</asp:ListItem>
<asp:ListItem value="ADX">Avg Directional Index</asp:ListItem>
<asp:ListItem value="ATR">Avg True Range</asp:ListItem>
<asp:ListItem value="BBW">Bollinger Band Width</asp:ListItem>
<asp:ListItem value="CMF">Chaikin Money Flow</asp:ListItem>
<asp:ListItem value="COscillator">Chaikin Oscillator</asp:ListItem>
<asp:ListItem value="CVolatility">Chaikin Volatility</asp:ListItem>
<asp:ListItem value="CLV">Close Location Value</asp:ListItem>
<asp:ListItem value="CCI">Commodity Channel Index</asp:ListItem>
<asp:ListItem value="DPO">Detrended Price Osc</asp:ListItem>
<asp:ListItem value="DCW">Donchian Channel Width</asp:ListItem>
<asp:ListItem value="EMV">Ease of Movement</asp:ListItem>
<asp:ListItem value="FStoch">Fast Stochastic</asp:ListItem>
<asp:ListItem value="MACD">MACD</asp:ListItem>
<asp:ListItem value="MDX">Mass Index</asp:ListItem>
<asp:ListItem value="Momentum">Momentum</asp:ListItem>
<asp:ListItem value="MFI">Money Flow Index</asp:ListItem>
<asp:ListItem value="NVI">Neg Volume Index</asp:ListItem>
<asp:ListItem value="OBV">On Balance Volume</asp:ListItem>
<asp:ListItem value="Performance">Performance</asp:ListItem>
<asp:ListItem value="PPO">% Price Oscillator</asp:ListItem>
<asp:ListItem value="PVO">% Volume Oscillator</asp:ListItem>
<asp:ListItem value="PVI">Pos Volume Index</asp:ListItem>
<asp:ListItem value="PVT">Price Volume Trend</asp:ListItem>
<asp:ListItem value="ROC">Rate of Change</asp:ListItem>
<asp:ListItem value="RSI" Selected="True">RSI</asp:ListItem>
<asp:ListItem value="SStoch">Slow Stochastic</asp:ListItem>
<asp:ListItem value="StochRSI">StochRSI</asp:ListItem>
<asp:ListItem value="TRIX">TRIX</asp:ListItem>
<asp:ListItem value="UO">Ultimate Oscillator</asp:ListItem>
<asp:ListItem value="Vol">Volume</asp:ListItem>
<asp:ListItem value="WilliamR">William's %R</asp:ListItem>
</asp:DropDownList><br />
<asp:DropDownList runat="server" id="Indicator2" class="input" style="width:140px;">
<asp:ListItem value="None">None</asp:ListItem>
<asp:ListItem value="AccDist">Accumulation/Distribution</asp:ListItem>
<asp:ListItem value="AroonOsc">Aroon Oscillator</asp:ListItem>
<asp:ListItem value="Aroon">Aroon Up/Down</asp:ListItem>
<asp:ListItem value="ADX">Avg Directional Index</asp:ListItem>
<asp:ListItem value="ATR">Avg True Range</asp:ListItem>
<asp:ListItem value="BBW">Bollinger Band Width</asp:ListItem>
<asp:ListItem value="CMF">Chaikin Money Flow</asp:ListItem>
<asp:ListItem value="COscillator">Chaikin Oscillator</asp:ListItem>
<asp:ListItem value="CVolatility">Chaikin Volatility</asp:ListItem>
<asp:ListItem value="CLV">Close Location Value</asp:ListItem>
<asp:ListItem value="CCI">Commodity Channel Index</asp:ListItem>
<asp:ListItem value="DPO">Detrended Price Osc</asp:ListItem>
<asp:ListItem value="DCW">Donchian Channel Width</asp:ListItem>
<asp:ListItem value="EMV">Ease of Movement</asp:ListItem>
<asp:ListItem value="FStoch">Fast Stochastic</asp:ListItem>
<asp:ListItem value="MACD" Selected="True">MACD</asp:ListItem>
<asp:ListItem value="MDX">Mass Index</asp:ListItem>
<asp:ListItem value="Momentum">Momentum</asp:ListItem>
<asp:ListItem value="MFI">Money Flow Index</asp:ListItem>
<asp:ListItem value="NVI">Neg Volume Index</asp:ListItem>
<asp:ListItem value="OBV">On Balance Volume</asp:ListItem>
<asp:ListItem value="Performance">Performance</asp:ListItem>
<asp:ListItem value="PPO">% Price Oscillator</asp:ListItem>
<asp:ListItem value="PVO">% Volume Oscillator</asp:ListItem>
<asp:ListItem value="PVI">Pos Volume Index</asp:ListItem>
<asp:ListItem value="PVT">Price Volume Trend</asp:ListItem>
<asp:ListItem value="ROC">Rate of Change</asp:ListItem>
<asp:ListItem value="RSI">RSI</asp:ListItem>
<asp:ListItem value="SStoch">Slow Stochastic</asp:ListItem>
<asp:ListItem value="StochRSI">StochRSI</asp:ListItem>
<asp:ListItem value="TRIX">TRIX</asp:ListItem>
<asp:ListItem value="UO">Ultimate Oscillator</asp:ListItem>
<asp:ListItem value="Vol">Volume</asp:ListItem>
<asp:ListItem value="WilliamR">William's %R</asp:ListItem>
</asp:DropDownList><br />
<asp:DropDownList runat="server" id="Indicator3" class="input" style="width:140px;">
<asp:ListItem value="None" Selected="True">None</asp:ListItem>
<asp:ListItem value="AccDist">Accumulation/Distribution</asp:ListItem>
<asp:ListItem value="AroonOsc">Aroon Oscillator</asp:ListItem>
<asp:ListItem value="Aroon">Aroon Up/Down</asp:ListItem>
<asp:ListItem value="ADX">Avg Directional Index</asp:ListItem>
<asp:ListItem value="ATR">Avg True Range</asp:ListItem>
<asp:ListItem value="BBW">Bollinger Band Width</asp:ListItem>
<asp:ListItem value="CMF">Chaikin Money Flow</asp:ListItem>
<asp:ListItem value="COscillator">Chaikin Oscillator</asp:ListItem>
<asp:ListItem value="CVolatility">Chaikin Volatility</asp:ListItem>
<asp:ListItem value="CLV">Close Location Value</asp:ListItem>
<asp:ListItem value="CCI">Commodity Channel Index</asp:ListItem>
<asp:ListItem value="DPO">Detrended Price Osc</asp:ListItem>
<asp:ListItem value="DCW">Donchian Channel Width</asp:ListItem>
<asp:ListItem value="EMV">Ease of Movement</asp:ListItem>
<asp:ListItem value="FStoch">Fast Stochastic</asp:ListItem>
<asp:ListItem value="MACD">MACD</asp:ListItem>
<asp:ListItem value="MDX">Mass Index</asp:ListItem>
<asp:ListItem value="Momentum">Momentum</asp:ListItem>
<asp:ListItem value="MFI">Money Flow Index</asp:ListItem>
<asp:ListItem value="NVI">Neg Volume Index</asp:ListItem>
<asp:ListItem value="OBV">On Balance Volume</asp:ListItem>
<asp:ListItem value="Performance">Performance</asp:ListItem>
<asp:ListItem value="PPO">% Price Oscillator</asp:ListItem>
<asp:ListItem value="PVO">% Volume Oscillator</asp:ListItem>
<asp:ListItem value="PVI">Pos Volume Index</asp:ListItem>
<asp:ListItem value="PVT">Price Volume Trend</asp:ListItem>
<asp:ListItem value="ROC">Rate of Change</asp:ListItem>
<asp:ListItem value="RSI">RSI</asp:ListItem>
<asp:ListItem value="SStoch">Slow Stochastic</asp:ListItem>
<asp:ListItem value="StochRSI">StochRSI</asp:ListItem>
<asp:ListItem value="TRIX">TRIX</asp:ListItem>
<asp:ListItem value="UO">Ultimate Oscillator</asp:ListItem>
<asp:ListItem value="Vol">Volume</asp:ListItem>
<asp:ListItem value="WilliamR">William's %R</asp:ListItem>
</asp:DropDownList><br />
<asp:DropDownList runat="server" id="Indicator4" class="input" style="width:140px;">
<asp:ListItem value="None" Selected="True">None</asp:ListItem>
<asp:ListItem value="AccDist">Accumulation/Distribution</asp:ListItem>
<asp:ListItem value="AroonOsc">Aroon Oscillator</asp:ListItem>
<asp:ListItem value="Aroon">Aroon Up/Down</asp:ListItem>
<asp:ListItem value="ADX">Avg Directional Index</asp:ListItem>
<asp:ListItem value="ATR">Avg True Range</asp:ListItem>
<asp:ListItem value="BBW">Bollinger Band Width</asp:ListItem>
<asp:ListItem value="CMF">Chaikin Money Flow</asp:ListItem>
<asp:ListItem value="COscillator">Chaikin Oscillator</asp:ListItem>
<asp:ListItem value="CVolatility">Chaikin Volatility</asp:ListItem>
<asp:ListItem value="CLV">Close Location Value</asp:ListItem>
<asp:ListItem value="CCI">Commodity Channel Index</asp:ListItem>
<asp:ListItem value="DPO">Detrended Price Osc</asp:ListItem>
<asp:ListItem value="DCW">Donchian Channel Width</asp:ListItem>
<asp:ListItem value="EMV">Ease of Movement</asp:ListItem>
<asp:ListItem value="FStoch">Fast Stochastic</asp:ListItem>
<asp:ListItem value="MACD">MACD</asp:ListItem>
<asp:ListItem value="MDX">Mass Index</asp:ListItem>
<asp:ListItem value="Momentum">Momentum</asp:ListItem>
<asp:ListItem value="MFI">Money Flow Index</asp:ListItem>
<asp:ListItem value="NVI">Neg Volume Index</asp:ListItem>
<asp:ListItem value="OBV">On Balance Volume</asp:ListItem>
<asp:ListItem value="Performance">Performance</asp:ListItem>
<asp:ListItem value="PPO">% Price Oscillator</asp:ListItem>
<asp:ListItem value="PVO">% Volume Oscillator</asp:ListItem>
<asp:ListItem value="PVI">Pos Volume Index</asp:ListItem>
<asp:ListItem value="PVT">Price Volume Trend</asp:ListItem>
<asp:ListItem value="ROC">Rate of Change</asp:ListItem>
<asp:ListItem value="RSI">RSI</asp:ListItem>
<asp:ListItem value="SStoch">Slow Stochastic</asp:ListItem>
<asp:ListItem value="StochRSI">StochRSI</asp:ListItem>
<asp:ListItem value="TRIX">TRIX</asp:ListItem>
<asp:ListItem value="UO">Ultimate Oscillator</asp:ListItem>
<asp:ListItem value="Vol">Volume</asp:ListItem>
<asp:ListItem value="WilliamR">William's %R</asp:ListItem>
</asp:DropDownList>
</div>
<div class="inputtitle" style="text-align:center">
<asp:Button runat="server" id="Button1" class="input" Text="Update Chart"></asp:Button>
</div>
</form>
</td>
<td>
<div style="font:bold 20pt arial; margin:5px 0px 0px 5px">
ChartDirector Financial Chart Demonstration
</div>
<hr style="border:solid 1px #000080" />
<br />
<chart:webchartviewer id="WebChartViewer1" runat="server" ImageAlign="Top" />
</td>
</tr>
</table>
</body>
</html>
[ASP.NET Web Forms - VB Version] NetWebCharts\VBNetASP\financedemo.aspx
(Click here on how to convert this code to code-behind style.)<%@ Page Language="VB" Debug="true" %>
<%@ Import Namespace="ChartDirector" %>
<%@ Register TagPrefix="chart" Namespace="ChartDirector" Assembly="netchartdir" %>
<script runat="server">
' The timeStamps, volume, high, low, open and close data
Dim timeStamps() As Date = Nothing
Dim volData() As Double = Nothing
Dim highData() As Double = Nothing
Dim lowData() As Double = Nothing
Dim openData() As Double = Nothing
Dim closeData() As Double = Nothing
' An extra data series to compare with the close data
Dim compareData() As Double = Nothing
' The resolution of the data in seconds. 1 day = 86400 seconds.
Dim resolution As Integer = 86400
'/ <summary>
'/ Get the timeStamps, highData, lowData, openData, closeData and volData.
'/ </summary>
'/ <param name="ticker">The ticker symbol for the data series.</param>
'/ <param name="startDate">The starting date/time for the data series.</param>
'/ <param name="endDate">The ending date/time for the data series.</param>
'/ <param name="durationInDays">The number of trading days to get.</param>
'/ <param name="extraPoints">The extra leading data points needed in order to
'/ compute moving averages.</param>
'/ <returns>True if successfully obtain the data, otherwise false.</returns>
Protected Function getData(ticker As String, startDate As Date, endDate As Date, _
durationInDays As Integer, extraPoints As Integer) As Boolean
' This method should return false if the ticker symbol is invalid. In this sample code, as we
' are using a random number generator for the data, all ticker symbol is allowed, but we still
' assumed an empty symbol is invalid.
If ticker = "" Then
Return False
End If
' In this demo, we can get 15 min, daily, weekly or monthly data depending on the time range.
resolution = 86400
If durationInDays <= 10 Then
' 10 days or less, we assume 15 minute data points are available
resolution = 900
' We need to adjust the startDate backwards for the extraPoints. We assume 6.5 hours trading
' time per day, and 5 trading days per week.
Dim dataPointsPerDay As Double = 6.5 * 3600 / resolution
Dim adjustedStartDate As Date = startDate.AddDays(-Math.Ceiling(extraPoints / _
dataPointsPerDay * 7 / 5) - 2)
' Get the required 15 min data
get15MinData(ticker, adjustedStartDate, endDate)
ElseIf durationInDays >= 4.5 * 360 Then
' 4 years or more - use monthly data points.
resolution = 30 * 86400
' Adjust startDate backwards to cater for extraPoints
Dim adjustedStartDate As Date = startDate.Date.AddMonths(-extraPoints)
' Get the required monthly data
getMonthlyData(ticker, adjustedStartDate, endDate)
ElseIf durationInDays >= 1.5 * 360 Then
' 1 year or more - use weekly points.
resolution = 7 * 86400
' Adjust startDate backwards to cater for extraPoints
Dim adjustedStartDate As Date = startDate.Date.AddDays(-extraPoints * 7 - 6)
' Get the required weekly data
getWeeklyData(ticker, adjustedStartDate, endDate)
Else
' Default - use daily points
resolution = 86400
' Adjust startDate backwards to cater for extraPoints. We multiply the days by 7/5 as we
' assume 1 week has 5 trading days.
Dim adjustedStartDate As Date = startDate.Date.AddDays(-Math.Ceiling(extraPoints * 7.0 / 5 _
) - 2)
' Get the required daily data
getDailyData(ticker, adjustedStartDate, endDate)
End If
Return True
End Function
'/ <summary>
'/ Get 15 minutes data series for timeStamps, highData, lowData, openData, closeData
'/ and volData.
'/ </summary>
'/ <param name="ticker">The ticker symbol for the data series.</param>
'/ <param name="startDate">The starting date/time for the data series.</param>
'/ <param name="endDate">The ending date/time for the data series.</param>
Protected Sub get15MinData(ticker As String, startDate As Date, endDate As Date)
'
' In this demo, we use a random number generator to generate the data. In practice, you may get
' the data from a database or by other means. If you do not have 15 minute data, you may modify
' the "drawChart" method below to not using 15 minute data.
'
generateRandomData(ticker, startDate, endDate, 900)
End Sub
'/ <summary>
'/ Get daily data series for timeStamps, highData, lowData, openData, closeData
'/ and volData.
'/ </summary>
'/ <param name="ticker">The ticker symbol for the data series.</param>
'/ <param name="startDate">The starting date/time for the data series.</param>
'/ <param name="endDate">The ending date/time for the data series.</param>
Protected Sub getDailyData(ticker As String, startDate As Date, endDate As Date)
'
' In this demo, we use a random number generator to generate the data. In practice, you may get
' the data from a database or by other means.
'
' A typical database code example is like below. (This only shows a general idea. The exact
' details may differ depending on your database brand and schema. The SQL, in particular the
' date format, may be different depending on which brand of database you use.)
'
' ' Open the database connection to MS SQL
' Dim dbconn As System.Data.IDbConnection = New System.Data.SqlClient.SqlConnection(
' "..... put your database connection string here .......")
' dbconn.Open()
'
' ' SQL statement to get the data
' Dim sqlCmd As System.Data.IDbCommand = dbconn.CreateCommand()
' sqlCmd.CommandText = "Select recordDate, highData, lowData, openData, " & _
' "closeData, volData From dailyFinanceTable Where ticker = '" & ticker & _
' "' And recordDate >= '" & startDate.ToString("yyyyMMdd") & "' And " & _
' "recordDate <= '" & endDate.ToString("yyyyMMdd") & "' Order By recordDate"
'
' ' The most convenient way to read the SQL result into arrays is to use the
' ' ChartDirector DBTable utility.
' Dim table As DBTable = New DBTable(sqlCmd.ExecuteReader())
' dbconn.Close()
'
' ' Now get the data into arrays
' timeStamps = table.getColAsDateTime(0)
' highData = table.getCol(1)
' lowData = table.getCol(2)
' openData = table.getCol(3)
' closeData = table.getCol(4)
' volData = table.getCol(5)
'
generateRandomData(ticker, startDate, endDate, 86400)
End Sub
'/ <summary>
'/ Get weekly data series for timeStamps, highData, lowData, openData, closeData
'/ and volData.
'/ </summary>
'/ <param name="ticker">The ticker symbol for the data series.</param>
'/ <param name="startDate">The starting date/time for the data series.</param>
'/ <param name="endDate">The ending date/time for the data series.</param>
Protected Sub getWeeklyData(ticker As String, startDate As Date, endDate As Date)
'
' If you do not have weekly data, you may call "getDailyData(startDate, endDate)" to get daily
' data, then call "convertDailyToWeeklyData()" to convert to weekly data.
'
generateRandomData(ticker, startDate, endDate, 86400 * 7)
End Sub
'/ <summary>
'/ Get monthly data series for timeStamps, highData, lowData, openData, closeData
'/ and volData.
'/ </summary>
'/ <param name="ticker">The ticker symbol for the data series.</param>
'/ <param name="startDate">The starting date/time for the data series.</param>
'/ <param name="endDate">The ending date/time for the data series.</param>
Protected Sub getMonthlyData(ticker As String, startDate As Date, endDate As Date)
'
' If you do not have weekly data, you may call "getDailyData(startDate, endDate)" to get daily
' data, then call "convertDailyToMonthlyData()" to convert to monthly data.
'
generateRandomData(ticker, startDate, endDate, 86400 * 30)
End Sub
'/ <summary>
'/ A random number generator designed to generate realistic financial data.
'/ </summary>
'/ <param name="ticker">The ticker symbol for the data series.</param>
'/ <param name="startDate">The starting date/time for the data series.</param>
'/ <param name="endDate">The ending date/time for the data series.</param>
'/ <param name="resolution">The period of the data series.</param>
Protected Sub generateRandomData(ticker As String, startDate As Date, endDate As Date, _
resolution As Integer)
Dim db As FinanceSimulator = New FinanceSimulator(ticker, startDate, endDate, resolution)
timeStamps = db.getTimeStamps()
highData = db.getHighData()
lowData = db.getLowData()
openData = db.getOpenData()
closeData = db.getCloseData()
volData = db.getVolData()
End Sub
'/ <summary>
'/ A utility to convert daily to weekly data.
'/ </summary>
Protected Sub convertDailyToWeeklyData()
aggregateData(New ArrayMath(timeStamps).selectStartOfWeek())
End Sub
'/ <summary>
'/ A utility to convert daily to monthly data.
'/ </summary>
Protected Sub convertDailyToMonthlyData()
aggregateData(New ArrayMath(timeStamps).selectStartOfMonth())
End Sub
'/ <summary>
'/ An internal method used to aggregate daily data.
'/ </summary>
Protected Sub aggregateData(aggregator As ArrayMath)
timeStamps = Chart.NTime(aggregator.aggregate(Chart.CTime(timeStamps), Chart.AggregateFirst))
highData = aggregator.aggregate(highData, Chart.AggregateMax)
lowData = aggregator.aggregate(lowData, Chart.AggregateMin)
openData = aggregator.aggregate(openData, Chart.AggregateFirst)
closeData = aggregator.aggregate(closeData, Chart.AggregateLast)
volData = aggregator.aggregate(volData, Chart.AggregateSum)
End Sub
'/ <summary>
'/ Create a financial chart according to user selections. The user selections are
'/ encoded in the query parameters.
'/ </summary>
Public Function drawChart() As BaseChart
' In this demo, we just assume we plot up to the latest time. So end date is now.
Dim endDate As Date = Now
' If the trading day has not yet started (before 9:30am), or if the end date is on on Sat or
' Sun, we set the end date to 4:00pm of the last trading day
Do While (endDate.TimeOfDay.CompareTo(New TimeSpan(9, 30, 0)) < 0) OrElse (endDate.DayOfWeek = _
DayOfWeek.Sunday) OrElse (endDate.DayOfWeek = DayOfWeek.Saturday)
endDate = endDate.Date.AddDays(-1).Add(New TimeSpan(16, 0, 0))
Loop
' The duration selected by the user
Dim durationInDays As Integer = CInt(TimeRange.SelectedItem.Value)
' Compute the start date by subtracting the duration from the end date.
Dim startDate As Date = endDate
If durationInDays >= 30 Then
' More or equal to 30 days - so we use months as the unit
startDate = New DateTime(endDate.Year, endDate.Month, 1).AddMonths(-durationInDays / 30)
Else
' Less than 30 days - use day as the unit. The starting point of the axis is always at the
' start of the day (9:30am). Note that we use trading days, so we skip Sat and Sun in
' counting the days.
startDate = endDate.Date
For i As Integer = 1 To durationInDays - 1
If startDate.DayOfWeek = DayOfWeek.Monday Then
startDate = startDate.AddDays(-3)
Else
startDate = startDate.AddDays(-1)
End If
Next
End If
' The moving average periods selected by the user.
Dim avgPeriod1 As Integer = 0
If isNumeric(movAvg1.Text) Then
avgPeriod1 = CInt(movAvg1.Text)
Else
avgPeriod1 = 0
End If
Dim avgPeriod2 As Integer = 0
If isNumeric(movAvg2.Text) Then
avgPeriod2 = CInt(movAvg2.Text)
Else
avgPeriod2 = 0
End If
If avgPeriod1 < 0 Then
avgPeriod1 = 0
ElseIf avgPeriod1 > 300 Then
avgPeriod1 = 300
End If
If avgPeriod2 < 0 Then
avgPeriod2 = 0
ElseIf avgPeriod2 > 300 Then
avgPeriod2 = 300
End If
' We need extra leading data points in order to compute moving averages.
Dim extraPoints As Integer = 20
If avgPeriod1 > extraPoints Then
extraPoints = avgPeriod1
End If
If avgPeriod2 > extraPoints Then
extraPoints = avgPeriod2
End If
' Get the data series to compare with, if any.
Dim compareKey As String = Trim(CompareWith.Text)
compareData = Nothing
If getData(compareKey, startDate, endDate, durationInDays, extraPoints) Then
compareData = closeData
End If
' The data series we want to get.
Dim tickerKey As String = Trim(TickerSymbol.Text)
If Not getData(tickerKey, startDate, endDate, durationInDays, extraPoints) Then
Return errMsg("Please enter a valid ticker symbol")
End If
' We now confirm the actual number of extra points (data points that are before the start date)
' as inferred using actual data from the database.
extraPoints = UBound(timeStamps) + 1
For i As Integer = 0 To UBound(timeStamps)
If timeStamps(i) >= startDate Then
extraPoints = i
Exit For
End If
Next
' Check if there is any valid data
If extraPoints >= UBound(timeStamps) + 1 Then
' No data - just display the no data message.
Return errMsg("No data available for the specified time period")
End If
' In some finance chart presentation style, even if the data for the latest day is not fully
' available, the axis for the entire day will still be drawn, where no data will appear near the
' end of the axis.
If resolution < 86400 Then
' Add extra points to the axis until it reaches the end of the day. The end of day is
' assumed to be 16:00 (it depends on the stock exchange).
Dim lastTime As Date = timeStamps(UBound(timeStamps))
Dim extraTrailingPoints As Integer = Int(New TimeSpan(16, 0, 0).Subtract( _
lastTime.TimeOfDay).TotalSeconds / resolution)
If extraTrailingPoints > 0 Then
Dim extendedTimeStamps(timeStamps.Length + extraTrailingPoints - 1) As Date
Array.Copy(timeStamps, 0, extendedTimeStamps, 0, timeStamps.Length)
For i As Integer = 0 To extraTrailingPoints - 1
extendedTimeStamps(i + timeStamps.Length) = lastTime.AddSeconds(resolution * (i + _
1))
Next
timeStamps = extendedTimeStamps
End If
End If
'
' At this stage, all data are available. We can draw the chart as according to user input.
'
'
' Determine the chart size. In this demo, user can select 4 different chart sizes. Default is
' the large chart size.
'
Dim width As Integer = 780
Dim mainHeight As Integer = 255
Dim indicatorHeight As Integer = 80
Dim size As String = ChartSize.SelectedItem.Value
If size = "S" Then
' Small chart size
width = 450
mainHeight = 160
indicatorHeight = 60
ElseIf size = "M" Then
' Medium chart size
width = 620
mainHeight = 215
indicatorHeight = 70
ElseIf size = "H" Then
' Huge chart size
width = 1000
mainHeight = 320
indicatorHeight = 90
End If
' Create the chart object using the selected size
Dim m As FinanceChart = New FinanceChart(width)
' Set the data into the chart object
m.setData(timeStamps, highData, lowData, openData, closeData, volData, extraPoints)
'
' We configure the title of the chart. In this demo chart design, we put the company name as the
' top line of the title with left alignment.
'
m.addPlotAreaTitle(Chart.TopLeft, tickerKey)
' We displays the current date as well as the data resolution on the next line.
Dim resolutionText As String = ""
If resolution = 30 * 86400 Then
resolutionText = "Monthly"
ElseIf resolution = 7 * 86400 Then
resolutionText = "Weekly"
ElseIf resolution = 86400 Then
resolutionText = "Daily"
ElseIf resolution = 900 Then
resolutionText = "15-min"
End If
m.addPlotAreaTitle(Chart.BottomLeft, "<*font=Arial,size=8*>" & m.formatValue(Now, _
"mmm dd, yyyy") & " - " & resolutionText & " chart")
' A copyright message at the bottom left corner the title area
m.addPlotAreaTitle(Chart.BottomRight, "<*font=Arial,size=8*>(c) Advanced Software Engineering")
'
' Add the first techical indicator according. In this demo, we draw the first indicator on top
' of the main chart.
'
addIndicator(m, Indicator1.SelectedItem.Value, indicatorHeight)
'
' Add the main chart
'
m.addMainChart(mainHeight)
'
' Set log or linear scale according to user preference
'
If LogScale.Checked Then
m.setLogScale(True)
End If
'
' Set axis labels to show data values or percentage change to user preference
'
If PercentageScale.Checked Then
m.setPercentageAxis()
End If
'
' Draw any price line the user has selected
'
Dim mainType As String = ChartType.SelectedItem.Value
If mainType = "Close" Then
m.addCloseLine(&H000040)
ElseIf mainType = "TP" Then
m.addTypicalPrice(&H000040)
ElseIf mainType = "WC" Then
m.addWeightedClose(&H000040)
ElseIf mainType = "Median" Then
m.addMedianPrice(&H000040)
End If
'
' Add comparison line if there is data for comparison
'
If Not (compareData Is Nothing) Then
If UBound(compareData) + 1 > extraPoints Then
m.addComparison(compareData, &H0000ff, compareKey)
End If
End If
'
' Add moving average lines.
'
addMovingAvg(m, avgType1.SelectedItem.Value, avgPeriod1, &H663300)
addMovingAvg(m, avgType2.SelectedItem.Value, avgPeriod2, &H9900ff)
'
' Draw candlesticks or OHLC symbols if the user has selected them.
'
If mainType = "CandleStick" Then
m.addCandleStick(&H33ff33, &Hff3333)
ElseIf mainType = "OHLC" Then
m.addHLOC(&H008800, &Hcc0000)
End If
'
' Add parabolic SAR if necessary
'
If ParabolicSAR.Checked Then
m.addParabolicSAR(0.02, 0.02, 0.2, Chart.DiamondShape, 5, &H008800, &H000000)
End If
'
' Add price band/channel/envelop to the chart according to user selection
'
Dim bandType As String = Band.SelectedItem.Value
If bandType = "BB" Then
m.addBollingerBand(20, 2, &H9999ff, &Hc06666ff)
ElseIf bandType = "DC" Then
m.addDonchianChannel(20, &H9999ff, &Hc06666ff)
ElseIf bandType = "Envelop" Then
m.addEnvelop(20, 0.1, &H9999ff, &Hc06666ff)
End If
'
' Add volume bars to the main chart if necessary
'
If Volume.Checked Then
m.addVolBars(indicatorHeight, &H99ff99, &Hff9999, &Hc0c0c0)
End If
'
' Add additional indicators as according to user selection.
'
addIndicator(m, Indicator2.SelectedItem.Value, indicatorHeight)
addIndicator(m, Indicator3.SelectedItem.Value, indicatorHeight)
addIndicator(m, Indicator4.SelectedItem.Value, indicatorHeight)
Return m
End Function
'/ <summary>
'/ Add a moving average line to the FinanceChart object.
'/ </summary>
'/ <param name="m">The FinanceChart object to add the line to.</param>
'/ <param name="avgType">The moving average type (SMA/EMA/TMA/WMA).</param>
'/ <param name="avgPeriod">The moving average period.</param>
'/ <param name="color">The color of the line.</param>
'/ <returns>The LineLayer object representing line layer created.</returns>
Protected Function addMovingAvg(m As FinanceChart, avgType As String, avgPeriod As Integer, _
color As Integer) As LineLayer
If avgPeriod > 1 Then
If avgType = "SMA" Then
Return m.addSimpleMovingAvg(avgPeriod, color)
ElseIf avgType = "EMA" Then
Return m.addExpMovingAvg(avgPeriod, color)
ElseIf avgType = "TMA" Then
Return m.addTriMovingAvg(avgPeriod, color)
ElseIf avgType = "WMA" Then
Return m.addWeightedMovingAvg(avgPeriod, color)
End If
End If
Return Nothing
End Function
'/ <summary>
'/ Add an indicator chart to the FinanceChart object. In this demo example, the
'/ indicator parameters (such as the period used to compute RSI, colors of the lines,
'/ etc.) are hard coded to commonly used values. You are welcome to design a more
'/ complex user interface to allow users to set the parameters.
'/ </summary>
'/ <param name="m">The FinanceChart object to add the line to.</param>
'/ <param name="indicator">The selected indicator.</param>
'/ <param name="height">Height of the chart in pixels</param>
'/ <returns>The XYChart object representing indicator chart.</returns>
Protected Function addIndicator(m As FinanceChart, indicator As String, height As Integer) As _
XYChart
If indicator = "RSI" Then
Return m.addRSI(height, 14, &H800080, 20, &Hff6666, &H6666ff)
ElseIf indicator = "StochRSI" Then
Return m.addStochRSI(height, 14, &H800080, 30, &Hff6666, &H6666ff)
ElseIf indicator = "MACD" Then
Return m.addMACD(height, 26, 12, 9, &H0000ff, &Hff00ff, &H008000)
ElseIf indicator = "FStoch" Then
Return m.addFastStochastic(height, 14, 3, &H006060, &H606000)
ElseIf indicator = "SStoch" Then
Return m.addSlowStochastic(height, 14, 3, &H006060, &H606000)
ElseIf indicator = "ATR" Then
Return m.addATR(height, 14, &H808080, &H0000ff)
ElseIf indicator = "ADX" Then
Return m.addADX(height, 14, &H008000, &H800000, &H000080)
ElseIf indicator = "DCW" Then
Return m.addDonchianWidth(height, 20, &H0000ff)
ElseIf indicator = "BBW" Then
Return m.addBollingerWidth(height, 20, 2, &H0000ff)
ElseIf indicator = "DPO" Then
Return m.addDPO(height, 20, &H0000ff)
ElseIf indicator = "PVT" Then
Return m.addPVT(height, &H0000ff)
ElseIf indicator = "Momentum" Then
Return m.addMomentum(height, 12, &H0000ff)
ElseIf indicator = "Performance" Then
Return m.addPerformance(height, &H0000ff)
ElseIf indicator = "ROC" Then
Return m.addROC(height, 12, &H0000ff)
ElseIf indicator = "OBV" Then
Return m.addOBV(height, &H0000ff)
ElseIf indicator = "AccDist" Then
Return m.addAccDist(height, &H0000ff)
ElseIf indicator = "CLV" Then
Return m.addCLV(height, &H0000ff)
ElseIf indicator = "WilliamR" Then
Return m.addWilliamR(height, 14, &H800080, 30, &Hff6666, &H6666ff)
ElseIf indicator = "Aroon" Then
Return m.addAroon(height, 14, &H339933, &H333399)
ElseIf indicator = "AroonOsc" Then
Return m.addAroonOsc(height, 14, &H0000ff)
ElseIf indicator = "CCI" Then
Return m.addCCI(height, 20, &H800080, 100, &Hff6666, &H6666ff)
ElseIf indicator = "EMV" Then
Return m.addEaseOfMovement(height, 9, &H006060, &H606000)
ElseIf indicator = "MDX" Then
Return m.addMassIndex(height, &H800080, &Hff6666, &H6666ff)
ElseIf indicator = "CVolatility" Then
Return m.addChaikinVolatility(height, 10, 10, &H0000ff)
ElseIf indicator = "COscillator" Then
Return m.addChaikinOscillator(height, &H0000ff)
ElseIf indicator = "CMF" Then
Return m.addChaikinMoneyFlow(height, 21, &H008000)
ElseIf indicator = "NVI" Then
Return m.addNVI(height, 255, &H0000ff, &H883333)
ElseIf indicator = "PVI" Then
Return m.addPVI(height, 255, &H0000ff, &H883333)
ElseIf indicator = "MFI" Then
Return m.addMFI(height, 14, &H800080, 30, &Hff6666, &H6666ff)
ElseIf indicator = "PVO" Then
Return m.addPVO(height, 26, 12, 9, &H0000ff, &Hff00ff, &H008000)
ElseIf indicator = "PPO" Then
Return m.addPPO(height, 26, 12, 9, &H0000ff, &Hff00ff, &H008000)
ElseIf indicator = "UO" Then
Return m.addUltimateOscillator(height, 7, 14, 28, &H800080, 20, &Hff6666, &H6666ff)
ElseIf indicator = "Vol" Then
Return m.addVolIndicator(height, &H99ff99, &Hff9999, &Hc0c0c0)
ElseIf indicator = "TRIX" Then
Return m.addTRIX(height, 12, &H0000ff)
End If
Return Nothing
End Function
'/ <summary>
'/ Creates a dummy chart to show an error message.
'/ </summary>
'/ <param name="msg">The error message.
'/ <returns>The BaseChart object containing the error message.</returns>
Protected Function errMsg(msg As String) As BaseChart
Dim m As MultiChart = New MultiChart(400, 200)
m.addTitle2(Chart.Center, msg, "Arial", 10).setMaxWidth(m.getWidth())
Return m
End Function
'
' Page Load event handler
'
Private Sub Page_Load(sender As System.Object, e As System.EventArgs)
' Create the finance chart
Dim c As BaseChart = drawChart()
' Output the chart
WebChartViewer1.Image = c.makeWebImage(Chart.SVG)
End Sub
</script>
<!DOCTYPE html>
<html>
<head>
<title>ChartDirector Financial Chart Demonstration</title>
<style>
.inputtitle {font:11px verdana; margin:10px 5px;}
.input {font:11px verdana}
</style>
</head>
<body style="margin:0px">
<table style="border:0px; padding:0px; border-spacing:0px;">
<tr>
<td align="right" colspan="2" style="background:#000088">
<div style="padding:0px 3px 2px 0px; font:bold italic 10pt arial;">
<a style="color:#ffff00; text-decoration:none" href="http://www.advsofteng.com">
Advanced Software Engineering
</a>
</div>
</td>
</tr>
<tr valign="top">
<td style="width:150px; background:#bbddff">
<form id="Form1" method="post" runat="server">
<div class="inputtitle">
<b>Ticker Symbol</b><br />
<asp:TextBox runat="server" id="TickerSymbol" class="input" style="width:140px;">ASE.SYMBOL</asp:TextBox>
</div>
<div class="inputtitle">
<b>Compare With</b><br />
<asp:TextBox runat="server" id="CompareWith" class="input" style="width:140px;"></asp:TextBox>
</div>
<div class="inputtitle">
<b>Time Period</b><br />
<asp:DropDownList runat="server" id="TimeRange" class="input" style="width:140px;">
<asp:ListItem value="1">1 day</asp:ListItem>
<asp:ListItem value="2">2 days</asp:ListItem>
<asp:ListItem value="5">5 days</asp:ListItem>
<asp:ListItem value="10">10 days</asp:ListItem>
<asp:ListItem value="30">1 month</asp:ListItem>
<asp:ListItem value="60">2 months</asp:ListItem>
<asp:ListItem value="90">3 months</asp:ListItem>
<asp:ListItem value="180" Selected="True">6 months</asp:ListItem>
<asp:ListItem value="360">1 year</asp:ListItem>
<asp:ListItem value="720">2 years</asp:ListItem>
<asp:ListItem value="1080">3 years</asp:ListItem>
<asp:ListItem value="1440">4 years</asp:ListItem>
<asp:ListItem value="1800">5 years</asp:ListItem>
<asp:ListItem value="3600">10 years</asp:ListItem>
</asp:DropDownList>
</div>
<div class="inputtitle">
<b>Chart Size</b><br />
<asp:DropDownList runat="server" id="ChartSize" class="input" style="width:140px;">
<asp:ListItem value="S">Small</asp:ListItem>
<asp:ListItem value="M">Medium</asp:ListItem>
<asp:ListItem value="L" Selected="True">Large</asp:ListItem>
<asp:ListItem value="H">Huge</asp:ListItem>
</asp:DropDownList><br />
</div>
<div class="inputtitle">
<asp:CheckBox runat="server" Text="Show Volume Bars" id="Volume" Checked="True"></asp:CheckBox><br />
<asp:CheckBox runat="server" Text="Parabolic SAR" id="ParabolicSAR"></asp:CheckBox><br />
<asp:CheckBox runat="server" Text="Log Scale" id="LogScale"></asp:CheckBox><br />
<asp:CheckBox runat="server" Text="Percentage Scale" id="PercentageScale"></asp:CheckBox><br />
</div>
<div class="inputtitle">
<b>Chart Type</b><br />
<asp:DropDownList runat="server" id="ChartType" class="input" style="width:140px;">
<asp:ListItem value="None">None</asp:ListItem>
<asp:ListItem value="CandleStick" Selected="True">CandleStick</asp:ListItem>
<asp:ListItem value="Close">Closing Price</asp:ListItem>
<asp:ListItem value="Median">Median Price</asp:ListItem>
<asp:ListItem value="OHLC">OHLC</asp:ListItem>
<asp:ListItem value="TP">Typical Price</asp:ListItem>
<asp:ListItem value="WC">Weighted Close</asp:ListItem>
</asp:DropDownList>
</div>
<div class="inputtitle">
<b>Price Band</b><br />
<asp:DropDownList runat="server" id="Band" class="input" style="width:140px;">
<asp:ListItem value="None">None</asp:ListItem>
<asp:ListItem value="BB" Selected="True">Bollinger Band</asp:ListItem>
<asp:ListItem value="DC">Donchian Channel</asp:ListItem>
<asp:ListItem value="Envelop">Envelop (SMA 20 +/- 10%)</asp:ListItem>
</asp:DropDownList>
</div>
<div class="inputtitle">
<b>Moving Averages</b><br />
<asp:DropDownList runat="server" id="avgType1" class="input" style="width:105px;">
<asp:ListItem value="None">None</asp:ListItem>
<asp:ListItem value="SMA" Selected="True">Simple</asp:ListItem>
<asp:ListItem value="EMA">Exponential</asp:ListItem>
<asp:ListItem value="TMA">Triangular</asp:ListItem>
<asp:ListItem value="WMA">Weighted</asp:ListItem>
</asp:DropDownList>
<asp:TextBox runat="server" id="movAvg1" class="input" style="width:30px;">10</asp:TextBox><br />
<asp:DropDownList runat="server" id="avgType2" class="input" style="width:105px;">
<asp:ListItem value="None">None</asp:ListItem>
<asp:ListItem value="SMA" Selected="True">Simple</asp:ListItem>
<asp:ListItem value="EMA">Exponential</asp:ListItem>
<asp:ListItem value="TMA">Triangular</asp:ListItem>
<asp:ListItem value="WMA">Weighted</asp:ListItem>
</asp:DropDownList>
<asp:TextBox runat="server" id="movAvg2" class="input" style="width:30px;">25</asp:TextBox><br />
</div>
<div class="inputtitle">
<b>Technical Indicators</b><br />
<asp:DropDownList runat="server" id="Indicator1" class="input" style="width:140px;">
<asp:ListItem value="None">None</asp:ListItem>
<asp:ListItem value="AccDist">Accumulation/Distribution</asp:ListItem>
<asp:ListItem value="AroonOsc">Aroon Oscillator</asp:ListItem>
<asp:ListItem value="Aroon">Aroon Up/Down</asp:ListItem>
<asp:ListItem value="ADX">Avg Directional Index</asp:ListItem>
<asp:ListItem value="ATR">Avg True Range</asp:ListItem>
<asp:ListItem value="BBW">Bollinger Band Width</asp:ListItem>
<asp:ListItem value="CMF">Chaikin Money Flow</asp:ListItem>
<asp:ListItem value="COscillator">Chaikin Oscillator</asp:ListItem>
<asp:ListItem value="CVolatility">Chaikin Volatility</asp:ListItem>
<asp:ListItem value="CLV">Close Location Value</asp:ListItem>
<asp:ListItem value="CCI">Commodity Channel Index</asp:ListItem>
<asp:ListItem value="DPO">Detrended Price Osc</asp:ListItem>
<asp:ListItem value="DCW">Donchian Channel Width</asp:ListItem>
<asp:ListItem value="EMV">Ease of Movement</asp:ListItem>
<asp:ListItem value="FStoch">Fast Stochastic</asp:ListItem>
<asp:ListItem value="MACD">MACD</asp:ListItem>
<asp:ListItem value="MDX">Mass Index</asp:ListItem>
<asp:ListItem value="Momentum">Momentum</asp:ListItem>
<asp:ListItem value="MFI">Money Flow Index</asp:ListItem>
<asp:ListItem value="NVI">Neg Volume Index</asp:ListItem>
<asp:ListItem value="OBV">On Balance Volume</asp:ListItem>
<asp:ListItem value="Performance">Performance</asp:ListItem>
<asp:ListItem value="PPO">% Price Oscillator</asp:ListItem>
<asp:ListItem value="PVO">% Volume Oscillator</asp:ListItem>
<asp:ListItem value="PVI">Pos Volume Index</asp:ListItem>
<asp:ListItem value="PVT">Price Volume Trend</asp:ListItem>
<asp:ListItem value="ROC">Rate of Change</asp:ListItem>
<asp:ListItem value="RSI" Selected="True">RSI</asp:ListItem>
<asp:ListItem value="SStoch">Slow Stochastic</asp:ListItem>
<asp:ListItem value="StochRSI">StochRSI</asp:ListItem>
<asp:ListItem value="TRIX">TRIX</asp:ListItem>
<asp:ListItem value="UO">Ultimate Oscillator</asp:ListItem>
<asp:ListItem value="Vol">Volume</asp:ListItem>
<asp:ListItem value="WilliamR">William's %R</asp:ListItem>
</asp:DropDownList><br />
<asp:DropDownList runat="server" id="Indicator2" class="input" style="width:140px;">
<asp:ListItem value="None">None</asp:ListItem>
<asp:ListItem value="AccDist">Accumulation/Distribution</asp:ListItem>
<asp:ListItem value="AroonOsc">Aroon Oscillator</asp:ListItem>
<asp:ListItem value="Aroon">Aroon Up/Down</asp:ListItem>
<asp:ListItem value="ADX">Avg Directional Index</asp:ListItem>
<asp:ListItem value="ATR">Avg True Range</asp:ListItem>
<asp:ListItem value="BBW">Bollinger Band Width</asp:ListItem>
<asp:ListItem value="CMF">Chaikin Money Flow</asp:ListItem>
<asp:ListItem value="COscillator">Chaikin Oscillator</asp:ListItem>
<asp:ListItem value="CVolatility">Chaikin Volatility</asp:ListItem>
<asp:ListItem value="CLV">Close Location Value</asp:ListItem>
<asp:ListItem value="CCI">Commodity Channel Index</asp:ListItem>
<asp:ListItem value="DPO">Detrended Price Osc</asp:ListItem>
<asp:ListItem value="DCW">Donchian Channel Width</asp:ListItem>
<asp:ListItem value="EMV">Ease of Movement</asp:ListItem>
<asp:ListItem value="FStoch">Fast Stochastic</asp:ListItem>
<asp:ListItem value="MACD" Selected="True">MACD</asp:ListItem>
<asp:ListItem value="MDX">Mass Index</asp:ListItem>
<asp:ListItem value="Momentum">Momentum</asp:ListItem>
<asp:ListItem value="MFI">Money Flow Index</asp:ListItem>
<asp:ListItem value="NVI">Neg Volume Index</asp:ListItem>
<asp:ListItem value="OBV">On Balance Volume</asp:ListItem>
<asp:ListItem value="Performance">Performance</asp:ListItem>
<asp:ListItem value="PPO">% Price Oscillator</asp:ListItem>
<asp:ListItem value="PVO">% Volume Oscillator</asp:ListItem>
<asp:ListItem value="PVI">Pos Volume Index</asp:ListItem>
<asp:ListItem value="PVT">Price Volume Trend</asp:ListItem>
<asp:ListItem value="ROC">Rate of Change</asp:ListItem>
<asp:ListItem value="RSI">RSI</asp:ListItem>
<asp:ListItem value="SStoch">Slow Stochastic</asp:ListItem>
<asp:ListItem value="StochRSI">StochRSI</asp:ListItem>
<asp:ListItem value="TRIX">TRIX</asp:ListItem>
<asp:ListItem value="UO">Ultimate Oscillator</asp:ListItem>
<asp:ListItem value="Vol">Volume</asp:ListItem>
<asp:ListItem value="WilliamR">William's %R</asp:ListItem>
</asp:DropDownList><br />
<asp:DropDownList runat="server" id="Indicator3" class="input" style="width:140px;">
<asp:ListItem value="None" Selected="True">None</asp:ListItem>
<asp:ListItem value="AccDist">Accumulation/Distribution</asp:ListItem>
<asp:ListItem value="AroonOsc">Aroon Oscillator</asp:ListItem>
<asp:ListItem value="Aroon">Aroon Up/Down</asp:ListItem>
<asp:ListItem value="ADX">Avg Directional Index</asp:ListItem>
<asp:ListItem value="ATR">Avg True Range</asp:ListItem>
<asp:ListItem value="BBW">Bollinger Band Width</asp:ListItem>
<asp:ListItem value="CMF">Chaikin Money Flow</asp:ListItem>
<asp:ListItem value="COscillator">Chaikin Oscillator</asp:ListItem>
<asp:ListItem value="CVolatility">Chaikin Volatility</asp:ListItem>
<asp:ListItem value="CLV">Close Location Value</asp:ListItem>
<asp:ListItem value="CCI">Commodity Channel Index</asp:ListItem>
<asp:ListItem value="DPO">Detrended Price Osc</asp:ListItem>
<asp:ListItem value="DCW">Donchian Channel Width</asp:ListItem>
<asp:ListItem value="EMV">Ease of Movement</asp:ListItem>
<asp:ListItem value="FStoch">Fast Stochastic</asp:ListItem>
<asp:ListItem value="MACD">MACD</asp:ListItem>
<asp:ListItem value="MDX">Mass Index</asp:ListItem>
<asp:ListItem value="Momentum">Momentum</asp:ListItem>
<asp:ListItem value="MFI">Money Flow Index</asp:ListItem>
<asp:ListItem value="NVI">Neg Volume Index</asp:ListItem>
<asp:ListItem value="OBV">On Balance Volume</asp:ListItem>
<asp:ListItem value="Performance">Performance</asp:ListItem>
<asp:ListItem value="PPO">% Price Oscillator</asp:ListItem>
<asp:ListItem value="PVO">% Volume Oscillator</asp:ListItem>
<asp:ListItem value="PVI">Pos Volume Index</asp:ListItem>
<asp:ListItem value="PVT">Price Volume Trend</asp:ListItem>
<asp:ListItem value="ROC">Rate of Change</asp:ListItem>
<asp:ListItem value="RSI">RSI</asp:ListItem>
<asp:ListItem value="SStoch">Slow Stochastic</asp:ListItem>
<asp:ListItem value="StochRSI">StochRSI</asp:ListItem>
<asp:ListItem value="TRIX">TRIX</asp:ListItem>
<asp:ListItem value="UO">Ultimate Oscillator</asp:ListItem>
<asp:ListItem value="Vol">Volume</asp:ListItem>
<asp:ListItem value="WilliamR">William's %R</asp:ListItem>
</asp:DropDownList><br />
<asp:DropDownList runat="server" id="Indicator4" class="input" style="width:140px;">
<asp:ListItem value="None" Selected="True">None</asp:ListItem>
<asp:ListItem value="AccDist">Accumulation/Distribution</asp:ListItem>
<asp:ListItem value="AroonOsc">Aroon Oscillator</asp:ListItem>
<asp:ListItem value="Aroon">Aroon Up/Down</asp:ListItem>
<asp:ListItem value="ADX">Avg Directional Index</asp:ListItem>
<asp:ListItem value="ATR">Avg True Range</asp:ListItem>
<asp:ListItem value="BBW">Bollinger Band Width</asp:ListItem>
<asp:ListItem value="CMF">Chaikin Money Flow</asp:ListItem>
<asp:ListItem value="COscillator">Chaikin Oscillator</asp:ListItem>
<asp:ListItem value="CVolatility">Chaikin Volatility</asp:ListItem>
<asp:ListItem value="CLV">Close Location Value</asp:ListItem>
<asp:ListItem value="CCI">Commodity Channel Index</asp:ListItem>
<asp:ListItem value="DPO">Detrended Price Osc</asp:ListItem>
<asp:ListItem value="DCW">Donchian Channel Width</asp:ListItem>
<asp:ListItem value="EMV">Ease of Movement</asp:ListItem>
<asp:ListItem value="FStoch">Fast Stochastic</asp:ListItem>
<asp:ListItem value="MACD">MACD</asp:ListItem>
<asp:ListItem value="MDX">Mass Index</asp:ListItem>
<asp:ListItem value="Momentum">Momentum</asp:ListItem>
<asp:ListItem value="MFI">Money Flow Index</asp:ListItem>
<asp:ListItem value="NVI">Neg Volume Index</asp:ListItem>
<asp:ListItem value="OBV">On Balance Volume</asp:ListItem>
<asp:ListItem value="Performance">Performance</asp:ListItem>
<asp:ListItem value="PPO">% Price Oscillator</asp:ListItem>
<asp:ListItem value="PVO">% Volume Oscillator</asp:ListItem>
<asp:ListItem value="PVI">Pos Volume Index</asp:ListItem>
<asp:ListItem value="PVT">Price Volume Trend</asp:ListItem>
<asp:ListItem value="ROC">Rate of Change</asp:ListItem>
<asp:ListItem value="RSI">RSI</asp:ListItem>
<asp:ListItem value="SStoch">Slow Stochastic</asp:ListItem>
<asp:ListItem value="StochRSI">StochRSI</asp:ListItem>
<asp:ListItem value="TRIX">TRIX</asp:ListItem>
<asp:ListItem value="UO">Ultimate Oscillator</asp:ListItem>
<asp:ListItem value="Vol">Volume</asp:ListItem>
<asp:ListItem value="WilliamR">William's %R</asp:ListItem>
</asp:DropDownList>
</div>
<div class="inputtitle" style="text-align:center">
<asp:Button runat="server" id="Button1" class="input" Text="Update Chart"></asp:Button>
</div>
</form>
</td>
<td>
<div style="font:bold 20pt arial; margin:5px 0px 0px 5px">
ChartDirector Financial Chart Demonstration
</div>
<hr style="border:solid 1px #000080" />
<br />
<chart:webchartviewer id="WebChartViewer1" runat="server" ImageAlign="Top" />
</td>
</tr>
</table>
</body>
</html>
[ASP.NET MVC - Controller] NetMvcCharts\Controllers\FinancedemoController.cs
using System;
using System.Web.Mvc;
using ChartDirector;
namespace NetMvcCharts.Controllers
{
public class FinancedemoController : Controller
{
// The timeStamps, volume, high, low, open and close data
DateTime[] timeStamps = null;
double[] volData = null;
double[] highData = null;
double[] lowData = null;
double[] openData = null;
double[] closeData = null;
// An extra data series to compare with the close data
double[] compareData = null;
// The resolution of the data in seconds. 1 day = 86400 seconds.
int resolution = 86400;
/// <summary>
/// Get the timeStamps, highData, lowData, openData, closeData and volData.
/// </summary>
/// <param name="ticker">The ticker symbol for the data series.</param>
/// <param name="startDate">The starting date/time for the data series.</param>
/// <param name="endDate">The ending date/time for the data series.</param>
/// <param name="durationInDays">The number of trading days to get.</param>
/// <param name="extraPoints">The extra leading data points needed in order to
/// compute moving averages.</param>
/// <returns>True if successfully obtain the data, otherwise false.</returns>
protected bool getData(string ticker, DateTime startDate, DateTime endDate, int durationInDays,
int extraPoints)
{
// This method should return false if the ticker symbol is invalid. In this sample code, as
// we are using a random number generator for the data, all ticker symbol is allowed, but we
// still assumed an empty symbol is invalid.
if (ticker == "") {
return false;
}
// In this demo, we can get 15 min, daily, weekly or monthly data depending on the time
// range.
resolution = 86400;
if (durationInDays <= 10) {
// 10 days or less, we assume 15 minute data points are available
resolution = 900;
// We need to adjust the startDate backwards for the extraPoints. We assume 6.5 hours
// trading time per day, and 5 trading days per week.
double dataPointsPerDay = 6.5 * 3600 / resolution;
DateTime adjustedStartDate = startDate.AddDays(-Math.Ceiling(extraPoints /
dataPointsPerDay * 7 / 5) - 2);
// Get the required 15 min data
get15MinData(ticker, adjustedStartDate, endDate);
} else if (durationInDays >= 4.5 * 360) {
// 4 years or more - use monthly data points.
resolution = 30 * 86400;
// Adjust startDate backwards to cater for extraPoints
DateTime adjustedStartDate = startDate.Date.AddMonths(-extraPoints);
// Get the required monthly data
getMonthlyData(ticker, adjustedStartDate, endDate);
} else if (durationInDays >= 1.5 * 360) {
// 1 year or more - use weekly points.
resolution = 7 * 86400;
// Adjust startDate backwards to cater for extraPoints
DateTime adjustedStartDate = startDate.Date.AddDays(-extraPoints * 7 - 6);
// Get the required weekly data
getWeeklyData(ticker, adjustedStartDate, endDate);
} else {
// Default - use daily points
resolution = 86400;
// Adjust startDate backwards to cater for extraPoints. We multiply the days by 7/5 as we
// assume 1 week has 5 trading days.
DateTime adjustedStartDate = startDate.Date.AddDays(-Math.Ceiling(extraPoints * 7.0 / 5)
- 2);
// Get the required daily data
getDailyData(ticker, adjustedStartDate, endDate);
}
return true;
}
/// <summary>
/// Get 15 minutes data series for timeStamps, highData, lowData, openData, closeData
/// and volData.
/// </summary>
/// <param name="ticker">The ticker symbol for the data series.</param>
/// <param name="startDate">The starting date/time for the data series.</param>
/// <param name="endDate">The ending date/time for the data series.</param>
protected void get15MinData(string ticker, DateTime startDate, DateTime endDate)
{
//
// In this demo, we use a random number generator to generate the data. In practice, you may
// get the data from a database or by other means. If you do not have 15 minute data, you may
// modify the "drawChart" method below to not using 15 minute data.
//
generateRandomData(ticker, startDate, endDate, 900);
}
/// <summary>
/// Get daily data series for timeStamps, highData, lowData, openData, closeData
/// and volData.
/// </summary>
/// <param name="ticker">The ticker symbol for the data series.</param>
/// <param name="startDate">The starting date/time for the data series.</param>
/// <param name="endDate">The ending date/time for the data series.</param>
protected void getDailyData(string ticker, DateTime startDate, DateTime endDate)
{
//
// In this demo, we use a random number generator to generate the data. In practice, you may
// get the data from a database or by other means.
//
// A typical database code example is like below. (This only shows a general idea. The exact
// details may differ depending on your database brand and schema. The SQL, in particular the
// date format, may be different depending on which brand of database you use.)
//
// // Open the database connection to MS SQL
// System.Data.IDbConnection dbconn = new System.Data.SqlClient.SqlConnection(
// "..... put your database connection string here .......");
// dbconn.Open();
//
// // SQL statement to get the data
// System.Data.IDbCommand sqlCmd = dbconn.CreateCommand();
// sqlCmd.CommandText = "Select recordDate, highData, lowData, openData, " +
// "closeData, volData From dailyFinanceTable Where ticker = '" + ticker +
// "' And recordDate >= '" + startDate.ToString("yyyyMMdd") + "' And " +
// "recordDate <= '" + endDate.ToString("yyyyMMdd") + "' Order By recordDate";
//
// // The most convenient way to read the SQL result into arrays is to use the
// // ChartDirector DBTable utility.
// DBTable table = new DBTable(sqlCmd.ExecuteReader());
// dbconn.Close();
//
// // Now get the data into arrays
// timeStamps = table.getColAsDateTime(0);
// highData = table.getCol(1);
// lowData = table.getCol(2);
// openData = table.getCol(3);
// closeData = table.getCol(4);
// volData = table.getCol(5);
//
generateRandomData(ticker, startDate, endDate, 86400);
}
/// <summary>
/// Get weekly data series for timeStamps, highData, lowData, openData, closeData
/// and volData.
/// </summary>
/// <param name="ticker">The ticker symbol for the data series.</param>
/// <param name="startDate">The starting date/time for the data series.</param>
/// <param name="endDate">The ending date/time for the data series.</param>
protected void getWeeklyData(string ticker, DateTime startDate, DateTime endDate)
{
//
// If you do not have weekly data, you may call "getDailyData(startDate, endDate)" to get
// daily data, then call "convertDailyToWeeklyData()" to convert to weekly data.
//
generateRandomData(ticker, startDate, endDate, 86400 * 7);
}
/// <summary>
/// Get monthly data series for timeStamps, highData, lowData, openData, closeData
/// and volData.
/// </summary>
/// <param name="ticker">The ticker symbol for the data series.</param>
/// <param name="startDate">The starting date/time for the data series.</param>
/// <param name="endDate">The ending date/time for the data series.</param>
protected void getMonthlyData(string ticker, DateTime startDate, DateTime endDate)
{
//
// If you do not have weekly data, you may call "getDailyData(startDate, endDate)" to get
// daily data, then call "convertDailyToMonthlyData()" to convert to monthly data.
//
generateRandomData(ticker, startDate, endDate, 86400 * 30);
}
/// <summary>
/// A random number generator designed to generate realistic financial data.
/// </summary>
/// <param name="ticker">The ticker symbol for the data series.</param>
/// <param name="startDate">The starting date/time for the data series.</param>
/// <param name="endDate">The ending date/time for the data series.</param>
/// <param name="resolution">The period of the data series.</param>
protected void generateRandomData(string ticker, DateTime startDate, DateTime endDate,
int resolution)
{
FinanceSimulator db = new FinanceSimulator(ticker, startDate, endDate, resolution);
timeStamps = db.getTimeStamps();
highData = db.getHighData();
lowData = db.getLowData();
openData = db.getOpenData();
closeData = db.getCloseData();
volData = db.getVolData();
}
/// <summary>
/// A utility to convert daily to weekly data.
/// </summary>
protected void convertDailyToWeeklyData()
{
aggregateData(new ArrayMath(timeStamps).selectStartOfWeek());
}
/// <summary>
/// A utility to convert daily to monthly data.
/// </summary>
protected void convertDailyToMonthlyData()
{
aggregateData(new ArrayMath(timeStamps).selectStartOfMonth());
}
/// <summary>
/// An internal method used to aggregate daily data.
/// </summary>
protected void aggregateData(ArrayMath aggregator)
{
timeStamps = Chart.NTime(aggregator.aggregate(Chart.CTime(timeStamps), Chart.AggregateFirst))
;
highData = aggregator.aggregate(highData, Chart.AggregateMax);
lowData = aggregator.aggregate(lowData, Chart.AggregateMin);
openData = aggregator.aggregate(openData, Chart.AggregateFirst);
closeData = aggregator.aggregate(closeData, Chart.AggregateLast);
volData = aggregator.aggregate(volData, Chart.AggregateSum);
}
/// <summary>
/// Create a financial chart according to user selections. The user selections are
/// encoded in the query parameters.
/// </summary>
public BaseChart drawChart()
{
// In this demo, we just assume we plot up to the latest time. So end date is now.
DateTime endDate = DateTime.Now;
// If the trading day has not yet started (before 9:30am), or if the end date is on on Sat or
// Sun, we set the end date to 4:00pm of the last trading day
while ((endDate.TimeOfDay.CompareTo(new TimeSpan(9, 30, 0)) < 0) || (endDate.DayOfWeek ==
DayOfWeek.Sunday) || (endDate.DayOfWeek == DayOfWeek.Saturday)) {
endDate = endDate.Date.AddDays(-1).Add(new TimeSpan(16, 0, 0));
}
// The duration selected by the user
int durationInDays = int.Parse(Request["TimeRange"]);
// Compute the start date by subtracting the duration from the end date.
DateTime startDate = endDate;
if (durationInDays >= 30) {
// More or equal to 30 days - so we use months as the unit
startDate = new DateTime(endDate.Year, endDate.Month, 1).AddMonths(-durationInDays / 30);
} else {
// Less than 30 days - use day as the unit. The starting point of the axis is always at
// the start of the day (9:30am). Note that we use trading days, so we skip Sat and Sun
// in counting the days.
startDate = endDate.Date;
for(int i = 1; i < durationInDays; ++i) {
if (startDate.DayOfWeek == DayOfWeek.Monday) {
startDate = startDate.AddDays(-3);
} else {
startDate = startDate.AddDays(-1);
}
}
}
// The moving average periods selected by the user.
int avgPeriod1 = 0;
int.TryParse(Request["movAvg1"], out avgPeriod1);
int avgPeriod2 = 0;
int.TryParse(Request["movAvg2"], out avgPeriod2);
if (avgPeriod1 < 0) {
avgPeriod1 = 0;
} else if (avgPeriod1 > 300) {
avgPeriod1 = 300;
}
if (avgPeriod2 < 0) {
avgPeriod2 = 0;
} else if (avgPeriod2 > 300) {
avgPeriod2 = 300;
}
// We need extra leading data points in order to compute moving averages.
int extraPoints = 20;
if (avgPeriod1 > extraPoints) {
extraPoints = avgPeriod1;
}
if (avgPeriod2 > extraPoints) {
extraPoints = avgPeriod2;
}
// Get the data series to compare with, if any.
string compareKey = Request["CompareWith"].Trim();
compareData = null;
if (getData(compareKey, startDate, endDate, durationInDays, extraPoints)) {
compareData = closeData;
}
// The data series we want to get.
string tickerKey = Request["TickerSymbol"].Trim();
if (!getData(tickerKey, startDate, endDate, durationInDays, extraPoints)) {
return errMsg("Please enter a valid ticker symbol");
}
// We now confirm the actual number of extra points (data points that are before the start
// date) as inferred using actual data from the database.
extraPoints = timeStamps.Length;
for(int i = 0; i < timeStamps.Length; ++i) {
if (timeStamps[i] >= startDate) {
extraPoints = i;
break;
}
}
// Check if there is any valid data
if (extraPoints >= timeStamps.Length) {
// No data - just display the no data message.
return errMsg("No data available for the specified time period");
}
// In some finance chart presentation style, even if the data for the latest day is not fully
// available, the axis for the entire day will still be drawn, where no data will appear near
// the end of the axis.
if (resolution < 86400) {
// Add extra points to the axis until it reaches the end of the day. The end of day is
// assumed to be 16:00 (it depends on the stock exchange).
DateTime lastTime = timeStamps[timeStamps.Length - 1];
int extraTrailingPoints = (int)(new TimeSpan(16, 0, 0).Subtract(lastTime.TimeOfDay
).TotalSeconds / resolution);
if (extraTrailingPoints > 0) {
DateTime[] extendedTimeStamps = new DateTime[timeStamps.Length + extraTrailingPoints
];
Array.Copy(timeStamps, 0, extendedTimeStamps, 0, timeStamps.Length);
for(int i = 0; i < extraTrailingPoints; ++i) {
extendedTimeStamps[i + timeStamps.Length] = lastTime.AddSeconds(resolution * (i +
1));
}
timeStamps = extendedTimeStamps;
}
}
//
// At this stage, all data are available. We can draw the chart as according to user input.
//
//
// Determine the chart size. In this demo, user can select 4 different chart sizes. Default
// is the large chart size.
//
int width = 780;
int mainHeight = 255;
int indicatorHeight = 80;
string size = Request["ChartSize"];
if (size == "S") {
// Small chart size
width = 450;
mainHeight = 160;
indicatorHeight = 60;
} else if (size == "M") {
// Medium chart size
width = 620;
mainHeight = 215;
indicatorHeight = 70;
} else if (size == "H") {
// Huge chart size
width = 1000;
mainHeight = 320;
indicatorHeight = 90;
}
// Create the chart object using the selected size
FinanceChart m = new FinanceChart(width);
// Set the data into the chart object
m.setData(timeStamps, highData, lowData, openData, closeData, volData, extraPoints);
//
// We configure the title of the chart. In this demo chart design, we put the company name as
// the top line of the title with left alignment.
//
m.addPlotAreaTitle(Chart.TopLeft, tickerKey);
// We displays the current date as well as the data resolution on the next line.
string resolutionText = "";
if (resolution == 30 * 86400) {
resolutionText = "Monthly";
} else if (resolution == 7 * 86400) {
resolutionText = "Weekly";
} else if (resolution == 86400) {
resolutionText = "Daily";
} else if (resolution == 900) {
resolutionText = "15-min";
}
m.addPlotAreaTitle(Chart.BottomLeft, "<*font=Arial,size=8*>" + m.formatValue(DateTime.Now,
"mmm dd, yyyy") + " - " + resolutionText + " chart");
// A copyright message at the bottom left corner the title area
m.addPlotAreaTitle(Chart.BottomRight,
"<*font=Arial,size=8*>(c) Advanced Software Engineering");
//
// Add the first techical indicator according. In this demo, we draw the first indicator on
// top of the main chart.
//
addIndicator(m, Request["Indicator1"], indicatorHeight);
//
// Add the main chart
//
m.addMainChart(mainHeight);
//
// Set log or linear scale according to user preference
//
if (Request["LogScale"] == "1") {
m.setLogScale(true);
}
//
// Set axis labels to show data values or percentage change to user preference
//
if (Request["PercentageScale"] == "1") {
m.setPercentageAxis();
}
//
// Draw any price line the user has selected
//
string mainType = Request["ChartType"];
if (mainType == "Close") {
m.addCloseLine(0x000040);
} else if (mainType == "TP") {
m.addTypicalPrice(0x000040);
} else if (mainType == "WC") {
m.addWeightedClose(0x000040);
} else if (mainType == "Median") {
m.addMedianPrice(0x000040);
}
//
// Add comparison line if there is data for comparison
//
if (compareData != null) {
if (compareData.Length > extraPoints) {
m.addComparison(compareData, 0x0000ff, compareKey);
}
}
//
// Add moving average lines.
//
addMovingAvg(m, Request["avgType1"], avgPeriod1, 0x663300);
addMovingAvg(m, Request["avgType2"], avgPeriod2, 0x9900ff);
//
// Draw candlesticks or OHLC symbols if the user has selected them.
//
if (mainType == "CandleStick") {
m.addCandleStick(0x33ff33, 0xff3333);
} else if (mainType == "OHLC") {
m.addHLOC(0x008800, 0xcc0000);
}
//
// Add parabolic SAR if necessary
//
if (Request["ParabolicSAR"] == "1") {
m.addParabolicSAR(0.02, 0.02, 0.2, Chart.DiamondShape, 5, 0x008800, 0x000000);
}
//
// Add price band/channel/envelop to the chart according to user selection
//
string bandType = Request["Band"];
if (bandType == "BB") {
m.addBollingerBand(20, 2, 0x9999ff, unchecked((int)0xc06666ff));
} else if (bandType == "DC") {
m.addDonchianChannel(20, 0x9999ff, unchecked((int)0xc06666ff));
} else if (bandType == "Envelop") {
m.addEnvelop(20, 0.1, 0x9999ff, unchecked((int)0xc06666ff));
}
//
// Add volume bars to the main chart if necessary
//
if (Request["Volume"] == "1") {
m.addVolBars(indicatorHeight, 0x99ff99, 0xff9999, 0xc0c0c0);
}
//
// Add additional indicators as according to user selection.
//
addIndicator(m, Request["Indicator2"], indicatorHeight);
addIndicator(m, Request["Indicator3"], indicatorHeight);
addIndicator(m, Request["Indicator4"], indicatorHeight);
return m;
}
/// <summary>
/// Add a moving average line to the FinanceChart object.
/// </summary>
/// <param name="m">The FinanceChart object to add the line to.</param>
/// <param name="avgType">The moving average type (SMA/EMA/TMA/WMA).</param>
/// <param name="avgPeriod">The moving average period.</param>
/// <param name="color">The color of the line.</param>
/// <returns>The LineLayer object representing line layer created.</returns>
protected LineLayer addMovingAvg(FinanceChart m, string avgType, int avgPeriod, int color)
{
if (avgPeriod > 1) {
if (avgType == "SMA") {
return m.addSimpleMovingAvg(avgPeriod, color);
} else if (avgType == "EMA") {
return m.addExpMovingAvg(avgPeriod, color);
} else if (avgType == "TMA") {
return m.addTriMovingAvg(avgPeriod, color);
} else if (avgType == "WMA") {
return m.addWeightedMovingAvg(avgPeriod, color);
}
}
return null;
}
/// <summary>
/// Add an indicator chart to the FinanceChart object. In this demo example, the
/// indicator parameters (such as the period used to compute RSI, colors of the lines,
/// etc.) are hard coded to commonly used values. You are welcome to design a more
/// complex user interface to allow users to set the parameters.
/// </summary>
/// <param name="m">The FinanceChart object to add the line to.</param>
/// <param name="indicator">The selected indicator.</param>
/// <param name="height">Height of the chart in pixels</param>
/// <returns>The XYChart object representing indicator chart.</returns>
protected XYChart addIndicator(FinanceChart m, string indicator, int height)
{
if (indicator == "RSI") {
return m.addRSI(height, 14, 0x800080, 20, 0xff6666, 0x6666ff);
} else if (indicator == "StochRSI") {
return m.addStochRSI(height, 14, 0x800080, 30, 0xff6666, 0x6666ff);
} else if (indicator == "MACD") {
return m.addMACD(height, 26, 12, 9, 0x0000ff, 0xff00ff, 0x008000);
} else if (indicator == "FStoch") {
return m.addFastStochastic(height, 14, 3, 0x006060, 0x606000);
} else if (indicator == "SStoch") {
return m.addSlowStochastic(height, 14, 3, 0x006060, 0x606000);
} else if (indicator == "ATR") {
return m.addATR(height, 14, 0x808080, 0x0000ff);
} else if (indicator == "ADX") {
return m.addADX(height, 14, 0x008000, 0x800000, 0x000080);
} else if (indicator == "DCW") {
return m.addDonchianWidth(height, 20, 0x0000ff);
} else if (indicator == "BBW") {
return m.addBollingerWidth(height, 20, 2, 0x0000ff);
} else if (indicator == "DPO") {
return m.addDPO(height, 20, 0x0000ff);
} else if (indicator == "PVT") {
return m.addPVT(height, 0x0000ff);
} else if (indicator == "Momentum") {
return m.addMomentum(height, 12, 0x0000ff);
} else if (indicator == "Performance") {
return m.addPerformance(height, 0x0000ff);
} else if (indicator == "ROC") {
return m.addROC(height, 12, 0x0000ff);
} else if (indicator == "OBV") {
return m.addOBV(height, 0x0000ff);
} else if (indicator == "AccDist") {
return m.addAccDist(height, 0x0000ff);
} else if (indicator == "CLV") {
return m.addCLV(height, 0x0000ff);
} else if (indicator == "WilliamR") {
return m.addWilliamR(height, 14, 0x800080, 30, 0xff6666, 0x6666ff);
} else if (indicator == "Aroon") {
return m.addAroon(height, 14, 0x339933, 0x333399);
} else if (indicator == "AroonOsc") {
return m.addAroonOsc(height, 14, 0x0000ff);
} else if (indicator == "CCI") {
return m.addCCI(height, 20, 0x800080, 100, 0xff6666, 0x6666ff);
} else if (indicator == "EMV") {
return m.addEaseOfMovement(height, 9, 0x006060, 0x606000);
} else if (indicator == "MDX") {
return m.addMassIndex(height, 0x800080, 0xff6666, 0x6666ff);
} else if (indicator == "CVolatility") {
return m.addChaikinVolatility(height, 10, 10, 0x0000ff);
} else if (indicator == "COscillator") {
return m.addChaikinOscillator(height, 0x0000ff);
} else if (indicator == "CMF") {
return m.addChaikinMoneyFlow(height, 21, 0x008000);
} else if (indicator == "NVI") {
return m.addNVI(height, 255, 0x0000ff, 0x883333);
} else if (indicator == "PVI") {
return m.addPVI(height, 255, 0x0000ff, 0x883333);
} else if (indicator == "MFI") {
return m.addMFI(height, 14, 0x800080, 30, 0xff6666, 0x6666ff);
} else if (indicator == "PVO") {
return m.addPVO(height, 26, 12, 9, 0x0000ff, 0xff00ff, 0x008000);
} else if (indicator == "PPO") {
return m.addPPO(height, 26, 12, 9, 0x0000ff, 0xff00ff, 0x008000);
} else if (indicator == "UO") {
return m.addUltimateOscillator(height, 7, 14, 28, 0x800080, 20, 0xff6666, 0x6666ff);
} else if (indicator == "Vol") {
return m.addVolIndicator(height, 0x99ff99, 0xff9999, 0xc0c0c0);
} else if (indicator == "TRIX") {
return m.addTRIX(height, 12, 0x0000ff);
}
return null;
}
/// <summary>
/// Creates a dummy chart to show an error message.
/// </summary>
/// <param name="msg">The error message.
/// <returns>The BaseChart object containing the error message.</returns>
protected BaseChart errMsg(string msg)
{
MultiChart m = new MultiChart(400, 200);
m.addTitle2(Chart.Center, msg, "Arial", 10).setMaxWidth(m.getWidth());
return m;
}
/// <summary>
/// Displays the web page. The web page will use "GetChart" to obtain the chart.
/// </summary>
public ActionResult Index()
{
return View();
}
/// <summary>
/// Creates chart and stream to the browser.
/// </summary>
public ActionResult GetChart()
{
// Create the finance chart
BaseChart c = drawChart();
// Output the chart
return File(c.makeChart2(Chart.PNG), "image/png");
}
}
}
[ASP.NET MVC - View] NetMvcCharts\Views\Financedemo\Index.cshtml
@{ Layout = null; }

<!DOCTYPE html>
<html>
<head>
<title>ChartDirector Financial Chart Demonstration</title>
<style>
.inputtitle {font:11px verdana; margin:10px 5px;}
.input {font:11px verdana}
</style>
<script language="Javascript">

//Update the chart according to user selection
function updateChart()
{
    //
    //we encode the values of all form elements as query parameters
    //
    var elements = document.getElementById("Form1").elements;
    var url = '@Url.Action("GetChart")';
    url += (url.indexOf('?') < 0) ? '?' : '&';
    for (var i = 0; i < elements.length; ++i)
    {
        var e = elements[i];
        if (e.type == "checkbox")
            url = url + e.id + "=" + (e.checked ? "1" : "0") + "&";
        else
            url = url + e.id + "=" + escape(e.value) + "&";
    }

    //Now we update the URL of the image to update the chart
    document.getElementById("ChartImage").src = url;
}

</script>
</head>
<body style="margin:0px" onLoad="updateChart();">
<table style="border:0px; padding:0px; border-spacing:0px;">
    <tr>
        <td align="right" colspan="2" style="background:#000088">
            <div style="padding:0px 3px 2px 0px; font:bold italic 10pt arial;">
                <a style="color:#ffff00; text-decoration:none" href="http://www.advsofteng.com">
                    Advanced Software Engineering
                </a>
            </div>
        </td>
    </tr>
    <tr valign="top">
        <td style="width:150px; background:#bbddff">
            <form id="Form1" action="javascript:updateChart()">
            <div class="inputtitle">
                <b>Ticker Symbol</b><br />
                <input id="TickerSymbol" name="TickerSymbol" class="input" style="width:140px;" value="ASE.SYMBOL">
            </div>
            <div class="inputtitle">
                <b>Compare With</b><br />
                <input id="CompareWith" name="CompareWith" class="input" style="width:140px;" value="">
            </div>
            <div class="inputtitle">
                <b>Time Period</b><br />
                <select id="TimeRange" name="TimeRange" class="input" style="width:140px;">
                    <option value="1">1 day</option>
                    <option value="2">2 days</option>
                    <option value="5">5 days</option>
                    <option value="10">10 days</option>
                    <option value="30">1 month</option>
                    <option value="60">2 months</option>
                    <option value="90">3 months</option>
                    <option value="180" selected>6 months</option>
                    <option value="360">1 year</option>
                    <option value="720">2 years</option>
                    <option value="1080">3 years</option>
                    <option value="1440">4 years</option>
                    <option value="1800">5 years</option>
                    <option value="3600">10 years</option>
                </select>
            </div>
            <div class="inputtitle">
                <b>Chart Size</b><br />
                <select id="ChartSize" name="ChartSize" class="input" style="width:140px;">
                    <option value="S">Small</option>
                    <option value="M">Medium</option>
                    <option value="L" selected>Large</option>
                    <option value="H">Huge</option>
                </select><br />
            </div>
            <div class="inputtitle">
                <input type="checkbox" id="Volume" name="Volume" checked><label for="Volume">Show Volume Bars</label><br />
                <input type="checkbox" id="ParabolicSAR" name="ParabolicSAR"><label for="ParabolicSAR">Parabolic SAR</label><br />
                <input type="checkbox" id="LogScale" name="LogScale"><label for="LogScale">Log Scale</label><br />
                <input type="checkbox" id="PercentageScale" name="PercentageScale"><label for="PercentageScale">Percentage Scale</label><br />
            </div>
            <div class="inputtitle">
                <b>Chart Type</b><br />
                <select id="ChartType" name="ChartType" class="input" style="width:140px;">
                    <option value="None">None</option>
                    <option value="CandleStick" selected>CandleStick</option>
                    <option value="Close">Closing Price</option>
                    <option value="Median">Median Price</option>
                    <option value="OHLC">OHLC</option>
                    <option value="TP">Typical Price</option>
                    <option value="WC">Weighted Close</option>
                </select>
            </div>
            <div class="inputtitle">
                <b>Price Band</b><br />
                <select id="Band" name="Band" class="input" style="width:140px;">
                    <option value="None">None</option>
                    <option value="BB" selected>Bollinger Band</option>
                    <option value="DC">Donchian Channel</option>
                    <option value="Envelop">Envelop (SMA 20 +/- 10%)</option>
                </select>
            </div>
            <div class="inputtitle">
                <b>Moving Averages</b><br />
                <nobr><select id="avgType1" name="avgType1" class="input" style="width:105px;">
                    <option value="None">None</option>
                    <option value="SMA" selected>Simple</option>
                    <option value="EMA">Exponential</option>
                    <option value="TMA">Triangular</option>
                    <option value="WMA">Weighted</option>
                </select>
                <input id="movAvg1" name="movAvg1" class="input" style="width:30px;" value="10"></nobr><br />
                <nobr><select id="avgType2" name="avgType2" class="input" style="width:105px;">
                    <option value="None">None</option>
                    <option value="SMA" selected>Simple</option>
                    <option value="EMA">Exponential</option>
                    <option value="TMA">Triangular</option>
                    <option value="WMA">Weighted</option>
                </select>
                <input id="movAvg2" name="movAvg2" class="input" style="width:30px;" value="25"></nobr><br />
            </div>
            <div class="inputtitle">
                <b>Technical Indicators</b><br />
                <select id="Indicator1" name="Indicator1" class="input" style="width:140px;">
                    <option value="None">None</option>
                    <option value="AccDist">Accumulation/Distribution</option>
                    <option value="AroonOsc">Aroon Oscillator</option>
                    <option value="Aroon">Aroon Up/Down</option>
                    <option value="ADX">Avg Directional Index</option>
                    <option value="ATR">Avg True Range</option>
                    <option value="BBW">Bollinger Band Width</option>
                    <option value="CMF">Chaikin Money Flow</option>
                    <option value="COscillator">Chaikin Oscillator</option>
                    <option value="CVolatility">Chaikin Volatility</option>
                    <option value="CLV">Close Location Value</option>
                    <option value="CCI">Commodity Channel Index</option>
                    <option value="DPO">Detrended Price Osc</option>
                    <option value="DCW">Donchian Channel Width</option>
                    <option value="EMV">Ease of Movement</option>
                    <option value="FStoch">Fast Stochastic</option>
                    <option value="MACD">MACD</option>
                    <option value="MDX">Mass Index</option>
                    <option value="Momentum">Momentum</option>
                    <option value="MFI">Money Flow Index</option>
                    <option value="NVI">Neg Volume Index</option>
                    <option value="OBV">On Balance Volume</option>
                    <option value="Performance">Performance</option>
                    <option value="PPO">% Price Oscillator</option>
                    <option value="PVO">% Volume Oscillator</option>
                    <option value="PVI">Pos Volume Index</option>
                    <option value="PVT">Price Volume Trend</option>
                    <option value="ROC">Rate of Change</option>
                    <option value="RSI" selected>RSI</option>
                    <option value="SStoch">Slow Stochastic</option>
                    <option value="StochRSI">StochRSI</option>
                    <option value="TRIX">TRIX</option>
                    <option value="UO">Ultimate Oscillator</option>
                    <option value="Vol">Volume</option>
                    <option value="WilliamR">William's %R</option>
                </select><br />
                <select id="Indicator2" name="Indicator2" class="input" style="width:140px;">
                    <option value="None">None</option>
                    <option value="AccDist">Accumulation/Distribution</option>
                    <option value="AroonOsc">Aroon Oscillator</option>
                    <option value="Aroon">Aroon Up/Down</option>
                    <option value="ADX">Avg Directional Index</option>
                    <option value="ATR">Avg True Range</option>
                    <option value="BBW">Bollinger Band Width</option>
                    <option value="CMF">Chaikin Money Flow</option>
                    <option value="COscillator">Chaikin Oscillator</option>
                    <option value="CVolatility">Chaikin Volatility</option>
                    <option value="CLV">Close Location Value</option>
                    <option value="CCI">Commodity Channel Index</option>
                    <option value="DPO">Detrended Price Osc</option>
                    <option value="DCW">Donchian Channel Width</option>
                    <option value="EMV">Ease of Movement</option>
                    <option value="FStoch">Fast Stochastic</option>
                    <option value="MACD" selected>MACD</option>
                    <option value="MDX">Mass Index</option>
                    <option value="Momentum">Momentum</option>
                    <option value="MFI">Money Flow Index</option>
                    <option value="NVI">Neg Volume Index</option>
                    <option value="OBV">On Balance Volume</option>
                    <option value="Performance">Performance</option>
                    <option value="PPO">% Price Oscillator</option>
                    <option value="PVO">% Volume Oscillator</option>
                    <option value="PVI">Pos Volume Index</option>
                    <option value="PVT">Price Volume Trend</option>
                    <option value="ROC">Rate of Change</option>
                    <option value="RSI">RSI</option>
                    <option value="SStoch">Slow Stochastic</option>
                    <option value="StochRSI">StochRSI</option>
                    <option value="TRIX">TRIX</option>
                    <option value="UO">Ultimate Oscillator</option>
                    <option value="Vol">Volume</option>
                    <option value="WilliamR">William's %R</option>
                </select><br />
                <select id="Indicator3" name="Indicator3" class="input" style="width:140px;">
                    <option value="None" selected>None</option>
                    <option value="AccDist">Accumulation/Distribution</option>
                    <option value="AroonOsc">Aroon Oscillator</option>
                    <option value="Aroon">Aroon Up/Down</option>
                    <option value="ADX">Avg Directional Index</option>
                    <option value="ATR">Avg True Range</option>
                    <option value="BBW">Bollinger Band Width</option>
                    <option value="CMF">Chaikin Money Flow</option>
                    <option value="COscillator">Chaikin Oscillator</option>
                    <option value="CVolatility">Chaikin Volatility</option>
                    <option value="CLV">Close Location Value</option>
                    <option value="CCI">Commodity Channel Index</option>
                    <option value="DPO">Detrended Price Osc</option>
                    <option value="DCW">Donchian Channel Width</option>
                    <option value="EMV">Ease of Movement</option>
                    <option value="FStoch">Fast Stochastic</option>
                    <option value="MACD">MACD</option>
                    <option value="MDX">Mass Index</option>
                    <option value="Momentum">Momentum</option>
                    <option value="MFI">Money Flow Index</option>
                    <option value="NVI">Neg Volume Index</option>
                    <option value="OBV">On Balance Volume</option>
                    <option value="Performance">Performance</option>
                    <option value="PPO">% Price Oscillator</option>
                    <option value="PVO">% Volume Oscillator</option>
                    <option value="PVI">Pos Volume Index</option>
                    <option value="PVT">Price Volume Trend</option>
                    <option value="ROC">Rate of Change</option>
                    <option value="RSI">RSI</option>
                    <option value="SStoch">Slow Stochastic</option>
                    <option value="StochRSI">StochRSI</option>
                    <option value="TRIX">TRIX</option>
                    <option value="UO">Ultimate Oscillator</option>
                    <option value="Vol">Volume</option>
                    <option value="WilliamR">William's %R</option>
                </select><br />
                <select id="Indicator4" name="Indicator4" class="input" style="width:140px;">
                    <option value="None" selected>None</option>
                    <option value="AccDist">Accumulation/Distribution</option>
                    <option value="AroonOsc">Aroon Oscillator</option>
                    <option value="Aroon">Aroon Up/Down</option>
                    <option value="ADX">Avg Directional Index</option>
                    <option value="ATR">Avg True Range</option>
                    <option value="BBW">Bollinger Band Width</option>
                    <option value="CMF">Chaikin Money Flow</option>
                    <option value="COscillator">Chaikin Oscillator</option>
                    <option value="CVolatility">Chaikin Volatility</option>
                    <option value="CLV">Close Location Value</option>
                    <option value="CCI">Commodity Channel Index</option>
                    <option value="DPO">Detrended Price Osc</option>
                    <option value="DCW">Donchian Channel Width</option>
                    <option value="EMV">Ease of Movement</option>
                    <option value="FStoch">Fast Stochastic</option>
                    <option value="MACD">MACD</option>
                    <option value="MDX">Mass Index</option>
                    <option value="Momentum">Momentum</option>
                    <option value="MFI">Money Flow Index</option>
                    <option value="NVI">Neg Volume Index</option>
                    <option value="OBV">On Balance Volume</option>
                    <option value="Performance">Performance</option>
                    <option value="PPO">% Price Oscillator</option>
                    <option value="PVO">% Volume Oscillator</option>
                    <option value="PVI">Pos Volume Index</option>
                    <option value="PVT">Price Volume Trend</option>
                    <option value="ROC">Rate of Change</option>
                    <option value="RSI">RSI</option>
                    <option value="SStoch">Slow Stochastic</option>
                    <option value="StochRSI">StochRSI</option>
                    <option value="TRIX">TRIX</option>
                    <option value="UO">Ultimate Oscillator</option>
                    <option value="Vol">Volume</option>
                    <option value="WilliamR">William's %R</option>
                </select>
            </div>
            <div class="inputtitle" style="text-align:center">
                <input id="Button1" name="Button1" type="submit" class="input" value="Update Chart">
            </div>
            </form>
        </td>
        <td>
            <div style="font:bold 20pt arial; margin:5px 0px 0px 5px">
                ChartDirector Financial Chart Demonstration
            </div>
            <hr style="border:solid 1px #000080" />
            <br />
            <img id="ChartImage" align="top" border="0">
        </td>
    </tr>
</table>
</body>
</html>
[Windows Forms - C# version] NetWinCharts\CSharpWinCharts\frmfinancedemo.cs
using System;
using System.Collections.Generic;
using System.Windows.Forms;
using ChartDirector;
namespace CSharpChartExplorer
{
public partial class FrmFinanceDemo : Form
{
public FrmFinanceDemo()
{
InitializeComponent();
}
//
// A utility class for adding items to ComboBox
//
private class ListItem
{
string m_key;
string m_value;
public ListItem(string key, string val)
{
m_key = key;
m_value = val;
}
public string Key
{
get { return m_key; }
}
public override string ToString()
{
return m_value;
}
}
// The main ticker key and the compare to ticker key
private string tickerKey;
private string compareKey;
class PriceData
{
public DateTime[] timeStamps;
public double[] highData;
public double[] lowData;
public double[] openData;
public double[] closeData;
public double[] volData;
// An extra field for price comparison
public double[] compareData;
};
// In this example, we can use daily, weekly or monthly data depending on the time range
PriceData dailyPrice;
PriceData weeklyPrice;
PriceData monthlyPrice;
// Will set to true at the end of initialization - prevents events from firing before the
// controls are properly initialized.
private bool hasFinishedInitialization = false;
//
// Form Load event handler - initialize the form
//
private void FrmFinanceDemo_Load(object sender, System.EventArgs e)
{
timeRange.Items.Add(new ListItem("30", "1 month"));
timeRange.Items.Add(new ListItem("60", "2 months"));
timeRange.SelectedIndex = timeRange.Items.Add(new ListItem("90", "3 months"));
timeRange.Items.Add(new ListItem("180", "6 months"));
timeRange.Items.Add(new ListItem("360", "1 year"));
timeRange.Items.Add(new ListItem("720", "2 years"));
timeRange.Items.Add(new ListItem("1080", "3 years"));
timeRange.Items.Add(new ListItem("1440", "4 years"));
timeRange.Items.Add(new ListItem("1800", "5 years"));
timeRange.Items.Add(new ListItem("3600", "10 years"));
chartType.Items.Add(new ListItem("None", "None"));
chartType.SelectedIndex = chartType.Items.Add(new ListItem("CandleStick", "CandleStick"));
chartType.Items.Add(new ListItem("Close", "Closing Price"));
chartType.Items.Add(new ListItem("Median", "Median Price"));
chartType.Items.Add(new ListItem("OHLC", "OHLC"));
chartType.Items.Add(new ListItem("TP", "Typical Price"));
chartType.Items.Add(new ListItem("WC", "Weighted Close"));
priceBand.Items.Add(new ListItem("None", "None"));
priceBand.SelectedIndex = priceBand.Items.Add(new ListItem("BB", "Bollinger Band"));
priceBand.Items.Add(new ListItem("DC", "Donchain Channel"));
priceBand.Items.Add(new ListItem("Envelop", "Envelop (SMA 20 +/- 10%)"));
avgType1.Items.Add(new ListItem("None", "None"));
avgType1.SelectedIndex = avgType1.Items.Add(new ListItem("SMA", "Simple"));
avgType1.Items.Add(new ListItem("EMA", "Exponential"));
avgType1.Items.Add(new ListItem("TMA", "Triangular"));
avgType1.Items.Add(new ListItem("WMA", "Weighted"));
avgType2.Items.Add(new ListItem("None", "None"));
avgType2.SelectedIndex = avgType2.Items.Add(new ListItem("SMA", "Simple"));
avgType2.Items.Add(new ListItem("EMA", "Exponential"));
avgType2.Items.Add(new ListItem("TMA", "Triangular"));
avgType2.Items.Add(new ListItem("WMA", "Weighted"));
ListItem[] indicators =
{
new ListItem("None", "None"),
new ListItem("AccDist", "Accumulation/Distribution"),
new ListItem("AroonOsc", "Aroon Oscillator"),
new ListItem("Aroon", "Aroon Up/Down"),
new ListItem("ADX", "Avg Directional Index"),
new ListItem("ATR", "Avg True Range"),
new ListItem("BBW", "Bollinger Band Width"),
new ListItem("CMF", "Chaikin Money Flow"),
new ListItem("COscillator", "Chaikin Oscillator"),
new ListItem("CVolatility", "Chaikin Volatility"),
new ListItem("CLV", "Close Location Value"),
new ListItem("CCI", "Commodity Channel Index"),
new ListItem("DPO", "Detrended Price Osc"),
new ListItem("DCW", "Donchian Channel Width"),
new ListItem("EMV", "Ease of Movement"),
new ListItem("FStoch", "Fast Stochastic"),
new ListItem("MACD", "MACD"),
new ListItem("MDX", "Mass Index"),
new ListItem("Momentum", "Momentum"),
new ListItem("MFI", "Money Flow Index"),
new ListItem("NVI", "Neg Volume Index"),
new ListItem("OBV", "On Balance Volume"),
new ListItem("Performance", "Performance"),
new ListItem("PPO", "% Price Oscillator"),
new ListItem("PVO", "% Volume Oscillator"),
new ListItem("PVI", "Pos Volume Index"),
new ListItem("PVT", "Price Volume Trend"),
new ListItem("ROC", "Rate of Change"),
new ListItem("RSI", "RSI"),
new ListItem("SStoch", "Slow Stochastic"),
new ListItem("StochRSI", "StochRSI"),
new ListItem("TRIX", "TRIX"),
new ListItem("UO", "Ultimate Oscillator"),
new ListItem("Vol", "Volume"),
new ListItem("WilliamR", "William's %R")
};
indicator1.Items.AddRange(indicators);
indicator2.Items.AddRange(indicators);
for (int i = 0; i < indicators.Length; ++i)
{
if (indicators[i].Key == "RSI")
indicator1.SelectedIndex = i;
else if (indicators[i].Key == "MACD")
indicator2.SelectedIndex = i;
}
// Enable mouse wheel zooming by setting the zoom ratio to 1.1 per wheel event
winChartViewer1.MouseWheelZoomRatio = 1.1;
// Initially set the mouse usage to "Pointer" mode (Drag to Scroll mode)
pointerPB.Checked = true;
winChartViewer1.MouseUsage = WinChartMouseUsage.ScrollOnDrag;
// Set the ticker symbol and load the data
tickerSymbol.Text = "ASE";
loadData();
// Draw the chart
hasFinishedInitialization = true;
winChartViewer1.updateViewPort(true, true);
}
//
// Load data to draw the chart
//
private void loadData()
{
// Reload main data if ticker key has changed
if (tickerKey != tickerSymbol.Text)
{
tickerKey = tickerSymbol.Text;
// Simulator to generate realistic random OHLC values
FinanceSimulator db = new FinanceSimulator(tickerKey, new DateTime(2010, 1, 1),
new DateTime(2020, 12, 31), 86400);
// Copy daily data to the data arrays
if (null == dailyPrice)
dailyPrice = new PriceData();
dailyPrice.timeStamps = db.getTimeStamps();
dailyPrice.highData = db.getHighData();
dailyPrice.lowData = db.getLowData();
dailyPrice.openData = db.getOpenData();
dailyPrice.closeData = db.getCloseData();
dailyPrice.volData = db.getVolData();
// Set up the viewport to display the duration selected by the user
winChartViewer1.setFullRange("x", 0, dailyPrice.timeStamps.Length - 1);
int durationInDays;
int.TryParse(((ListItem)timeRange.SelectedItem).Key, out durationInDays);
winChartViewer1.ViewPortWidth = durationInDays / (double)dailyPrice.timeStamps.Length;
winChartViewer1.ViewPortLeft = 1 - winChartViewer1.ViewPortWidth;
}
// Reload compare data if compare key has changed
if ((compareKey != compareWith.Text) && (dailyPrice != null))
{
compareKey = compareWith.Text;
if (compareKey == "")
dailyPrice.compareData = null;
else
{
// Simulator to generate realistic random OHLC values
FinanceSimulator db2 = new FinanceSimulator(compareKey, new DateTime(2010, 1, 1),
new DateTime(2020, 12, 31), 86400);
dailyPrice.compareData = db2.getCloseData();
}
}
// In this example, we will compute the weekly and monthly prices on demand. We just
// need to clear the old data here.
weeklyPrice = null;
monthlyPrice = null;
}
//
// Aggregate the data into weekly or monthly data depending on the aggregator
//
PriceData aggregateData(ArrayMath aggregator, PriceData p)
{
PriceData ret = new PriceData();
ret.timeStamps = aggregator.aggregate(p.timeStamps, Chart.AggregateFirst);
ret.highData = aggregator.aggregate(p.highData, Chart.AggregateMax);
ret.lowData = aggregator.aggregate(p.lowData, Chart.AggregateMin);
ret.openData = aggregator.aggregate(p.openData, Chart.AggregateFirst);
ret.closeData = aggregator.aggregate(p.closeData, Chart.AggregateLast);
ret.volData = aggregator.aggregate(p.volData, Chart.AggregateSum);
ret.compareData = aggregator.aggregate(p.compareData, Chart.AggregateLast);
return ret;
}
//
// In this sample code, the chart updates when the user selection changes. You may
// modify the code to update the data and chart periodically for real time charts.
//
private void selectionChanged(object sender, System.EventArgs e)
{
if (hasFinishedInitialization)
drawChart(winChartViewer1);
}
//
// For the ticker and compare symbols, the chart will update when the user enters a new
// symbol, and then press the enter button or leave the text box.
//
private void tickerSymbol_Leave(object sender, System.EventArgs e)
{
// User leave ticker symbol text box - redraw chart if symbol has changed
if (tickerSymbol.Text == "")
// Default Symbol
tickerSymbol.Text = "ASE";
if (tickerSymbol.Text != tickerKey)
{
loadData();
drawChart(winChartViewer1);
}
}
private void tickerSymbol_KeyPress(object sender, System.Windows.Forms.KeyPressEventArgs e)
{
// User press enter key - same action as leaving the text box.
if (e.KeyChar == '\r')
tickerSymbol_Leave(sender, e);
}
private void compareWith_Leave(object sender, System.EventArgs e)
{
// User leave compare symbol text box - redraw chart if symbol has changed
if (compareWith.Text != compareKey)
{
loadData();
drawChart(winChartViewer1);
}
}
private void compareWith_KeyPress(object sender, System.Windows.Forms.KeyPressEventArgs e)
{
// User press enter key - same action as leaving the text box.
if (e.KeyChar == '\r')
compareWith_Leave(sender, e);
}
//
// The time range selection changes
//
private void timeRange_SelectedIndexChanged(object sender, EventArgs e)
{
if (hasFinishedInitialization && (null != dailyPrice))
{
// Update the viewport to reflect the new time range, then update the chart.
int durationInDays;
int.TryParse(((ListItem)timeRange.SelectedItem).Key, out durationInDays);
winChartViewer1.ViewPortWidth = durationInDays / (double)dailyPrice.timeStamps.Length;
winChartViewer1.ViewPortLeft = 1 - winChartViewer1.ViewPortWidth;
winChartViewer1.updateViewPort(true, true);
}
}
//
// Draw the chart according to user selection and display it in the WinChartViewer.
//
private void drawChart(WinChartViewer viewer)
{
// Use InvariantCulture to draw the chart. This ensures the chart will look the
// same on any computer.
System.Threading.Thread.CurrentThread.CurrentCulture =
System.Globalization.CultureInfo.InvariantCulture;
// The first moving average period selected by the user.
int avgPeriod1;
int.TryParse(movAvg1.Text, out avgPeriod1);
// The second moving average period selected by the user.
int avgPeriod2;
int.TryParse(movAvg2.Text, out avgPeriod2);
// We need extra leading data points in order to compute moving averages.
int extraPoints = Math.Min(300, Math.Max(25, Math.Max(avgPeriod1, avgPeriod2)));
// After determining the extra points, we can obtain the data
int startIndex = (int)Math.Floor(viewer.getValueAtViewPort("x", viewer.ViewPortLeft));
int endIndex = (int)Math.Ceiling(viewer.getValueAtViewPort("x", viewer.ViewPortRight));
// Choose either daily, weekly or monthly prices depending on the date range
PriceData p = dailyPrice;
// If more than 400 trading days, use weekly or monthly prices
if (endIndex - startIndex >= 400)
{
if (endIndex - startIndex < 2000)
{
// Between 400 and 2000 trading days, use weekly prices
if (weeklyPrice == null)
{
// If no weekly prices, compute them from daily prices.
ArrayMath a = new ArrayMath(dailyPrice.timeStamps);
weeklyPrice = aggregateData(a.selectStartOfWeek(), dailyPrice);
}
p = weeklyPrice;
}
else
{
// More than 2000 trading days, use monthly prices
if (monthlyPrice == null)
{
// If no monthly prices, compute them from daily prices.
ArrayMath a = new ArrayMath(dailyPrice.timeStamps);
monthlyPrice = aggregateData(a.selectStartOfMonth(), dailyPrice);
}
p = monthlyPrice;
}
// Re-compute the index based on the weekly/monthly prices
startIndex = (int)Math.Floor(Chart.bSearch(p.timeStamps, dailyPrice.timeStamps[startIndex]));
endIndex = (int)Math.Ceiling(Chart.bSearch(p.timeStamps, dailyPrice.timeStamps[endIndex]));
}
//
// At this stage, we have determined the price data to use. We need to obtain the part of the
// arrays that are within the visible x-axis range.
//
// Add extra points before the startIndex, as moving averages and may technical indicators
// requires data before the first visible point.
extraPoints = Math.Min(extraPoints, startIndex);
startIndex -= extraPoints;
int duration = endIndex - startIndex + 1;
DateTime[] vpTimeStamps = Chart.arraySlice(p.timeStamps, startIndex, duration);
double[] vpHighData = Chart.arraySlice(p.highData, startIndex, duration);
double[] vpLowData = Chart.arraySlice(p.lowData, startIndex, duration);
double[] vpOpenData = Chart.arraySlice(p.openData, startIndex, duration);
double[] vpCloseData = Chart.arraySlice(p.closeData, startIndex, duration);
double[] vpVolData = Chart.arraySlice(p.volData, startIndex, duration);
double[] vpCompareData = Chart.arraySlice(p.compareData, startIndex, duration);
//
// The chart size.
//
int width = 780;
int mainHeight = 255;
int indicatorHeight = 80;
// Create the chart object using the selected size
FinanceChart m = new FinanceChart(width);
// Hide default legend box as we are using dynamic legend
m.setLegendStyle("normal", 8, Chart.Transparent, Chart.Transparent);
// Set the data into the chart object
m.setData(vpTimeStamps, vpHighData, vpLowData, vpOpenData, vpCloseData, vpVolData, extraPoints);
// Put the ticker key at the bottom left of the FinanceChart title region
m.addPlotAreaTitle(Chart.BottomLeft, tickerSymbol.Text);
// A copyright message at the bottom left corner the title area
m.addPlotAreaTitle(Chart.BottomRight, "<*font=arial.ttf,size=8*>(c) Advanced Software Engineering");
// Add the main chart
m.addMainChart(mainHeight);
// Set log or linear scale according to user preference
m.setLogScale(logScale.Checked);
// Set axis labels to show data values or percentage change to user preference
if (percentageScale.Checked)
m.setPercentageAxis();
// Draw any price line the user has selected
string mainType = ((ListItem)chartType.SelectedItem).Key;
if (mainType == "Close")
m.addCloseLine(0x000040);
else if (mainType == "TP")
m.addTypicalPrice(0x000040);
else if (mainType == "WC")
m.addWeightedClose(0x000040);
else if (mainType == "Median")
m.addMedianPrice(0x000040);
// Add comparison line if there is data for comparison
if ((vpCompareData != null) && (vpCompareData.Length > extraPoints))
m.addComparison(vpCompareData, 0x0000ff, compareKey);
// Add moving average lines.
addMovingAvg(m, ((ListItem)avgType1.SelectedItem).Key, avgPeriod1, 0x663300);
addMovingAvg(m, ((ListItem)avgType2.SelectedItem).Key, avgPeriod2, 0x9900ff);
// Draw candlesticks or OHLC symbols if the user has selected them.
if (mainType == "CandleStick")
m.addCandleStick(0x33ff33, 0xff3333);
else if (mainType == "OHLC")
m.addHLOC(0x008800, 0xcc0000);
// Add parabolic SAR if necessary
if (parabolicSAR.Checked)
m.addParabolicSAR(0.02, 0.02, 0.2, Chart.DiamondShape, 5, 0x008800, 0x000000);
// Add price band/channel/envelop to the chart according to user selection
string selectedBand = ((ListItem)priceBand.SelectedItem).Key;
if (selectedBand == "BB")
m.addBollingerBand(20, 2, 0x9999ff, unchecked((int)(0xc06666ff)));
else if (selectedBand == "DC")
m.addDonchianChannel(20, 0x9999ff, unchecked((int)(0xc06666ff)));
else if (selectedBand == "Envelop")
m.addEnvelop(20, 0.1, 0x9999ff, unchecked((int)(0xc06666ff)));
// Add volume bars to the main chart if necessary
if (volumeBars.Checked)
m.addVolBars(indicatorHeight, 0x99ff99, 0xff9999, 0xc0c0c0);
// Add additional indicators as according to user selection.
addIndicator(m, ((ListItem)indicator1.SelectedItem).Key, indicatorHeight);
addIndicator(m, ((ListItem)indicator2.SelectedItem).Key, indicatorHeight);
// We may need to update the track line. If the mouse is moving on the chart, the track line
// will be updated in MouseMovePlotArea. Otherwise, we need to update the track line here.
if (!viewer.IsInMouseMoveEvent)
{
trackFinance(m, (null == viewer.Chart) ?
((XYChart)m.getChart(0)).getPlotArea().getRightX() : viewer.PlotAreaMouseX);
}
// output the chart
viewer.Chart = m;
}
//
// Add a moving average line to the FinanceChart object.
//
protected LineLayer addMovingAvg(FinanceChart m, string avgType, int avgPeriod, int color)
{
if (avgPeriod > 1)
{
if (avgType == "SMA")
return m.addSimpleMovingAvg(avgPeriod, color);
else if (avgType == "EMA")
return m.addExpMovingAvg(avgPeriod, color);
else if (avgType == "TMA")
return m.addTriMovingAvg(avgPeriod, color);
else if (avgType == "WMA")
return m.addWeightedMovingAvg(avgPeriod, color);
}
return null;
}
//
// Add an indicator chart to the FinanceChart object. In this demo example, the indicator
// parameters (such as the period used to compute RSI, colors of the lines, etc.) are hard
// coded to commonly used values. You are welcome to design a more complex user interface
// to allow users to set the parameters.
//
protected XYChart addIndicator(FinanceChart m, string indicator, int height)
{
if (indicator == "RSI")
return m.addRSI(height, 14, 0x800080, 20, 0xff6666, 0x6666ff);
else if (indicator == "StochRSI")
return m.addStochRSI(height, 14, 0x800080, 30, 0xff6666, 0x6666ff);
else if (indicator == "MACD")
return m.addMACD(height, 26, 12, 9, 0xff, 0xff00ff, 0x8000);
else if (indicator == "FStoch")
return m.addFastStochastic(height, 14, 3, 0x6060, 0x606000);
else if (indicator == "SStoch")
return m.addSlowStochastic(height, 14, 3, 0x6060, 0x606000);
else if (indicator == "ATR")
return m.addATR(height, 14, 0x808080, 0xff);
else if (indicator == "ADX")
return m.addADX(height, 14, 0x8000, 0x800000, 0x80);
else if (indicator == "DCW")
return m.addDonchianWidth(height, 20, 0xff);
else if (indicator == "BBW")
return m.addBollingerWidth(height, 20, 2, 0xff);
else if (indicator == "DPO")
return m.addDPO(height, 20, 0xff);
else if (indicator == "PVT")
return m.addPVT(height, 0xff);
else if (indicator == "Momentum")
return m.addMomentum(height, 12, 0xff);
else if (indicator == "Performance")
return m.addPerformance(height, 0xff);
else if (indicator == "ROC")
return m.addROC(height, 12, 0xff);
else if (indicator == "OBV")
return m.addOBV(height, 0xff);
else if (indicator == "AccDist")
return m.addAccDist(height, 0xff);
else if (indicator == "CLV")
return m.addCLV(height, 0xff);
else if (indicator == "WilliamR")
return m.addWilliamR(height, 14, 0x800080, 30, 0xff6666, 0x6666ff);
else if (indicator == "Aroon")
return m.addAroon(height, 14, 0x339933, 0x333399);
else if (indicator == "AroonOsc")
return m.addAroonOsc(height, 14, 0xff);
else if (indicator == "CCI")
return m.addCCI(height, 20, 0x800080, 100, 0xff6666, 0x6666ff);
else if (indicator == "EMV")
return m.addEaseOfMovement(height, 9, 0x6060, 0x606000);
else if (indicator == "MDX")
return m.addMassIndex(height, 0x800080, 0xff6666, 0x6666ff);
else if (indicator == "CVolatility")
return m.addChaikinVolatility(height, 10, 10, 0xff);
else if (indicator == "COscillator")
return m.addChaikinOscillator(height, 0xff);
else if (indicator == "CMF")
return m.addChaikinMoneyFlow(height, 21, 0x8000);
else if (indicator == "NVI")
return m.addNVI(height, 255, 0xff, 0x883333);
else if (indicator == "PVI")
return m.addPVI(height, 255, 0xff, 0x883333);
else if (indicator == "MFI")
return m.addMFI(height, 14, 0x800080, 30, 0xff6666, 0x6666ff);
else if (indicator == "PVO")
return m.addPVO(height, 26, 12, 9, 0xff, 0xff00ff, 0x8000);
else if (indicator == "PPO")
return m.addPPO(height, 26, 12, 9, 0xff, 0xff00ff, 0x8000);
else if (indicator == "UO")
return m.addUltimateOscillator(height, 7, 14, 28, 0x800080, 20, 0xff6666, 0x6666ff);
else if (indicator == "Vol")
return m.addVolIndicator(height, 0x99ff99, 0xff9999, 0xc0c0c0);
else if (indicator == "TRIX")
return m.addTRIX(height, 12, 0xff);
return null;
}
//
// Pointer (Drag to Scroll) button event handler
//
private void pointerPB_CheckedChanged(object sender, EventArgs e)
{
if (((RadioButton)sender).Checked)
winChartViewer1.MouseUsage = WinChartMouseUsage.ScrollOnDrag;
}
//
// Zoom In button event handler
//
private void zoomInPB_CheckedChanged(object sender, EventArgs e)
{
if (((RadioButton)sender).Checked)
winChartViewer1.MouseUsage = WinChartMouseUsage.ZoomIn;
}
//
// Zoom Out button event handler
//
private void zoomOutPB_CheckedChanged(object sender, EventArgs e)
{
if (((RadioButton)sender).Checked)
winChartViewer1.MouseUsage = WinChartMouseUsage.ZoomOut;
}
//
// The viewport changed event handler. In this example, we update the other controls
// (the scroll bar) in addition to the chart.
//
private void winChartViewer1_ViewPortChanged(object sender, WinViewPortEventArgs e)
{
updateControls(winChartViewer1);
// Update the chart if necessary
if (e.NeedUpdateChart)
drawChart(winChartViewer1);
}
//
// Update controls when the view port changed
//
private void updateControls(WinChartViewer viewer)
{
// Update the scroll bar to reflect the view port position and width of the view port.
hScrollBar1.Enabled = viewer.ViewPortWidth < 1;
hScrollBar1.LargeChange = (int)Math.Ceiling(viewer.ViewPortWidth *
(hScrollBar1.Maximum - hScrollBar1.Minimum));
hScrollBar1.SmallChange = (int)Math.Ceiling(hScrollBar1.LargeChange * 0.1);
hScrollBar1.Value = (int)Math.Round(viewer.ViewPortLeft *
(hScrollBar1.Maximum - hScrollBar1.Minimum)) + hScrollBar1.Minimum;
}
//
// The scroll bar event handler
//
private void hScrollBar1_ValueChanged(object sender, EventArgs e)
{
// When the view port is changed (user drags on the chart to scroll), the scroll bar will get
// updated. When the scroll bar changes (eg. user drags on the scroll bar), the view port will
// get updated. This creates an infinite loop. To avoid this, the scroll bar can update the
// view port only if the view port is not updating the scroll bar.
if (hasFinishedInitialization && !winChartViewer1.IsInViewPortChangedEvent)
{
// Set the view port based on the scroll bar
winChartViewer1.ViewPortLeft = ((double)(hScrollBar1.Value - hScrollBar1.Minimum))
/ (hScrollBar1.Maximum - hScrollBar1.Minimum);
// Trigger a view port changed event to update the chart
winChartViewer1.updateViewPort(true, false);
}
}
//
// Draw track cursor when mouse is moving over plotarea
//
private void winChartViewer1_MouseMovePlotArea(object sender, MouseEventArgs e)
{
WinChartViewer viewer = (WinChartViewer)sender;
trackFinance((MultiChart)viewer.Chart, viewer.PlotAreaMouseX);
viewer.updateDisplay();
}
//
// Draw finance chart track line with legend
//
private void trackFinance(MultiChart m, int mouseX)
{
// Clear the current dynamic layer and get the DrawArea object to draw on it.
DrawArea d = m.initDynamicLayer();
// It is possible for a FinanceChart to be empty, so we need to check for it.
if (m.getChartCount() == 0)
return;
// Get the data x-value that is nearest to the mouse
int xValue = (int)(((XYChart)m.getChart(0)).getNearestXValue(mouseX));
// Iterate the XY charts (main price chart and indicator charts) in the FinanceChart
for (int i = 0; i < m.getChartCount(); ++i)
{
XYChart c = (XYChart)m.getChart(i);
// Variables to hold the legend entries
string ohlcLegend = "";
List<string> legendEntries = new List<string>();
// Iterate through all layers to find the highest data point
for (int j = 0; j < c.getLayerCount(); ++j)
{
Layer layer = c.getLayerByZ(j);
int xIndex = layer.getXIndexOf(xValue);
int dataSetCount = layer.getDataSetCount();
// In a FinanceChart, only layers showing OHLC data can have 4 data sets
if (dataSetCount == 4)
{
double highValue = layer.getDataSet(0).getValue(xIndex);
double lowValue = layer.getDataSet(1).getValue(xIndex);
double openValue = layer.getDataSet(2).getValue(xIndex);
double closeValue = layer.getDataSet(3).getValue(xIndex);
if (closeValue != Chart.NoValue)
{
// Build the OHLC legend
ohlcLegend = "Open: " + c.formatValue(openValue, "{value|P4}") + ", High: " +
c.formatValue(highValue, "{value|P4}") + ", Low: " + c.formatValue(lowValue,
"{value|P4}") + ", Close: " + c.formatValue(closeValue, "{value|P4}");
// We also draw an upward or downward triangle for up and down days and the %
// change
double lastCloseValue = layer.getDataSet(3).getValue(xIndex - 1);
if (lastCloseValue != Chart.NoValue)
{
double change = closeValue - lastCloseValue;
double percent = change * 100 / closeValue;
string symbol = ((change >= 0) ?
"<*font,color=008800*><*img=@triangle,width=8,color=008800*>" :
"<*font,color=CC0000*><*img=@invertedtriangle,width=8,color=CC0000*>");
ohlcLegend = ohlcLegend + " " + symbol + " " + c.formatValue(change,
"{value|P4}") + " (" + c.formatValue(percent, "{value|2}") + "%)<*/font*>"
;
}
// Use a <*block*> to make sure the line does not wrap within the legend entry
ohlcLegend = "<*block*>" + ohlcLegend + " <*/*>";
}
}
else
{
// Iterate through all the data sets in the layer
for (int k = 0; k < layer.getDataSetCount(); ++k)
{
ChartDirector.DataSet dataSet = layer.getDataSetByZ(k);
string name = dataSet.getDataName();
double value = dataSet.getValue(xIndex);
if ((!string.IsNullOrEmpty(name)) && (value != Chart.NoValue))
{
// In a FinanceChart, the data set name consists of the indicator name and its
// latest value. It is like "Vol: 123M" or "RSI (14): 55.34". As we are
// generating the values dynamically, we need to extract the indictor name
// out, and also the volume unit (if any).
// The unit character, if any, is the last character and must not be a digit.
string unitChar = name.Substring(name.Length - 1);
if (unitChar.CompareTo("0") >= 0 && unitChar.CompareTo("9") <= 0)
{
unitChar = "";
}
// The indicator name is the part of the name up to the colon character.
int delimiterPosition = name.IndexOf(":");
if (delimiterPosition != -1)
{
name = name.Substring(0, delimiterPosition);
}
// In a FinanceChart, if there are two data sets, it must be representing a
// range.
if (dataSetCount == 2)
{
// We show both values in the range in a single legend entry
value = layer.getDataSet(0).getValue(xIndex);
double value2 = layer.getDataSet(1).getValue(xIndex);
name = name + ": " + c.formatValue(Math.Min(value, value2), "{value|P3}")
+ " - " + c.formatValue(Math.Max(value, value2), "{value|P3}");
}
else
{
// In a FinanceChart, only the layer for volume bars has 3 data sets for
// up/down/flat days
if (dataSetCount == 3)
{
// The actual volume is the sum of the 3 data sets.
value = layer.getDataSet(0).getValue(xIndex) + layer.getDataSet(1
).getValue(xIndex) + layer.getDataSet(2).getValue(xIndex);
}
// Create the legend entry
name = name + ": " + c.formatValue(value, "{value|P3}") + unitChar;
}
// Build the legend entry, consist of a colored square box and the name (with
// the data value in it).
legendEntries.Add("<*block*><*img=@square,width=8,edgeColor=000000,color=" +
dataSet.getDataColor().ToString("x") + "*> " + name + "<*/*>");
}
}
}
}
// Get the plot area position relative to the entire FinanceChart
PlotArea plotArea = c.getPlotArea();
int plotAreaLeftX = plotArea.getLeftX() + c.getAbsOffsetX();
int plotAreaTopY = plotArea.getTopY() + c.getAbsOffsetY();
// The legend is formed by concatenating the legend entries.
legendEntries.Reverse();
string legendText = String.Join(" ", legendEntries);
// Add the date and the ohlcLegend (if any) at the beginning of the legend
legendText = "<*block,valign=top,maxWidth=" + (plotArea.getWidth() - 5) +
"*><*font=Arial Bold*>[" + c.xAxis().getFormattedLabel(xValue, "mmm dd, yyyy") +
"]<*/font*> " + ohlcLegend + legendText;
// Draw a vertical track line at the x-position
d.vline(plotAreaTopY, plotAreaTopY + plotArea.getHeight(), c.getXCoor(xValue) +
plotAreaLeftX - plotArea.getLeftX(), d.dashLineColor(0x000000, 0x0101));
// Display the legend on the top of the plot area
TTFText t = d.text(legendText, "Arial", 8);
t.draw(plotAreaLeftX + 5, plotAreaTopY + 3, 0x000000, Chart.TopLeft);
}
}
}
}
[Windows Forms - VB Version] NetWinCharts\VBNetWinCharts\frmfinancedemo.vb
Imports ChartDirector
Public Class FrmFinanceDemo
' <summary>
' A utility class for adding items to ComboBox
' </summary>
Class ListItem
Dim m_key As String
Dim m_value As String
Public Sub New(ByVal k As String, ByVal v As String)
m_key = k
m_value = v
End Sub
Public ReadOnly Property Key() As String
Get
Return m_key
End Get
End Property
Public Overrides Function ToString() As String
Return m_value
End Function
End Class
' The main ticker key And the compare to ticker key
Private tickerKey As String
Private compareKey As String
Class PriceData
Public timeStamps() As Date
Public highData() As Double
Public lowData() As Double
Public openData() As Double
Public closeData() As Double
Public volData() As Double
'An extra field for price comparison
Public compareData() As Double
End Class
'In this example, we can use daily, weekly Or monthly data depending on the time range
Dim dailyPrice As PriceData
Dim weeklyPrice As PriceData
Dim monthlyPrice As PriceData
' Will set to true at the end of initialization - prevents events from firing before the
' controls are properly initialized.
Private hasFinishedInitialization As Boolean
' <summary>
' Form Load event handler - initialize the form
' </summary>
Private Sub FrmFinanceDemo_Load(ByVal sender As Object, ByVal e As EventArgs) Handles MyBase.Load
timeRange.Items.Add(New ListItem("30", "1 month"))
timeRange.Items.Add(New ListItem("60", "2 months"))
timeRange.SelectedIndex = timeRange.Items.Add(New ListItem("90", "3 months"))
timeRange.Items.Add(New ListItem("180", "6 months"))
timeRange.Items.Add(New ListItem("360", "1 year"))
timeRange.Items.Add(New ListItem("720", "2 years"))
timeRange.Items.Add(New ListItem("1080", "3 years"))
timeRange.Items.Add(New ListItem("1440", "4 years"))
timeRange.Items.Add(New ListItem("1800", "5 years"))
timeRange.Items.Add(New ListItem("3600", "10 years"))
chartType.Items.Add(New ListItem("None", "None"))
chartType.SelectedIndex = chartType.Items.Add(New ListItem("CandleStick", "CandleStick"))
chartType.Items.Add(New ListItem("Close", "Closing Price"))
chartType.Items.Add(New ListItem("Median", "Median Price"))
chartType.Items.Add(New ListItem("OHLC", "OHLC"))
chartType.Items.Add(New ListItem("TP", "Typical Price"))
chartType.Items.Add(New ListItem("WC", "Weighted Close"))
priceBand.Items.Add(New ListItem("None", "None"))
priceBand.SelectedIndex = priceBand.Items.Add(New ListItem("BB", "Bollinger Band"))
priceBand.Items.Add(New ListItem("DC", "Donchain Channel"))
priceBand.Items.Add(New ListItem("Envelop", "Envelop (SMA 20 +/- 10%)"))
avgType1.Items.Add(New ListItem("None", "None"))
avgType1.SelectedIndex = avgType1.Items.Add(New ListItem("SMA", "Simple"))
avgType1.Items.Add(New ListItem("EMA", "Exponential"))
avgType1.Items.Add(New ListItem("TMA", "Triangular"))
avgType1.Items.Add(New ListItem("WMA", "Weighted"))
avgType2.Items.Add(New ListItem("None", "None"))
avgType2.SelectedIndex = avgType2.Items.Add(New ListItem("SMA", "Simple"))
avgType2.Items.Add(New ListItem("EMA", "Exponential"))
avgType2.Items.Add(New ListItem("TMA", "Triangular"))
avgType2.Items.Add(New ListItem("WMA", "Weighted"))
Dim indicators() As ListItem =
{
New ListItem("None", "None"),
New ListItem("AccDist", "Accumulation/Distribution"),
New ListItem("AroonOsc", "Aroon Oscillator"),
New ListItem("Aroon", "Aroon Up/Down"),
New ListItem("ADX", "Avg Directional Index"),
New ListItem("ATR", "Avg True Range"),
New ListItem("BBW", "Bollinger Band Width"),
New ListItem("CMF", "Chaikin Money Flow"),
New ListItem("COscillator", "Chaikin Oscillator"),
New ListItem("CVolatility", "Chaikin Volatility"),
New ListItem("CLV", "Close Location Value"),
New ListItem("CCI", "Commodity Channel Index"),
New ListItem("DPO", "Detrended Price Osc"),
New ListItem("DCW", "Donchian Channel Width"),
New ListItem("EMV", "Ease of Movement"),
New ListItem("FStoch", "Fast Stochastic"),
New ListItem("MACD", "MACD"),
New ListItem("MDX", "Mass Index"),
New ListItem("Momentum", "Momentum"),
New ListItem("MFI", "Money Flow Index"),
New ListItem("NVI", "Neg Volume Index"),
New ListItem("OBV", "On Balance Volume"),
New ListItem("Performance", "Performance"),
New ListItem("PPO", "% Price Oscillator"),
New ListItem("PVO", "% Volume Oscillator"),
New ListItem("PVI", "Pos Volume Index"),
New ListItem("PVT", "Price Volume Trend"),
New ListItem("ROC", "Rate of Change"),
New ListItem("RSI", "RSI"),
New ListItem("SStoch", "Slow Stochastic"),
New ListItem("StochRSI", "StochRSI"),
New ListItem("TRIX", "TRIX"),
New ListItem("UO", "Ultimate Oscillator"),
New ListItem("Vol", "Volume"),
New ListItem("WilliamR", "William's %R")
}
indicator1.Items.AddRange(indicators)
indicator2.Items.AddRange(indicators)
For i As Integer = 0 To UBound(indicators)
If indicators(i).Key = "RSI" Then
indicator1.SelectedIndex = i
ElseIf indicators(i).Key = "MACD" Then
indicator2.SelectedIndex = i
End If
Next
' Enable mouse wheel zooming by setting the zoom ratio to 1.1 per wheel event
winChartViewer1.MouseWheelZoomRatio = 1.1
' Initially set the mouse usage to "Pointer" mode (Drag to Scroll mode)
pointerPB.Checked = True
winChartViewer1.MouseUsage = WinChartMouseUsage.ScrollOnDrag
' Set the ticker symbol And load the data
tickerSymbol.Text = "ASE"
loadData()
' Draw the chart
hasFinishedInitialization = True
winChartViewer1.updateViewPort(True, True)
End Sub
'
' Load data to draw the chart
'
Private Sub loadData()
' Reload main data if ticker key has changed
If tickerKey <> tickerSymbol.Text Then
tickerKey = tickerSymbol.Text
' Simulator to generate realistic random OHLC values
Dim db As FinanceSimulator = New FinanceSimulator(tickerKey, New Date(2010, 1, 1),
New Date(2020, 12, 31), 86400)
' Copy daily data to the data arrays
If IsNothing(dailyPrice) Then
dailyPrice = New PriceData()
End If
dailyPrice.timeStamps = db.getTimeStamps()
dailyPrice.highData = db.getHighData()
dailyPrice.lowData = db.getLowData()
dailyPrice.openData = db.getOpenData()
dailyPrice.closeData = db.getCloseData()
dailyPrice.volData = db.getVolData()
' Set up the viewport to display the duration selected by the user
winChartViewer1.setFullRange("x", 0, dailyPrice.timeStamps.Length - 1)
Dim durationInDays As Integer
Integer.TryParse(timeRange.SelectedItem.Key, durationInDays)
winChartViewer1.ViewPortWidth = durationInDays / dailyPrice.timeStamps.Length
winChartViewer1.ViewPortLeft = 1 - winChartViewer1.ViewPortWidth
End If
' Reload compare data if compare key has changed
If compareKey <> compareWith.Text And Not IsNothing(dailyPrice) Then
compareKey = compareWith.Text
If compareKey = "" Then
dailyPrice.compareData = Nothing
Else
' Simulator to generate realistic random OHLC values
Dim db2 As FinanceSimulator = New FinanceSimulator(compareKey, New Date(2010, 1, 1),
New Date(2020, 12, 31), 86400)
dailyPrice.compareData = db2.getCloseData()
End If
End If
' In this example, we will compute the weekly And monthly prices on demand. We just
' need to clear the old data here.
weeklyPrice = Nothing
monthlyPrice = Nothing
End Sub
'
' Aggregate the data into weekly Or monthly data depending on the aggregator
'
Protected Function aggregateData(aggregator As ArrayMath, p As PriceData) As PriceData
Dim ret As PriceData = New PriceData()
ret.timeStamps = aggregator.aggregate(p.timeStamps, Chart.AggregateFirst)
ret.highData = aggregator.aggregate(p.highData, Chart.AggregateMax)
ret.lowData = aggregator.aggregate(p.lowData, Chart.AggregateMin)
ret.openData = aggregator.aggregate(p.openData, Chart.AggregateFirst)
ret.closeData = aggregator.aggregate(p.closeData, Chart.AggregateLast)
ret.volData = aggregator.aggregate(p.volData, Chart.AggregateSum)
ret.compareData = aggregator.aggregate(p.compareData, Chart.AggregateLast)
Return ret
End Function
'
' In this sample code, the chart updates when the user selection changes. You may
' modify the code to update the data And chart periodically for real time charts.
'
Private Sub SelectionChanged(ByVal sender As System.Object, ByVal e As System.EventArgs) _
Handles volumeBars.CheckedChanged, parabolicSAR.CheckedChanged, logScale.CheckedChanged,
percentageScale.CheckedChanged, chartType.SelectedIndexChanged,
priceBand.SelectedIndexChanged, avgType1.SelectedIndexChanged, movAvg1.TextChanged,
avgType2.SelectedIndexChanged, movAvg2.TextChanged, indicator1.SelectedIndexChanged,
indicator2.SelectedIndexChanged
If hasFinishedInitialization Then
drawChart(winChartViewer1)
End If
End Sub
'
' For the ticker symbols, the chart will update when the user enters a new symbol,
' and then press the enter button or leave the text box.
'
Private Sub tickerSymbol_Leave(ByVal sender As Object, ByVal e As System.EventArgs) _
Handles tickerSymbol.Leave
'User leave ticker symbol text box - redraw chart if symbol has changed
If tickerSymbol.Text = "" Then
' Default Symbol
tickerSymbol.Text = "ASE"
End If
If tickerSymbol.Text <> tickerKey Then
loadData()
drawChart(winChartViewer1)
End If
End Sub
Private Sub tickerSymbol_KeyPress(ByVal sender As Object,
ByVal e As System.Windows.Forms.KeyPressEventArgs) Handles tickerSymbol.KeyPress
' User press enter key - same action as leaving the text box.
If e.KeyChar = vbCr Then
tickerSymbol_Leave(sender, e)
End If
End Sub
Private Sub compareWith_Leave(ByVal sender As Object, ByVal e As System.EventArgs) _
Handles compareWith.Leave
' User leave compare symbol text box - redraw chart if symbol has changed
If compareWith.Text <> compareKey Then
loadData()
drawChart(winChartViewer1)
End If
End Sub
Private Sub compareWith_KeyPress(ByVal sender As Object,
ByVal e As System.Windows.Forms.KeyPressEventArgs) Handles compareWith.KeyPress
' User press enter key - same action as leaving the text box.
If e.KeyChar = vbCr Then
compareWith_Leave(sender, e)
End If
End Sub
Private Sub timeRange_SelectedIndexChanged(sender As Object, e As EventArgs) _
Handles timeRange.SelectedIndexChanged
If hasFinishedInitialization And Not IsNothing(dailyPrice) Then
' Update the viewport to reflect the New time range, then update the chart.
Dim durationInDays As Integer
Integer.TryParse(timeRange.SelectedItem.Key, durationInDays)
winChartViewer1.ViewPortWidth = durationInDays / dailyPrice.timeStamps.Length
winChartViewer1.ViewPortLeft = 1 - winChartViewer1.ViewPortWidth
winChartViewer1.updateViewPort(True, True)
End If
End Sub
' <summary>
' Draw the chart according to user selection and display it in the WebChartViewer.
' </summary>
' <param name="viewer">The WebChartViewer object to display the chart.</param>
Private Sub drawChart(ByVal viewer As WinChartViewer)
' Use InvariantCulture to draw the chart. This ensures the chart will look the
' same on any computer.
System.Threading.Thread.CurrentThread.CurrentCulture =
System.Globalization.CultureInfo.InvariantCulture
' The first moving average period selected by the user.
Dim avgPeriod1 As Integer
Integer.TryParse(movAvg1.Text, avgPeriod1)
' The second moving average period selected by the user.
Dim avgPeriod2 As Integer
Integer.TryParse(movAvg2.Text, avgPeriod2)
' We need extra leading data points in order to compute moving averages.
Dim extraPoints As Integer = Math.Min(300, Math.Max(25, Math.Max(avgPeriod1, avgPeriod2)))
' After determining the extra points, we can obtain the data
Dim startIndex As Integer = Math.Floor(viewer.getValueAtViewPort("x", viewer.ViewPortLeft))
Dim endIndex As Integer = Math.Ceiling(viewer.getValueAtViewPort("x", viewer.ViewPortRight))
' Choose either daily, weekly Or monthly prices depending on the date range
Dim p As PriceData = dailyPrice
' If more than 400 trading days, use weekly Or monthly prices
If endIndex - startIndex >= 400 Then
If endIndex - startIndex < 2000 Then
' Between 400 And 2000 trading days, use weekly prices
If IsNothing(weeklyPrice) Then
' If no weekly prices, compute them from daily prices.
Dim a As ArrayMath = New ArrayMath(dailyPrice.timeStamps)
weeklyPrice = aggregateData(a.selectStartOfWeek(), dailyPrice)
End If
p = weeklyPrice
Else
' More than 2000 trading days, use monthly prices
If IsNothing(monthlyPrice) Then
' If no monthly prices, compute them from daily prices.
Dim a As ArrayMath = New ArrayMath(dailyPrice.timeStamps)
monthlyPrice = aggregateData(a.selectStartOfMonth(), dailyPrice)
End If
p = monthlyPrice
End If
' Re-compute the index based on the weekly/monthly prices
startIndex = Math.Floor(Chart.bSearch(p.timeStamps, dailyPrice.timeStamps(startIndex)))
endIndex = Math.Ceiling(Chart.bSearch(p.timeStamps, dailyPrice.timeStamps(endIndex)))
End If
'
' At this stage, we have determined the price data to use. We need to obtain the part of the
' arrays that are within the visible x-axis range.
'
' Add extra points before the startIndex, as moving averages And may technical indicators
' requires data before the first visible point.
extraPoints = Math.Min(extraPoints, startIndex)
startIndex -= extraPoints
Dim duration As Integer = endIndex - startIndex + 1
Dim vpTimeStamps() As Date = Chart.arraySlice(p.timeStamps, startIndex, duration)
Dim vpHighData() As Double = Chart.arraySlice(p.highData, startIndex, duration)
Dim vpLowData() As Double = Chart.arraySlice(p.lowData, startIndex, duration)
Dim vpOpenData() As Double = Chart.arraySlice(p.openData, startIndex, duration)
Dim vpCloseData() As Double = Chart.arraySlice(p.closeData, startIndex, duration)
Dim vpVolData() As Double = Chart.arraySlice(p.volData, startIndex, duration)
Dim vpCompareData() As Double = Chart.arraySlice(p.compareData, startIndex, duration)
'
'The Chart size.
'
Dim width As Integer = 780
Dim mainHeight As Integer = 255
Dim indicatorHeight As Integer = 80
' Create the chart object using the selected size
Dim m As FinanceChart = New FinanceChart(width)
' Hide default legend box as we are using dynamic legend
m.setLegendStyle("normal", 8, Chart.Transparent, Chart.Transparent)
' Set the data into the chart object
m.setData(vpTimeStamps, vpHighData, vpLowData, vpOpenData, vpCloseData, vpVolData, extraPoints)
' Put the ticker key at the bottom left of the FinanceChart title region
m.addPlotAreaTitle(Chart.BottomLeft, tickerSymbol.Text)
' A copyright message at the bottom left corner the title area
m.addPlotAreaTitle(Chart.BottomRight, "<*font=arial.ttf,size=8*>(c) Advanced Software Engineering")
' Add the main chart
m.addMainChart(mainHeight)
' Set log or linear scale according to user preference
m.setLogScale(logScale.Checked)
' Set axis labels to show data values or percentage change to user preference
If percentageScale.Checked Then
m.setPercentageAxis()
End If
' Draw any price line the user has selected
Dim mainType As String = chartType.SelectedItem.Key
If mainType = "Close" Then
m.addCloseLine(&H40)
ElseIf mainType = "TP" Then
m.addTypicalPrice(&H40)
ElseIf mainType = "WC" Then
m.addWeightedClose(&H40)
ElseIf mainType = "Median" Then
m.addMedianPrice(&H40)
End If
' Add comparison line if there is data for comparison
If (Not IsNothing(vpCompareData)) AndAlso vpCompareData.Length > extraPoints Then
m.addComparison(vpCompareData, &HFF, compareKey)
End If
' Add moving average lines.
'
addMovingAvg(m, avgType1.SelectedItem.Key, avgPeriod1, &H663300)
addMovingAvg(m, avgType2.SelectedItem.Key, avgPeriod2, &H9900FF)
' Draw candlesticks or OHLC symbols if the user has selected them.
If mainType = "CandleStick" Then
m.addCandleStick(&H33FF33, &HFF3333)
ElseIf mainType = "OHLC" Then
m.addHLOC(&H8800, &HCC0000)
End If
' Add parabolic SAR if necessary
If parabolicSAR.Checked Then
m.addParabolicSAR(0.02, 0.02, 0.2, Chart.DiamondShape, 5, &H8800, &H0)
End If
' Add price band/channel/envelop to the chart according to user selection
If priceBand.SelectedItem.Key = "BB" Then
m.addBollingerBand(20, 2, &H9999FF, &HC06666FF)
ElseIf priceBand.SelectedItem.Key = "DC" Then
m.addDonchianChannel(20, &H9999FF, &HC06666FF)
ElseIf priceBand.SelectedItem.Key = "Envelop" Then
m.addEnvelop(20, 0.1, &H9999FF, &HC06666FF)
End If
' Add volume bars to the main chart if necessary
If volumeBars.Checked Then
m.addVolBars(indicatorHeight, &H99FF99, &HFF9999, &HC0C0C0)
End If
' Add additional indicators as according to user selection.
addIndicator(m, indicator1.SelectedItem.Key, indicatorHeight)
addIndicator(m, indicator2.SelectedItem.Key, indicatorHeight)
' We may need to update the track line. If the mouse Is moving on the chart, the track line
' will be updated in MouseMovePlotArea. Otherwise, we need to update the track line here.
If Not viewer.IsInMouseMoveEvent Then
trackfinance(m, IIf(IsNothing(viewer.Chart),
DirectCast(m.getChart(0), XYChart).getPlotArea().getRightX(), viewer.PlotAreaMouseX))
End If
' output the chart
viewer.Chart = m
End Sub
'
' Add a moving average line to the FinanceChart object.
'
Protected Function addMovingAvg(ByVal m As FinanceChart, ByVal avgType As String,
ByVal avgPeriod As Integer, ByVal color As Integer) As LineLayer
If avgPeriod > 1 Then
If avgType = "SMA" Then
Return m.addSimpleMovingAvg(avgPeriod, color)
ElseIf avgType = "EMA" Then
Return m.addExpMovingAvg(avgPeriod, color)
ElseIf avgType = "TMA" Then
Return m.addTriMovingAvg(avgPeriod, color)
ElseIf avgType = "WMA" Then
Return m.addWeightedMovingAvg(avgPeriod, color)
End If
End If
Return Nothing
End Function
'
' Add an indicator chart to the FinanceChart object. In this demo example, the indicator
' parameters (such as the period used to compute RSI, colors of the lines, etc.) are hard
' coded to commonly used values. You are welcome to design a more complex user interface
' to allow users to set the parameters.
'
Protected Function addIndicator(ByVal m As FinanceChart, ByVal indicator As String,
ByVal height As Integer) As XYChart
If indicator = "RSI" Then
Return m.addRSI(height, 14, &H800080, 20, &HFF6666, &H6666FF)
ElseIf indicator = "StochRSI" Then
Return m.addStochRSI(height, 14, &H800080, 30, &HFF6666, &H6666FF)
ElseIf indicator = "MACD" Then
Return m.addMACD(height, 26, 12, 9, &HFF, &HFF00FF, &H8000)
ElseIf indicator = "FStoch" Then
Return m.addFastStochastic(height, 14, 3, &H6060, &H606000)
ElseIf indicator = "SStoch" Then
Return m.addSlowStochastic(height, 14, 3, &H6060, &H606000)
ElseIf indicator = "ATR" Then
Return m.addATR(height, 14, &H808080, &HFF)
ElseIf indicator = "ADX" Then
Return m.addADX(height, 14, &H8000, &H800000, &H80)
ElseIf indicator = "DCW" Then
Return m.addDonchianWidth(height, 20, &HFF)
ElseIf indicator = "BBW" Then
Return m.addBollingerWidth(height, 20, 2, &HFF)
ElseIf indicator = "DPO" Then
Return m.addDPO(height, 20, &HFF)
ElseIf indicator = "PVT" Then
Return m.addPVT(height, &HFF)
ElseIf indicator = "Momentum" Then
Return m.addMomentum(height, 12, &HFF)
ElseIf indicator = "Performance" Then
Return m.addPerformance(height, &HFF)
ElseIf indicator = "ROC" Then
Return m.addROC(height, 12, &HFF)
ElseIf indicator = "OBV" Then
Return m.addOBV(height, &HFF)
ElseIf indicator = "AccDist" Then
Return m.addAccDist(height, &HFF)
ElseIf indicator = "CLV" Then
Return m.addCLV(height, &HFF)
ElseIf indicator = "WilliamR" Then
Return m.addWilliamR(height, 14, &H800080, 30, &HFF6666, &H6666FF)
ElseIf indicator = "Aroon" Then
Return m.addAroon(height, 14, &H339933, &H333399)
ElseIf indicator = "AroonOsc" Then
Return m.addAroonOsc(height, 14, &HFF)
ElseIf indicator = "CCI" Then
Return m.addCCI(height, 20, &H800080, 100, &HFF6666, &H6666FF)
ElseIf indicator = "EMV" Then
Return m.addEaseOfMovement(height, 9, &H6060, &H606000)
ElseIf indicator = "MDX" Then
Return m.addMassIndex(height, &H800080, &HFF6666, &H6666FF)
ElseIf indicator = "CVolatility" Then
Return m.addChaikinVolatility(height, 10, 10, &HFF)
ElseIf indicator = "COscillator" Then
Return m.addChaikinOscillator(height, &HFF)
ElseIf indicator = "CMF" Then
Return m.addChaikinMoneyFlow(height, 21, &H8000)
ElseIf indicator = "NVI" Then
Return m.addNVI(height, 255, &HFF, &H883333)
ElseIf indicator = "PVI" Then
Return m.addPVI(height, 255, &HFF, &H883333)
ElseIf indicator = "MFI" Then
Return m.addMFI(height, 14, &H800080, 30, &HFF6666, &H6666FF)
ElseIf indicator = "PVO" Then
Return m.addPVO(height, 26, 12, 9, &HFF, &HFF00FF, &H8000)
ElseIf indicator = "PPO" Then
Return m.addPPO(height, 26, 12, 9, &HFF, &HFF00FF, &H8000)
ElseIf indicator = "UO" Then
Return m.addUltimateOscillator(height, 7, 14, 28, &H800080, 20, &HFF6666,
&H6666FF)
ElseIf indicator = "Vol" Then
Return m.addVolIndicator(height, &H99FF99, &HFF9999, &HC0C0C0)
ElseIf indicator = "TRIX" Then
Return m.addTRIX(height, 12, &HFF)
End If
Return Nothing
End Function
'
' Pointer (Drag to Scroll) button event handler
'
Private Sub pointerPB_CheckedChanged(ByVal sender As Object, ByVal e As EventArgs) _
Handles pointerPB.CheckedChanged
If sender.Checked Then
winChartViewer1.MouseUsage = WinChartMouseUsage.ScrollOnDrag
End If
End Sub
'
' Zoom In button event handler
'
Private Sub zoomInPB_CheckedChanged(ByVal sender As Object, ByVal e As EventArgs) _
Handles zoomInPB.CheckedChanged
If sender.Checked Then
winChartViewer1.MouseUsage = WinChartMouseUsage.ZoomIn
End If
End Sub
'
' Zoom Out button event handler
'
Private Sub zoomOutPB_CheckedChanged(ByVal sender As Object, ByVal e As EventArgs) _
Handles zoomOutPB.CheckedChanged
If sender.Checked Then
winChartViewer1.MouseUsage = WinChartMouseUsage.ZoomOut
End If
End Sub
'
' The viewport changed event handler. In this example, we update the other controls
' (the scroll bar) in addition to the chart.
'
Private Sub winChartViewer1_ViewPortChanged(ByVal sender As Object,
ByVal e As WinViewPortEventArgs) Handles winChartViewer1.ViewPortChanged
updateControls(winChartViewer1)
' Update the chart if necessary
If e.NeedUpdateChart Then
drawChart(winChartViewer1)
End If
End Sub
'
' Update controls when the view port changed
'
Private Sub updateControls(ByVal viewer As WinChartViewer)
' Update the scroll bar to reflect the view port position and width of the view port.
hScrollBar1.Enabled = viewer.ViewPortWidth < 1
hScrollBar1.LargeChange = Math.Ceiling(viewer.ViewPortWidth *
(hScrollBar1.Maximum - hScrollBar1.Minimum))
hScrollBar1.SmallChange = Math.Ceiling(hScrollBar1.LargeChange * 0.1)
hScrollBar1.Value = Math.Round(viewer.ViewPortLeft *
(hScrollBar1.Maximum - hScrollBar1.Minimum)) + hScrollBar1.Minimum
End Sub
'
' The scroll bar event handler
'
Private Sub hScrollBar1_ValueChanged(ByVal sender As Object, ByVal e As EventArgs) _
Handles hScrollBar1.ValueChanged
' When the view port is changed (user drags on the chart to scroll), the scroll bar will get
' updated. When the scroll bar changes (eg. user drags on the scroll bar), the view port will
' get updated. This creates an infinite loop. To avoid this, the scroll bar can update the
' view port only if the view port is not updating the scroll bar.
If hasFinishedInitialization And Not winChartViewer1.IsInViewPortChangedEvent Then
' Set the view port based on the scroll bar
winChartViewer1.ViewPortLeft = (hScrollBar1.Value - hScrollBar1.Minimum) /
(hScrollBar1.Maximum - hScrollBar1.Minimum)
' Trigger a view port changed event to update the chart
winChartViewer1.updateViewPort(True, False)
End If
End Sub
'
' Draw track cursor when mouse is moving over plotarea
'
Private Sub winChartViewer1_MouseMovePlotArea(ByVal sender As Object,
ByVal e As System.Windows.Forms.MouseEventArgs) Handles winChartViewer1.MouseMovePlotArea
Dim viewer As WinChartViewer = sender
trackfinance(viewer.Chart, viewer.PlotAreaMouseX)
viewer.updateDisplay()
End Sub
'
' Draw finance chart track line with legend
'
Private Sub trackFinance(m As MultiChart, mouseX As Integer)
' Clear the current dynamic layer and get the DrawArea object to draw on it.
Dim d As DrawArea = m.initDynamicLayer()
' It is possible for a FinanceChart to be empty, so we need to check for it.
If m.getChartCount() = 0 Then
Return
End If
' Get the data x-value that is nearest to the mouse
Dim xValue As Integer = Int(CType(m.getChart(0), XYChart).getNearestXValue(mouseX))
' Iterate the XY charts (main price chart and indicator charts) in the FinanceChart
Dim c As XYChart = Nothing
For i As Integer = 0 To m.getChartCount() - 1
c = CType(m.getChart(i), XYChart)
' Variables to hold the legend entries
Dim ohlcLegend As String = ""
Dim legendEntries As ArrayList = New ArrayList()
' Iterate through all layers to find the highest data point
For j As Integer = 0 To c.getLayerCount() - 1
Dim layer As Layer = c.getLayerByZ(j)
Dim xIndex As Integer = layer.getXIndexOf(xValue)
Dim dataSetCount As Integer = layer.getDataSetCount()
' In a FinanceChart, only layers showing OHLC data can have 4 data sets
If dataSetCount = 4 Then
Dim highValue As Double = layer.getDataSet(0).getValue(xIndex)
Dim lowValue As Double = layer.getDataSet(1).getValue(xIndex)
Dim openValue As Double = layer.getDataSet(2).getValue(xIndex)
Dim closeValue As Double = layer.getDataSet(3).getValue(xIndex)
If closeValue <> Chart.NoValue Then
' Build the OHLC legend
ohlcLegend = "Open: " & c.formatValue(openValue, "{value|P4}") & ", High: " &
c.formatValue(highValue, "{value|P4}") & ", Low: " & c.formatValue(lowValue,
"{value|P4}") & ", Close: " & c.formatValue(closeValue, "{value|P4}")
' We also draw an upward or downward triangle for up and down days and the % change
Dim lastCloseValue As Double = layer.getDataSet(3).getValue(xIndex - 1)
If lastCloseValue <> Chart.NoValue Then
Dim change As Double = closeValue - lastCloseValue
Dim percent As Double = change * 100 / closeValue
Dim symbol As String = IIf(change >= 0,
"<*font,color=008800*><*img=@triangle,width=8,color=008800*>",
"<*font,color=CC0000*><*img=@invertedtriangle,width=8,color=CC0000*>")
ohlcLegend = ohlcLegend & " " & symbol & " " & c.formatValue(change,
"{value|P4}") & " (" & c.formatValue(percent, "{value|2}") & "%)<*/font*>"
End If
' Use a <*block*> to make sure the line does not wrap within the legend entry
ohlcLegend = "<*block*>" & ohlcLegend & " <*/*>"
End If
Else
' Iterate through all the data sets in the layer
For k As Integer = 0 To layer.getDataSetCount() - 1
Dim dataSet As ChartDirector.DataSet = layer.getDataSetByZ(k)
Dim name As String = dataSet.getDataName()
Dim value As Double = dataSet.getValue(xIndex)
If (Not String.IsNullOrEmpty(name)) AndAlso (value <> Chart.NoValue) Then
' In a FinanceChart, the data set name consists of the indicator name and its
' latest value. It is like "Vol: 123M" or "RSI (14): 55.34". As we are generating
' the values dynamically, we need to extract the indictor name out, and also the
' volume unit (if any).
' The unit character, if any, is the last character and must not be a digit.
Dim unitChar As String = name.Substring(name.Length - 1)
If (unitChar.CompareTo("0") >= 0) AndAlso (unitChar.CompareTo("9") <= 0) Then
unitChar = ""
End If
' The indicator name is the part of the name up to the colon character.
Dim delimiterPosition As Integer = name.IndexOf(":")
If delimiterPosition <> -1 Then
name = name.Substring(0, delimiterPosition)
End If
' In a FinanceChart, if there are two data sets, it must be representing a range.
If dataSetCount = 2 Then
' We show both values in the range in a single legend entry
value = layer.getDataSet(0).getValue(xIndex)
Dim value2 As Double = layer.getDataSet(1).getValue(xIndex)
name = name & ": " & c.formatValue(Math.Min(value, value2), "{value|P3}") &
" - " & c.formatValue(Math.Max(value, value2), "{value|P3}")
Else
' In a FinanceChart, only the layer for volume bars has 3 data sets for
' up/down/flat days
If dataSetCount = 3 Then
' The actual volume is the sum of the 3 data sets.
value = layer.getDataSet(0).getValue(xIndex) + layer.getDataSet(1
).getValue(xIndex) + layer.getDataSet(2).getValue(xIndex)
End If
' Create the legend entry
name = name & ": " & c.formatValue(value, "{value|P3}") & unitChar
End If
' Build the legend entry, consist of a colored square box and the name (with the
' data value in it).
legendEntries.Add("<*block*><*img=@square,width=8,edgeColor=000000,color=" &
Hex(dataSet.getDataColor()) & "*> " & name & "<*/*>")
End If
Next
End If
Next
' Get the plot area position relative to the entire FinanceChart
Dim plotArea As PlotArea = c.getPlotArea()
Dim plotAreaLeftX As Integer = plotArea.getLeftX() + c.getAbsOffsetX()
Dim plotAreaTopY As Integer = plotArea.getTopY() + c.getAbsOffsetY()
' The legend is formed by concatenating the legend entries.
legendEntries.Reverse()
Dim legendText As String = Join(CType(legendEntries.ToArray(GetType(String)), String()),
" ")
' Add the date and the ohlcLegend (if any) at the beginning of the legend
legendText = "<*block,valign=top,maxWidth=" & (plotArea.getWidth() - 5) &
"*><*font=Arial Bold*>[" & c.xAxis().getFormattedLabel(xValue, "mmm dd, yyyy") &
"]<*/font*> " & ohlcLegend & legendText
' Draw a vertical track line at the x-position
d.vline(plotAreaTopY, plotAreaTopY + plotArea.getHeight(), c.getXCoor(xValue) + c.getAbsOffsetX(
), d.dashLineColor(&H0, &H101))
' Display the legend on the top of the plot area
Dim t As TTFText = d.text(legendText, "Arial", 8)
t.draw(plotAreaLeftX + 5, plotAreaTopY + 3, &H0, Chart.TopLeft)
Next
End Sub
End Class
[WPF - XAML] NetWPFCharts\CSharpWPFCharts\FinanceDemoWindow.xaml
<Window x:Class="CSharpWPFCharts.FinanceDemoWindow"
        xmlns="http://schemas.microsoft.com/winfx/2006/xaml/presentation"
        xmlns:x="http://schemas.microsoft.com/winfx/2006/xaml"
        xmlns:d="http://schemas.microsoft.com/expression/blend/2008"
        xmlns:mc="http://schemas.openxmlformats.org/markup-compatibility/2006"
        xmlns:local="clr-namespace:CSharpWPFCharts"
        mc:Ignorable="d"
        xmlns:ChartDirector="clr-namespace:ChartDirector;assembly=netchartdir" UseLayoutRounding="True"
        Title="ChartDirector Financial Chart Demonstration" SizeToContent="WidthAndHeight" Loaded="Window_Loaded">
    <Window.Resources>
        <Style TargetType="TextBlock" x:Key="LabelStyle">
            <Setter Property="Margin" Value="0,6,0,0" />
            <Setter Property="FontWeight" Value="Bold" />
        </Style>
    </Window.Resources>
    <DockPanel>
        <Label Content="Advanced Software Engineering" DockPanel.Dock="Top" FontFamily="Arial" FontStyle="Italic" FontWeight="Bold"
               FontSize="13" Background="#FF02098D" Foreground="#FFF4FF04" HorizontalContentAlignment="Right" />
        <Grid DockPanel.Dock="Left" Width="160" Background="#FFBADDFF">
            <StackPanel Margin="8,0,8,8" ComboBox.SelectionChanged="ChartConfig_Changed" CheckBox.Checked="ChartConfig_Changed"
                        CheckBox.Unchecked="ChartConfig_Changed">
                <StackPanel Orientation="Horizontal" HorizontalAlignment="Center">
                    <RadioButton x:Name="pointerPB" Style="{StaticResource {x:Type ToggleButton}}" Checked="pointerPB_Checked" Margin="7" >
                        <Image Source="/icons/scroll_icon.png" Height="20" Width="20" Margin="6"/>
                    </RadioButton>
                    <RadioButton x:Name="zoomInPB" Style="{StaticResource {x:Type ToggleButton}}" Checked="zoomInPB_Checked" Margin="7" >
                        <Image Source="/icons/zoomin_icon.png" Height="20" Width="20" Margin="6"/>
                    </RadioButton>
                    <RadioButton x:Name="zoomOutPB" Style="{StaticResource {x:Type ToggleButton}}" Checked="zoomOutPB_Checked" Margin="7" >
                        <Image Source="/icons/zoomout_icon.png" Height="20" Width="20" Margin="6"/>
                    </RadioButton>
                </StackPanel>
                <TextBlock Style="{StaticResource LabelStyle}" ><Run Text="Ticker Symbol"/></TextBlock>
                <TextBox Name="tickerSymbol" LostFocus="tickerSymbol_LostFocus" KeyDown="tickerSymbol_KeyDown" Padding="2">ASE.Symbol</TextBox>
                <TextBlock Text="Compare Width" Style="{StaticResource LabelStyle}" />
                <TextBox Name="compareWith" KeyDown="compareWith_KeyDown" LostFocus="compareWith_LostFocus" Padding="2"></TextBox>
                <TextBlock Text="Time Period" Style="{StaticResource LabelStyle}" />
                <ComboBox Name="timeRange" SelectionChanged="timeRange_Changed"/>
                <TextBlock Text="Chart Type" Style="{StaticResource LabelStyle}" />
                <ComboBox Name="chartType" />
                <CheckBox Name="volumeBars" Margin="0,8,0,3" IsChecked="True">Show Volume Bars</CheckBox>
                <CheckBox Name="parabolicSAR" Margin="0,0,0,3">Parabolic SAR</CheckBox>
                <CheckBox Name="logScale" Margin="0,0,0,3">Log Scale</CheckBox>
                <CheckBox Name="percentageScale">Percentage Scale</CheckBox>
                <TextBlock Text="Price Band" Style="{StaticResource LabelStyle}" />
                <ComboBox Name="priceBand" />
                <TextBlock Text="Moving Averages" Style="{StaticResource LabelStyle}" />
                <DockPanel Margin="0,0,0,1">
                    <TextBox DockPanel.Dock="Right" Width="40" Name="movAvg1" TextChanged="ChartConfig_Changed">10</TextBox>
                    <ComboBox Name="avgType1" />
                </DockPanel>
                <DockPanel>
                    <TextBox DockPanel.Dock="Right" Width="40" Name="movAvg2" TextChanged="ChartConfig_Changed">25</TextBox>
                    <ComboBox Name="avgType2" />
                </DockPanel>
                <TextBlock Text="Technical Indicators" Style="{StaticResource LabelStyle}" />
                <ComboBox Name="indicator1" Margin="0,0,0,1" />
                <ComboBox Name="indicator2"/>
            </StackPanel>
        </Grid>
        <ChartDirector:WPFChartViewer x:Name="WPFChartViewer1" DockPanel.Dock="Top" Width="780" Height="470" Margin="8"
              ViewPortChanged="WPFChartViewer1_ViewPortChanged" MouseMovePlotArea="WPFChartViewer1_MouseMovePlotArea" />
        <ScrollBar x:Name="hScrollBar1" DockPanel.Dock="Top" Orientation="Horizontal" ValueChanged="hScrollBar1_ValueChanged"/>
    </DockPanel>
</Window>
[WPF - C#] NetWPFCharts\CSharpWPFCharts\FinanceDemoWindow.xaml.cs
using System;
using System.Windows;
using System.Windows.Input;
using System.Collections.Generic;
using ChartDirector;
namespace CSharpWPFCharts
{
//
// Interaction logic for FinanceDemoWindow.xaml
//
public partial class FinanceDemoWindow : Window
{
public FinanceDemoWindow()
{
InitializeComponent();
}
//
// A utility class for adding items to ComboBox
//
private class ListItem
{
string m_key;
string m_value;
public ListItem(string key, string val)
{
m_key = key;
m_value = val;
}
public string Key
{
get { return m_key; }
}
public override string ToString()
{
return m_value;
}
}
// The main ticker key and the compare to ticker key
private string tickerKey;
private string compareKey;
class PriceData
{
public DateTime[] timeStamps;
public double[] highData;
public double[] lowData;
public double[] openData;
public double[] closeData;
public double[] volData;
// An extra field for price comparison
public double[] compareData;
};
// In this example, we can use daily, weekly or monthly data depending on the time range
PriceData dailyPrice;
PriceData weeklyPrice;
PriceData monthlyPrice;
// Will set to true at the end of initialization - prevents events from firing before the
// controls are properly initialized.
private bool hasFinishedInitialization = false;
/// <summary>
/// Form Load event handler - initialize the form
/// </summary>
private void Window_Loaded(object sender, RoutedEventArgs e)
{
hasFinishedInitialization = false;
timeRange.Items.Add(new ListItem("30", "1 month"));
timeRange.Items.Add(new ListItem("60", "2 months"));
timeRange.SelectedIndex = timeRange.Items.Add(new ListItem("90", "3 months"));
timeRange.Items.Add(new ListItem("180", "6 months"));
timeRange.Items.Add(new ListItem("360", "1 year"));
timeRange.Items.Add(new ListItem("720", "2 years"));
timeRange.Items.Add(new ListItem("1080", "3 years"));
timeRange.Items.Add(new ListItem("1440", "4 years"));
timeRange.Items.Add(new ListItem("1800", "5 years"));
timeRange.Items.Add(new ListItem("3600", "10 years"));
chartType.Items.Add(new ListItem("None", "None"));
chartType.SelectedIndex = chartType.Items.Add(new ListItem("CandleStick", "CandleStick"));
chartType.Items.Add(new ListItem("Close", "Closing Price"));
chartType.Items.Add(new ListItem("Median", "Median Price"));
chartType.Items.Add(new ListItem("OHLC", "OHLC"));
chartType.Items.Add(new ListItem("TP", "Typical Price"));
chartType.Items.Add(new ListItem("WC", "Weighted Close"));
priceBand.Items.Add(new ListItem("None", "None"));
priceBand.SelectedIndex = priceBand.Items.Add(new ListItem("BB", "Bollinger Band"));
priceBand.Items.Add(new ListItem("DC", "Donchain Channel"));
priceBand.Items.Add(new ListItem("Envelop", "Envelop (SMA 20 +/- 10%)"));
avgType1.Items.Add(new ListItem("None", "None"));
avgType1.SelectedIndex = avgType1.Items.Add(new ListItem("SMA", "Simple"));
avgType1.Items.Add(new ListItem("EMA", "Exponential"));
avgType1.Items.Add(new ListItem("TMA", "Triangular"));
avgType1.Items.Add(new ListItem("WMA", "Weighted"));
avgType2.Items.Add(new ListItem("None", "None"));
avgType2.SelectedIndex = avgType2.Items.Add(new ListItem("SMA", "Simple"));
avgType2.Items.Add(new ListItem("EMA", "Exponential"));
avgType2.Items.Add(new ListItem("TMA", "Triangular"));
avgType2.Items.Add(new ListItem("WMA", "Weighted"));
ListItem[] indicators =
{
new ListItem("None", "None"),
new ListItem("AccDist", "Accumulation/Distribution"),
new ListItem("AroonOsc", "Aroon Oscillator"),
new ListItem("Aroon", "Aroon Up/Down"),
new ListItem("ADX", "Avg Directional Index"),
new ListItem("ATR", "Avg True Range"),
new ListItem("BBW", "Bollinger Band Width"),
new ListItem("CMF", "Chaikin Money Flow"),
new ListItem("COscillator", "Chaikin Oscillator"),
new ListItem("CVolatility", "Chaikin Volatility"),
new ListItem("CLV", "Close Location Value"),
new ListItem("CCI", "Commodity Channel Index"),
new ListItem("DPO", "Detrended Price Osc"),
new ListItem("DCW", "Donchian Channel Width"),
new ListItem("EMV", "Ease of Movement"),
new ListItem("FStoch", "Fast Stochastic"),
new ListItem("MACD", "MACD"),
new ListItem("MDX", "Mass Index"),
new ListItem("Momentum", "Momentum"),
new ListItem("MFI", "Money Flow Index"),
new ListItem("NVI", "Neg Volume Index"),
new ListItem("OBV", "On Balance Volume"),
new ListItem("Performance", "Performance"),
new ListItem("PPO", "% Price Oscillator"),
new ListItem("PVO", "% Volume Oscillator"),
new ListItem("PVI", "Pos Volume Index"),
new ListItem("PVT", "Price Volume Trend"),
new ListItem("ROC", "Rate of Change"),
new ListItem("RSI", "RSI"),
new ListItem("SStoch", "Slow Stochastic"),
new ListItem("StochRSI", "StochRSI"),
new ListItem("TRIX", "TRIX"),
new ListItem("UO", "Ultimate Oscillator"),
new ListItem("Vol", "Volume"),
new ListItem("WilliamR", "William's %R")
};
for (int i = 0; i < indicators.Length; ++i)
{
indicator1.Items.Add(indicators[i]);
indicator2.Items.Add(indicators[i]);
}
for (int i = 0; i < indicators.Length; ++i)
{
if (indicators[i].Key == "RSI")
indicator1.SelectedIndex = i;
else if (indicators[i].Key == "MACD")
indicator2.SelectedIndex = i;
}
// Enable mouse wheel zooming by setting the zoom ratio to 1.1 per wheel event
WPFChartViewer1.MouseWheelZoomRatio = 1.1;
// Initially set the mouse usage to "Pointer" mode (Drag to Scroll mode)
pointerPB.IsChecked = true;
WPFChartViewer1.MouseUsage = WinChartMouseUsage.ScrollOnDrag;
// Set the ticker symbol and load the data
tickerSymbol.Text = "ASE";
loadData();
// Draw the chart
hasFinishedInitialization = true;
drawChart(WPFChartViewer1);
}
//
// Load data to draw the chart
//
private void loadData()
{
// Reload main data if ticker key has changed
if (tickerKey != tickerSymbol.Text.Trim())
{
tickerKey = tickerSymbol.Text.Trim();
// Simulator to generate realistic random OHLC values
FinanceSimulator db = new FinanceSimulator(tickerKey, new DateTime(2010, 1, 1),
new DateTime(2020, 12, 31), 86400);
// Copy daily data to the data arrays
if (null == dailyPrice)
dailyPrice = new PriceData();
dailyPrice.timeStamps = db.getTimeStamps();
dailyPrice.highData = db.getHighData();
dailyPrice.lowData = db.getLowData();
dailyPrice.openData = db.getOpenData();
dailyPrice.closeData = db.getCloseData();
dailyPrice.volData = db.getVolData();
// Set up the viewport to display the duration selected by the user
WPFChartViewer1.setFullRange("x", 0, dailyPrice.timeStamps.Length - 1);
int durationInDays;
int.TryParse(((ListItem)timeRange.SelectedItem).Key, out durationInDays);
WPFChartViewer1.ViewPortWidth = durationInDays / (double)dailyPrice.timeStamps.Length;
WPFChartViewer1.ViewPortLeft = 1 - WPFChartViewer1.ViewPortWidth;
}
// Reload compare data if compare key has changed
if ((compareKey != compareWith.Text.Trim()) && (dailyPrice != null))
{
compareKey = compareWith.Text.Trim();
if (compareKey == "")
dailyPrice.compareData = null;
else
{
// Simulator to generate realistic random OHLC values
FinanceSimulator db2 = new FinanceSimulator(compareKey, new DateTime(2010, 1, 1),
new DateTime(2020, 12, 31), 86400);
dailyPrice.compareData = db2.getCloseData();
}
}
// In this example, we will compute the weekly and monthly prices on demand. We just
// need to clear the old data here.
weeklyPrice = null;
monthlyPrice = null;
}
//
// Aggregate the data into weekly or monthly data depending on the aggregator
//
PriceData aggregateData(ArrayMath aggregator, PriceData p)
{
PriceData ret = new PriceData();
ret.timeStamps = aggregator.aggregate(p.timeStamps, Chart.AggregateFirst);
ret.highData = aggregator.aggregate(p.highData, Chart.AggregateMax);
ret.lowData = aggregator.aggregate(p.lowData, Chart.AggregateMin);
ret.openData = aggregator.aggregate(p.openData, Chart.AggregateFirst);
ret.closeData = aggregator.aggregate(p.closeData, Chart.AggregateLast);
ret.volData = aggregator.aggregate(p.volData, Chart.AggregateSum);
ret.compareData = aggregator.aggregate(p.compareData, Chart.AggregateLast);
return ret;
}
//
// In this sample code, the chart updates when the user selection changes. You may
// modify the code to update the data and chart periodically for real time charts.
//
private void ChartConfig_Changed(object sender, EventArgs e)
{
if (hasFinishedInitialization)
drawChart(WPFChartViewer1);
}
//
// For the ticker symbols, the chart will update when the user enters a new symbol,
// and then press the enter button or leave the text box.
//
private void tickerSymbol_LostFocus(object sender, RoutedEventArgs e)
{
// User leave ticker symbol text box - redraw chart if symbol has changed
if (tickerSymbol.Text.Trim() == "")
// Default Symbol
tickerSymbol.Text = "ASE";
if (tickerSymbol.Text.Trim() != tickerKey)
{
loadData();
drawChart(WPFChartViewer1);
}
}
private void tickerSymbol_KeyDown(object sender, KeyEventArgs e)
{
// User press enter key - same action as leaving the text box.
if (e.Key == Key.Return)
tickerSymbol_LostFocus(sender, e);
}
private void compareWith_LostFocus(object sender, RoutedEventArgs e)
{
// User leave compare symbol text box - redraw chart if symbol has changed
if (compareWith.Text.Trim() != compareKey)
{
loadData();
drawChart(WPFChartViewer1);
}
}
private void compareWith_KeyDown(object sender, KeyEventArgs e)
{
// User press enter key - same action as leaving the text box.
if (e.Key == Key.Return)
compareWith_LostFocus(sender, e);
}
//
// The time range selection changes
//
private void timeRange_Changed(object sender, EventArgs e)
{
if (hasFinishedInitialization && (null != dailyPrice))
{
// Update the viewport to reflect the new time range, then update the chart.
int durationInDays;
int.TryParse(((ListItem)timeRange.SelectedItem).Key, out durationInDays);
WPFChartViewer1.ViewPortWidth = durationInDays / (double)dailyPrice.timeStamps.Length;
WPFChartViewer1.ViewPortLeft = 1 - WPFChartViewer1.ViewPortWidth;
WPFChartViewer1.updateViewPort(true, true);
}
}
/// <summary>
/// Draw the chart according to user selection and display it in the WPFChartViewer.
/// </summary>
/// <param name="viewer">The WPFChartViewer object to display the chart.</param>
private void drawChart(WPFChartViewer viewer)
{
// Use InvariantCulture to draw the chart. This ensures the chart will look the
// same on any computer.
System.Threading.Thread.CurrentThread.CurrentCulture =
System.Globalization.CultureInfo.InvariantCulture;
// The first moving average period selected by the user.
int avgPeriod1;
int.TryParse(movAvg1.Text, out avgPeriod1);
// The second moving average period selected by the user.
int avgPeriod2;
int.TryParse(movAvg2.Text, out avgPeriod2);
// We need extra leading data points in order to compute moving averages.
int extraPoints = Math.Max(20, Math.Max(avgPeriod1, avgPeriod2));
// After determining the extra points, we can obtain the data
int startIndex = (int)Math.Floor(viewer.getValueAtViewPort("x", viewer.ViewPortLeft));
int endIndex = (int)Math.Ceiling(viewer.getValueAtViewPort("x", viewer.ViewPortRight));
// Choose either daily, weekly or monthly prices depending on the date range
PriceData p = dailyPrice;
// If more than 400 trading days, use weekly or monthly prices
if (endIndex - startIndex >= 400)
{
if (endIndex - startIndex < 2000)
{
// Between 400 and 2000 trading days, use weekly prices
if (weeklyPrice == null)
{
// If no weekly prices, compute them from daily prices.
ArrayMath a = new ArrayMath(dailyPrice.timeStamps);
weeklyPrice = aggregateData(a.selectStartOfWeek(), dailyPrice);
}
p = weeklyPrice;
}
else
{
// More than 2000 trading days, use monthly prices
if (monthlyPrice == null)
{
// If no monthly prices, compute them from daily prices.
ArrayMath a = new ArrayMath(dailyPrice.timeStamps);
monthlyPrice = aggregateData(a.selectStartOfMonth(), dailyPrice);
}
p = monthlyPrice;
}
// Re-compute the index based on the weekly/monthly prices
startIndex = (int)Math.Floor(Chart.bSearch(p.timeStamps, dailyPrice.timeStamps[startIndex]));
endIndex = (int)Math.Ceiling(Chart.bSearch(p.timeStamps, dailyPrice.timeStamps[endIndex]));
}
//
// At this stage, all data is available. We can draw the chart as according to
// user input.
//
// Add extra points before the startIndex, as moving averages and may technical indicators
// requires data before the first visible point.
extraPoints = Math.Min(extraPoints, startIndex);
startIndex -= extraPoints;
int duration = endIndex - startIndex + 1;
DateTime[] vpTimeStamps = Chart.arraySlice(p.timeStamps, startIndex, duration);
double[] vpHighData = Chart.arraySlice(p.highData, startIndex, duration);
double[] vpLowData = Chart.arraySlice(p.lowData, startIndex, duration);
double[] vpOpenData = Chart.arraySlice(p.openData, startIndex, duration);
double[] vpCloseData = Chart.arraySlice(p.closeData, startIndex, duration);
double[] vpVolData = Chart.arraySlice(p.volData, startIndex, duration);
double[] vpCompareData = Chart.arraySlice(p.compareData, startIndex, duration);
//
// The chart size.
//
int width = 780;
int mainHeight = 255;
int indicatorHeight = 80;
// Create the chart object using the selected size
FinanceChart m = new FinanceChart(width);
// Hide default legend box as we are using dynamic legend
m.setLegendStyle("normal", 8, Chart.Transparent, Chart.Transparent);
// Set the data into the chart object
m.setData(vpTimeStamps, vpHighData, vpLowData, vpOpenData, vpCloseData, vpVolData, extraPoints);
// Put the ticker key at the bottom left of the FinanceChart title region
m.addPlotAreaTitle(Chart.BottomLeft, tickerSymbol.Text);
// A copyright message at the bottom left corner the title area
m.addPlotAreaTitle(Chart.BottomRight, "<*font=arial.ttf,size=8*>(c) Advanced Software Engineering");
// Add the main chart
m.addMainChart(mainHeight);
// Set log or linear scale according to user preference
m.setLogScale(logScale.IsChecked.GetValueOrDefault());
// Set axis labels to show data values or percentage change to user preference
if (percentageScale.IsChecked.GetValueOrDefault())
m.setPercentageAxis();
// Draw any price line the user has selected
string mainType = ((ListItem)chartType.SelectedItem).Key;
if (mainType == "Close")
m.addCloseLine(0x000040);
else if (mainType == "TP")
m.addTypicalPrice(0x000040);
else if (mainType == "WC")
m.addWeightedClose(0x000040);
else if (mainType == "Median")
m.addMedianPrice(0x000040);
// Add comparison line if there is data for comparison
if ((vpCompareData != null) && (vpCompareData.Length > extraPoints))
m.addComparison(vpCompareData, 0x0000ff, compareKey);
// Add moving average lines.
addMovingAvg(m, ((ListItem)avgType1.SelectedItem).Key, avgPeriod1, 0x663300);
addMovingAvg(m, ((ListItem)avgType2.SelectedItem).Key, avgPeriod2, 0x9900ff);
// Draw candlesticks or OHLC symbols if the user has selected them.
if (mainType == "CandleStick")
m.addCandleStick(0x33ff33, 0xff3333);
else if (mainType == "OHLC")
m.addHLOC(0x008800, 0xcc0000);
// Add parabolic SAR if necessary
if (parabolicSAR.IsChecked.GetValueOrDefault())
m.addParabolicSAR(0.02, 0.02, 0.2, Chart.DiamondShape, 5, 0x008800, 0x000000);
// Add price band/channel/envelop to the chart according to user selection
string selectedBand = ((ListItem)priceBand.SelectedItem).Key;
if (selectedBand == "BB")
m.addBollingerBand(20, 2, 0x9999ff, unchecked((int)(0xc06666ff)));
else if (selectedBand == "DC")
m.addDonchianChannel(20, 0x9999ff, unchecked((int)(0xc06666ff)));
else if (selectedBand == "Envelop")
m.addEnvelop(20, 0.1, 0x9999ff, unchecked((int)(0xc06666ff)));
// Add volume bars to the main chart if necessary
if (volumeBars.IsChecked.GetValueOrDefault())
m.addVolBars(indicatorHeight, 0x99ff99, 0xff9999, 0xc0c0c0);
// Add additional indicators as according to user selection.
addIndicator(m, ((ListItem)indicator1.SelectedItem).Key, indicatorHeight);
addIndicator(m, ((ListItem)indicator2.SelectedItem).Key, indicatorHeight);
// We may need to update the track line. If the mouse is moving on the chart, the track line
// will be updated in MouseMovePlotArea. Otherwise, we need to update the track line here.
if (!viewer.IsInMouseMoveEvent)
{
trackFinance(m, (null == viewer.Chart) ?
((XYChart)m.getChart(0)).getPlotArea().getRightX() : viewer.PlotAreaMouseX);
}
// output the chart
viewer.Chart = m;
}
//
// Add a moving average line to the FinanceChart object.
//
protected LineLayer addMovingAvg(FinanceChart m, string avgType, int avgPeriod, int color)
{
if (avgPeriod > 1)
{
if (avgType == "SMA")
return m.addSimpleMovingAvg(avgPeriod, color);
else if (avgType == "EMA")
return m.addExpMovingAvg(avgPeriod, color);
else if (avgType == "TMA")
return m.addTriMovingAvg(avgPeriod, color);
else if (avgType == "WMA")
return m.addWeightedMovingAvg(avgPeriod, color);
}
return null;
}
//
// Add an indicator chart to the FinanceChart object. In this demo example, the indicator
// parameters (such as the period used to compute RSI, colors of the lines, etc.) are hard
// coded to commonly used values. You are welcome to design a more complex user interface
// to allow users to set the parameters.
//
protected XYChart addIndicator(FinanceChart m, string indicator, int height)
{
if (indicator == "RSI")
return m.addRSI(height, 14, 0x800080, 20, 0xff6666, 0x6666ff);
else if (indicator == "StochRSI")
return m.addStochRSI(height, 14, 0x800080, 30, 0xff6666, 0x6666ff);
else if (indicator == "MACD")
return m.addMACD(height, 26, 12, 9, 0xff, 0xff00ff, 0x8000);
else if (indicator == "FStoch")
return m.addFastStochastic(height, 14, 3, 0x6060, 0x606000);
else if (indicator == "SStoch")
return m.addSlowStochastic(height, 14, 3, 0x6060, 0x606000);
else if (indicator == "ATR")
return m.addATR(height, 14, 0x808080, 0xff);
else if (indicator == "ADX")
return m.addADX(height, 14, 0x8000, 0x800000, 0x80);
else if (indicator == "DCW")
return m.addDonchianWidth(height, 20, 0xff);
else if (indicator == "BBW")
return m.addBollingerWidth(height, 20, 2, 0xff);
else if (indicator == "DPO")
return m.addDPO(height, 20, 0xff);
else if (indicator == "PVT")
return m.addPVT(height, 0xff);
else if (indicator == "Momentum")
return m.addMomentum(height, 12, 0xff);
else if (indicator == "Performance")
return m.addPerformance(height, 0xff);
else if (indicator == "ROC")
return m.addROC(height, 12, 0xff);
else if (indicator == "OBV")
return m.addOBV(height, 0xff);
else if (indicator == "AccDist")
return m.addAccDist(height, 0xff);
else if (indicator == "CLV")
return m.addCLV(height, 0xff);
else if (indicator == "WilliamR")
return m.addWilliamR(height, 14, 0x800080, 30, 0xff6666, 0x6666ff);
else if (indicator == "Aroon")
return m.addAroon(height, 14, 0x339933, 0x333399);
else if (indicator == "AroonOsc")
return m.addAroonOsc(height, 14, 0xff);
else if (indicator == "CCI")
return m.addCCI(height, 20, 0x800080, 100, 0xff6666, 0x6666ff);
else if (indicator == "EMV")
return m.addEaseOfMovement(height, 9, 0x6060, 0x606000);
else if (indicator == "MDX")
return m.addMassIndex(height, 0x800080, 0xff6666, 0x6666ff);
else if (indicator == "CVolatility")
return m.addChaikinVolatility(height, 10, 10, 0xff);
else if (indicator == "COscillator")
return m.addChaikinOscillator(height, 0xff);
else if (indicator == "CMF")
return m.addChaikinMoneyFlow(height, 21, 0x8000);
else if (indicator == "NVI")
return m.addNVI(height, 255, 0xff, 0x883333);
else if (indicator == "PVI")
return m.addPVI(height, 255, 0xff, 0x883333);
else if (indicator == "MFI")
return m.addMFI(height, 14, 0x800080, 30, 0xff6666, 0x6666ff);
else if (indicator == "PVO")
return m.addPVO(height, 26, 12, 9, 0xff, 0xff00ff, 0x8000);
else if (indicator == "PPO")
return m.addPPO(height, 26, 12, 9, 0xff, 0xff00ff, 0x8000);
else if (indicator == "UO")
return m.addUltimateOscillator(height, 7, 14, 28, 0x800080, 20, 0xff6666, 0x6666ff);
else if (indicator == "Vol")
return m.addVolIndicator(height, 0x99ff99, 0xff9999, 0xc0c0c0);
else if (indicator == "TRIX")
return m.addTRIX(height, 12, 0xff);
return null;
}
//
// Pointer (Drag to Scroll) button event handler
//
private void pointerPB_Checked(object sender, RoutedEventArgs e)
{
WPFChartViewer1.MouseUsage = WinChartMouseUsage.ScrollOnDrag;
}
//
// Zoom In button event handler
//
private void zoomInPB_Checked(object sender, RoutedEventArgs e)
{
WPFChartViewer1.MouseUsage = WinChartMouseUsage.ZoomIn;
}
//
// Zoom Out button event handler
//
private void zoomOutPB_Checked(object sender, RoutedEventArgs e)
{
WPFChartViewer1.MouseUsage = WinChartMouseUsage.ZoomOut;
}
//
// The viewport changed event handler. In this example, we update the other controls
// (the scroll bar) in addition to the chart.
//
private void WPFChartViewer1_ViewPortChanged(object sender, WPFViewPortEventArgs e)
{
updateControls(WPFChartViewer1);
// Update the chart if necessary
if (e.NeedUpdateChart)
drawChart(WPFChartViewer1);
}
//
// Update controls when the view port changed
//
private void updateControls(WPFChartViewer viewer)
{
// In this demo, we need to update the scroll bar to reflect the view port position and
// width of the view port.
hScrollBar1.IsEnabled = viewer.ViewPortWidth < 1;
hScrollBar1.LargeChange = viewer.ViewPortWidth * (hScrollBar1.Maximum - hScrollBar1.Minimum);
hScrollBar1.SmallChange = hScrollBar1.LargeChange * 0.1;
hScrollBar1.ViewportSize = viewer.ViewPortWidth / Math.Max(1E-10, 1 - viewer.ViewPortWidth)
* (hScrollBar1.Maximum - hScrollBar1.Minimum);
hScrollBar1.Value = viewer.ViewPortLeft / Math.Max(1E-10, 1 - viewer.ViewPortWidth)
* (hScrollBar1.Maximum - hScrollBar1.Minimum) + hScrollBar1.Minimum;
}
//
// The scroll bar event handler
//
private void hScrollBar1_ValueChanged(object sender, RoutedPropertyChangedEventArgs<double> e)
{
var viewer = WPFChartViewer1;
// When the view port is changed (user drags on the chart to scroll), the scroll bar will get
// updated. When the scroll bar changes (eg. user drags on the scroll bar), the view port will
// get updated. This creates an infinite loop. To avoid this, the scroll bar can update the
// view port only if the view port is not updating the scroll bar.
if (!viewer.IsInViewPortChangedEvent)
{
// Set the view port based on the scroll bar
viewer.ViewPortLeft = (hScrollBar1.Value - hScrollBar1.Minimum)
/ (hScrollBar1.Maximum - hScrollBar1.Minimum) * (1 - viewer.ViewPortWidth);
// Trigger a view port changed event to update the chart
viewer.updateViewPort(true, false);
}
}
//
// Draw track cursor when mouse is moving over plotarea
//
private void WPFChartViewer1_MouseMovePlotArea(object sender, MouseEventArgs e)
{
var viewer = sender as WPFChartViewer;
trackFinance((MultiChart)viewer.Chart, viewer.PlotAreaMouseX);
viewer.updateDisplay();
}
//
// Draw finance chart track line with legend
//
private void trackFinance(MultiChart m, int mouseX)
{
// Clear the current dynamic layer and get the DrawArea object to draw on it.
DrawArea d = m.initDynamicLayer();
// It is possible for a FinanceChart to be empty, so we need to check for it.
if (m.getChartCount() == 0)
return;
// Get the data x-value that is nearest to the mouse
int xValue = (int)(((XYChart)m.getChart(0)).getNearestXValue(mouseX));
// Iterate the XY charts (main price chart and indicator charts) in the FinanceChart
for (int i = 0; i < m.getChartCount(); ++i)
{
XYChart c = (XYChart)m.getChart(i);
// Variables to hold the legend entries
string ohlcLegend = "";
List<string> legendEntries = new List<string>();
// Iterate through all layers to find the highest data point
for (int j = 0; j < c.getLayerCount(); ++j)
{
Layer layer = c.getLayerByZ(j);
int xIndex = layer.getXIndexOf(xValue);
int dataSetCount = layer.getDataSetCount();
// In a FinanceChart, only layers showing OHLC data can have 4 data sets
if (dataSetCount == 4)
{
double highValue = layer.getDataSet(0).getValue(xIndex);
double lowValue = layer.getDataSet(1).getValue(xIndex);
double openValue = layer.getDataSet(2).getValue(xIndex);
double closeValue = layer.getDataSet(3).getValue(xIndex);
if (closeValue != Chart.NoValue)
{
// Build the OHLC legend
ohlcLegend = "Open: " + c.formatValue(openValue, "{value|P4}") + ", High: " +
c.formatValue(highValue, "{value|P4}") + ", Low: " + c.formatValue(lowValue,
"{value|P4}") + ", Close: " + c.formatValue(closeValue, "{value|P4}");
// We also draw an upward or downward triangle for up and down days and the %
// change
double lastCloseValue = layer.getDataSet(3).getValue(xIndex - 1);
if (lastCloseValue != Chart.NoValue)
{
double change = closeValue - lastCloseValue;
double percent = change * 100 / closeValue;
string symbol = ((change >= 0) ?
"<*font,color=008800*><*img=@triangle,width=8,color=008800*>" :
"<*font,color=CC0000*><*img=@invertedtriangle,width=8,color=CC0000*>");
ohlcLegend = ohlcLegend + " " + symbol + " " + c.formatValue(change,
"{value|P4}") + " (" + c.formatValue(percent, "{value|2}") + "%)<*/font*>"
;
}
// Use a <*block*> to make sure the line does not wrap within the legend entry
ohlcLegend = "<*block*>" + ohlcLegend + " <*/*>";
}
}
else
{
// Iterate through all the data sets in the layer
for (int k = 0; k < layer.getDataSetCount(); ++k)
{
ChartDirector.DataSet dataSet = layer.getDataSetByZ(k);
string name = dataSet.getDataName();
double value = dataSet.getValue(xIndex);
if ((!string.IsNullOrEmpty(name)) && (value != Chart.NoValue))
{
// In a FinanceChart, the data set name consists of the indicator name and its
// latest value. It is like "Vol: 123M" or "RSI (14): 55.34". As we are
// generating the values dynamically, we need to extract the indictor name
// out, and also the volume unit (if any).
// The unit character, if any, is the last character and must not be a digit.
string unitChar = name.Substring(name.Length - 1);
if (unitChar.CompareTo("0") >= 0 && unitChar.CompareTo("9") <= 0)
{
unitChar = "";
}
// The indicator name is the part of the name up to the colon character.
int delimiterPosition = name.IndexOf(":");
if (delimiterPosition != -1)
{
name = name.Substring(0, delimiterPosition);
}
// In a FinanceChart, if there are two data sets, it must be representing a
// range.
if (dataSetCount == 2)
{
// We show both values in the range in a single legend entry
value = layer.getDataSet(0).getValue(xIndex);
double value2 = layer.getDataSet(1).getValue(xIndex);
name = name + ": " + c.formatValue(Math.Min(value, value2), "{value|P3}")
+ " - " + c.formatValue(Math.Max(value, value2), "{value|P3}");
}
else
{
// In a FinanceChart, only the layer for volume bars has 3 data sets for
// up/down/flat days
if (dataSetCount == 3)
{
// The actual volume is the sum of the 3 data sets.
value = layer.getDataSet(0).getValue(xIndex) + layer.getDataSet(1
).getValue(xIndex) + layer.getDataSet(2).getValue(xIndex);
}
// Create the legend entry
name = name + ": " + c.formatValue(value, "{value|P3}") + unitChar;
}
// Build the legend entry, consist of a colored square box and the name (with
// the data value in it).
legendEntries.Add("<*block*><*img=@square,width=8,edgeColor=000000,color=" +
dataSet.getDataColor().ToString("x") + "*> " + name + "<*/*>");
}
}
}
}
// Get the plot area position relative to the entire FinanceChart
PlotArea plotArea = c.getPlotArea();
int plotAreaLeftX = plotArea.getLeftX() + c.getAbsOffsetX();
int plotAreaTopY = plotArea.getTopY() + c.getAbsOffsetY();
// The legend is formed by concatenating the legend entries.
legendEntries.Reverse();
string legendText = String.Join(" ", legendEntries);
// Add the date and the ohlcLegend (if any) at the beginning of the legend
legendText = "<*block,valign=top,maxWidth=" + (plotArea.getWidth() - 5) +
"*><*font=Arial Bold*>[" + c.xAxis().getFormattedLabel(xValue, "mmm dd, yyyy") +
"]<*/font*> " + ohlcLegend + legendText;
// Draw a vertical track line at the x-position
d.vline(plotAreaTopY, plotAreaTopY + plotArea.getHeight(), c.getXCoor(xValue) +
plotAreaLeftX - plotArea.getLeftX(), d.dashLineColor(0x000000, 0x0101));
// Display the legend on the top of the plot area
TTFText t = d.text(legendText, "Arial", 8);
t.draw(plotAreaLeftX + 5, plotAreaTopY + 3, 0x000000, Chart.TopLeft);
}
}
}
}
© 2023 Advanced Software Engineering Limited. All rights reserved.