[Windows Forms - C# version] NetWinCharts\CSharpWinCharts\fontpie.cs
using System;
using ChartDirector;
namespace CSharpChartExplorer
{
public class fontpie : DemoModule
{
//Name of demo module
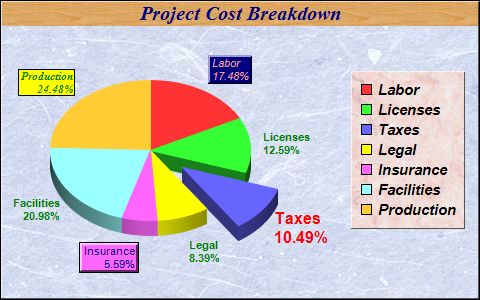
public string getName() { return "Text Style and Colors"; }
//Number of charts produced in this demo module
public int getNoOfCharts() { return 1; }
//Main code for creating chart.
//Note: the argument chartIndex is unused because this demo only has 1 chart.
public void createChart(WinChartViewer viewer, int chartIndex)
{
// The data for the pie chart
double[] data = {25, 18, 15, 12, 8, 30, 35};
// The labels for the pie chart
string[] labels = {"Labor", "Licenses", "Taxes", "Legal", "Insurance", "Facilities",
"Production"};
// Create a PieChart object of size 480 x 300 pixels
PieChart c = new PieChart(480, 300);
// Use a blue marble pattern as the background wallpaper, with a black border, and 1
// pixel 3D border effect
c.setBackground(c.patternColor("@/images/marble.png"), 0x000000, 1);
// Set the center of the pie at (150, 150) and the radius to 100 pixels
c.setPieSize(150, 150, 100);
// Add a title to the pie chart using Times Bold Italic/15 points/deep blue (0x000080)
// as font, with a wood pattern as the title background
c.addTitle("Project Cost Breakdown", "Times New Roman Bold Italic", 15, 0x000080
).setBackground(c.patternColor("@/images/wood.png"));
// Draw the pie in 3D
c.set3D();
// Add a legend box using Arial Bold Italic/11 points font. Use a pink marble pattern as
// the background wallpaper, with a 1 pixel 3D border. The legend box is top-right
// aligned relative to the point (465, 70)
LegendBox b = c.addLegend(465, 70, true, "Arial Bold Italic", 11);
b.setBackground(c.patternColor("@/images/marble2.png"), Chart.Transparent, 1);
b.setAlignment(Chart.TopRight);
// Set the default font for all sector labels to Arial Bold/8pt/dark green (0x008000).
c.setLabelStyle("Arial Bold", 8, 0x008000);
// Set the pie data and the pie labels
c.setData(data, labels);
// Explode the 3rd sector
c.setExplode(2, 40);
// Use Arial Bold/12pt/red as label font for the 3rd sector
c.sector(2).setLabelStyle("Arial Bold", 12, 0xff0000);
// Use Arial/8pt/deep blue as label font for the 5th sector. Add a background box using
// the sector fill color (SameAsMainColor), with a black (0x000000) edge and 2 pixel 3D
// border.
c.sector(4).setLabelStyle("Arial", 8, 0x000080).setBackground(Chart.SameAsMainColor,
0x000000, 2);
// Use Arial Italic/8pt/light red (0xff9999) as label font for the 6th sector. Add a
// dark blue (0x000080) background box with a 2 pixel 3D border.
c.sector(0).setLabelStyle("Arial Italic", 8, 0xff9999).setBackground(0x000080,
Chart.Transparent, 2);
// Use Times Bold Italic/8pt/deep green (0x008000) as label font for 7th sector. Add a
// yellow (0xFFFF00) background box with a black (0x000000) edge.
c.sector(6).setLabelStyle("Times New Roman Bold Italic", 8, 0x008000).setBackground(
0xffff00, 0x000000);
// Output the chart
viewer.Chart = c;
//include tool tip for the chart
viewer.ImageMap = c.getHTMLImageMap("clickable", "",
"title='{label}: US${value}K ({percent}%)'");
}
}
}
[Windows Forms - VB Version] NetWinCharts\VBNetWinCharts\fontpie.vb
Imports System
Imports Microsoft.VisualBasic
Imports ChartDirector

Public Class fontpie
    Implements DemoModule

    'Name of demo module
    Public Function getName() As String Implements DemoModule.getName
        Return "Text Style and Colors"
    End Function

    'Number of charts produced in this demo module
    Public Function getNoOfCharts() As Integer Implements DemoModule.getNoOfCharts
        Return 1
    End Function

    'Main code for creating chart.
    'Note: the argument chartIndex is unused because this demo only has 1 chart.
    Public Sub createChart(viewer As WinChartViewer, chartIndex As Integer) _
        Implements DemoModule.createChart

        ' The data for the pie chart
        Dim data() As Double = {25, 18, 15, 12, 8, 30, 35}

        ' The labels for the pie chart
        Dim labels() As String = {"Labor", "Licenses", "Taxes", "Legal", "Insurance", _
            "Facilities", "Production"}

        ' Create a PieChart object of size 480 x 300 pixels
        Dim c As PieChart = New PieChart(480, 300)

        ' Use a blue marble pattern as the background wallpaper, with a black border, and 1 pixel 3D
        ' border effect
        c.setBackground(c.patternColor("@/marble.png"), &H000000, 1)

        ' Set the center of the pie at (150, 150) and the radius to 100 pixels
        c.setPieSize(150, 150, 100)

        ' Add a title to the pie chart using Times Bold Italic/15 points/deep blue (0x000080) as
        ' font, with a wood pattern as the title background
        c.addTitle("Project Cost Breakdown", "Times New Roman Bold Italic", 15, &H000080 _
            ).setBackground(c.patternColor("@/wood.png"))

        ' Draw the pie in 3D
        c.set3D()

        ' Add a legend box using Arial Bold Italic/11 points font. Use a pink marble pattern as the
        ' background wallpaper, with a 1 pixel 3D border. The legend box is top-right aligned
        ' relative to the point (465, 70)
        Dim b As LegendBox = c.addLegend(465, 70, True, "Arial Bold Italic", 11)
        b.setBackground(c.patternColor("@/marble2.png"), Chart.Transparent, 1)
        b.setAlignment(Chart.TopRight)

        ' Set the default font for all sector labels to Arial Bold/8pt/dark green (0x008000).
        c.setLabelStyle("Arial Bold", 8, &H008000)

        ' Set the pie data and the pie labels
        c.setData(data, labels)

        ' Explode the 3rd sector
        c.setExplode(2, 40)

        ' Use Arial Bold/12pt/red as label font for the 3rd sector
        c.sector(2).setLabelStyle("Arial Bold", 12, &Hff0000)

        ' Use Arial/8pt/deep blue as label font for the 5th sector. Add a background box using the
        ' sector fill color (SameAsMainColor), with a black (0x000000) edge and 2 pixel 3D border.
        c.sector(4).setLabelStyle("Arial", 8, &H000080).setBackground(Chart.SameAsMainColor, _
            &H000000, 2)

        ' Use Arial Italic/8pt/light red (0xff9999) as label font for the 6th sector. Add a dark
        ' blue (0x000080) background box with a 2 pixel 3D border.
        c.sector(0).setLabelStyle("Arial Italic", 8, &Hff9999).setBackground(&H000080, _
            Chart.Transparent, 2)

        ' Use Times Bold Italic/8pt/deep green (0x008000) as label font for 7th sector. Add a yellow
        ' (0xFFFF00) background box with a black (0x000000) edge.
        c.sector(6).setLabelStyle("Times New Roman Bold Italic", 8, &H008000).setBackground( _
            &Hffff00, &H000000)

        ' Output the chart
        viewer.Chart = c

        'include tool tip for the chart
        viewer.ImageMap = c.getHTMLImageMap("clickable", "", _
            "title='{label}: US${value}K ({percent}%)'")

    End Sub

End Class
[WPF - C#] NetWPFCharts\CSharpWPFCharts\fontpie.cs
using System;
using ChartDirector;

namespace CSharpWPFCharts
{
    public class fontpie : DemoModule
    {
        //Name of demo module
        public string getName() { return "Text Style and Colors"; }

        //Number of charts produced in this demo module
        public int getNoOfCharts() { return 1; }

        //Main code for creating chart.
        //Note: the argument chartIndex is unused because this demo only has 1 chart.
        public void createChart(WPFChartViewer viewer, int chartIndex)
        {
            // The data for the pie chart
            double[] data = {25, 18, 15, 12, 8, 30, 35};

            // The labels for the pie chart
            string[] labels = {"Labor", "Licenses", "Taxes", "Legal", "Insurance", "Facilities",
                "Production"};

            // Create a PieChart object of size 480 x 300 pixels
            PieChart c = new PieChart(480, 300);

            // Use a blue marble pattern as the background wallpaper, with a black border, and 1
            // pixel 3D border effect
            c.setBackground(c.patternColor("@/images/marble.png"), 0x000000, 1);

            // Set the center of the pie at (150, 150) and the radius to 100 pixels
            c.setPieSize(150, 150, 100);

            // Add a title to the pie chart using Times Bold Italic/15 points/deep blue (0x000080)
            // as font, with a wood pattern as the title background
            c.addTitle("Project Cost Breakdown", "Times New Roman Bold Italic", 15, 0x000080
                ).setBackground(c.patternColor("@/images/wood.png"));

            // Draw the pie in 3D
            c.set3D();

            // Add a legend box using Arial Bold Italic/11 points font. Use a pink marble pattern as
            // the background wallpaper, with a 1 pixel 3D border. The legend box is top-right
            // aligned relative to the point (465, 70)
            LegendBox b = c.addLegend(465, 70, true, "Arial Bold Italic", 11);
            b.setBackground(c.patternColor("@/images/marble2.png"), Chart.Transparent, 1);
            b.setAlignment(Chart.TopRight);

            // Set the default font for all sector labels to Arial Bold/8pt/dark green (0x008000).
            c.setLabelStyle("Arial Bold", 8, 0x008000);

            // Set the pie data and the pie labels
            c.setData(data, labels);

            // Explode the 3rd sector
            c.setExplode(2, 40);

            // Use Arial Bold/12pt/red as label font for the 3rd sector
            c.sector(2).setLabelStyle("Arial Bold", 12, 0xff0000);

            // Use Arial/8pt/deep blue as label font for the 5th sector. Add a background box using
            // the sector fill color (SameAsMainColor), with a black (0x000000) edge and 2 pixel 3D
            // border.
            c.sector(4).setLabelStyle("Arial", 8, 0x000080).setBackground(Chart.SameAsMainColor,
                0x000000, 2);

            // Use Arial Italic/8pt/light red (0xff9999) as label font for the 6th sector. Add a
            // dark blue (0x000080) background box with a 2 pixel 3D border.
            c.sector(0).setLabelStyle("Arial Italic", 8, 0xff9999).setBackground(0x000080,
                Chart.Transparent, 2);

            // Use Times Bold Italic/8pt/deep green (0x008000) as label font for 7th sector. Add a
            // yellow (0xFFFF00) background box with a black (0x000000) edge.
            c.sector(6).setLabelStyle("Times New Roman Bold Italic", 8, 0x008000).setBackground(
                0xffff00, 0x000000);

            // Output the chart
            viewer.Chart = c;

            //include tool tip for the chart
            viewer.ImageMap = c.getHTMLImageMap("clickable", "",
                "title='{label}: US${value}K ({percent}%)'");
        }
    }
}
[ASP.NET Web Forms - C# version] NetWebCharts\CSharpASP\fontpie.aspx
(Click here on how to convert this code to code-behind style.)<%@ Page Language="C#" Debug="true" %>
<%@ Import Namespace="ChartDirector" %>
<%@ Register TagPrefix="chart" Namespace="ChartDirector" Assembly="netchartdir" %>
<!DOCTYPE html>
<script runat="server">
//
// Page Load event handler
//
protected void Page_Load(object sender, EventArgs e)
{
// The data for the pie chart
double[] data = {25, 18, 15, 12, 8, 30, 35};
// The labels for the pie chart
string[] labels = {"Labor", "Licenses", "Taxes", "Legal", "Insurance", "Facilities",
"Production"};
// Create a PieChart object of size 480 x 300 pixels
PieChart c = new PieChart(480, 300);
//Set default directory for loading images from current script directory
c.setSearchPath(Server.MapPath("."));
// Use a blue marble pattern as the background wallpaper, with a black border, and 1 pixel 3D
// border effect
c.setBackground(c.patternColor("marble.png"), 0x000000, 1);
// Set the center of the pie at (150, 150) and the radius to 100 pixels
c.setPieSize(150, 150, 100);
// Add a title to the pie chart using Times Bold Italic/15 points/deep blue (0x000080) as font,
// with a wood pattern as the title background
c.addTitle("Project Cost Breakdown", "Times New Roman Bold Italic", 15, 0x000080).setBackground(
c.patternColor("wood.png"));
// Draw the pie in 3D
c.set3D();
// Add a legend box using Arial Bold Italic/11 points font. Use a pink marble pattern as the
// background wallpaper, with a 1 pixel 3D border. The legend box is top-right aligned relative
// to the point (465, 70)
LegendBox b = c.addLegend(465, 70, true, "Arial Bold Italic", 11);
b.setBackground(c.patternColor("marble2.png"), Chart.Transparent, 1);
b.setAlignment(Chart.TopRight);
// Set the default font for all sector labels to Arial Bold/8pt/dark green (0x008000).
c.setLabelStyle("Arial Bold", 8, 0x008000);
// Set the pie data and the pie labels
c.setData(data, labels);
// Explode the 3rd sector
c.setExplode(2, 40);
// Use Arial Bold/12pt/red as label font for the 3rd sector
c.sector(2).setLabelStyle("Arial Bold", 12, 0xff0000);
// Use Arial/8pt/deep blue as label font for the 5th sector. Add a background box using the
// sector fill color (SameAsMainColor), with a black (0x000000) edge and 2 pixel 3D border.
c.sector(4).setLabelStyle("Arial", 8, 0x000080).setBackground(Chart.SameAsMainColor, 0x000000, 2
);
// Use Arial Italic/8pt/light red (0xff9999) as label font for the 6th sector. Add a dark blue
// (0x000080) background box with a 2 pixel 3D border.
c.sector(0).setLabelStyle("Arial Italic", 8, 0xff9999).setBackground(0x000080,
Chart.Transparent, 2);
// Use Times Bold Italic/8pt/deep green (0x008000) as label font for 7th sector. Add a yellow
// (0xFFFF00) background box with a black (0x000000) edge.
c.sector(6).setLabelStyle("Times New Roman Bold Italic", 8, 0x008000).setBackground(0xffff00,
0x000000);
// Output the chart
WebChartViewer1.Image = c.makeWebImage(Chart.SVG);
// Include tool tip for the chart
WebChartViewer1.ImageMap = c.getHTMLImageMap("", "", "title='{label}: US${value}K ({percent}%)'"
);
}
</script>
<html>
<head>
<script type="text/javascript" src="cdjcv.js"></script>
</head>
<body>
<chart:WebChartViewer id="WebChartViewer1" runat="server" />
</body>
</html>
[ASP.NET Web Forms - VB Version] NetWebCharts\VBNetASP\fontpie.aspx
(Click here on how to convert this code to code-behind style.)<%@ Page Language="VB" Debug="true" %>
<%@ Import Namespace="ChartDirector" %>
<%@ Register TagPrefix="chart" Namespace="ChartDirector" Assembly="netchartdir" %>
<!DOCTYPE html>
<script runat="server">
'
' Page Load event handler
'
Protected Sub Page_Load(ByVal sender As System.Object, ByVal e As System.EventArgs)
' The data for the pie chart
Dim data() As Double = {25, 18, 15, 12, 8, 30, 35}
' The labels for the pie chart
Dim labels() As String = {"Labor", "Licenses", "Taxes", "Legal", "Insurance", "Facilities", _
"Production"}
' Create a PieChart object of size 480 x 300 pixels
Dim c As PieChart = New PieChart(480, 300)
' Set default directory for loading images from current script directory
Call c.setSearchPath(Server.MapPath("."))
' Use a blue marble pattern as the background wallpaper, with a black border, and 1 pixel 3D
' border effect
c.setBackground(c.patternColor("marble.png"), &H000000, 1)
' Set the center of the pie at (150, 150) and the radius to 100 pixels
c.setPieSize(150, 150, 100)
' Add a title to the pie chart using Times Bold Italic/15 points/deep blue (0x000080) as font,
' with a wood pattern as the title background
c.addTitle("Project Cost Breakdown", "Times New Roman Bold Italic", 15, &H000080 _
).setBackground(c.patternColor("wood.png"))
' Draw the pie in 3D
c.set3D()
' Add a legend box using Arial Bold Italic/11 points font. Use a pink marble pattern as the
' background wallpaper, with a 1 pixel 3D border. The legend box is top-right aligned relative
' to the point (465, 70)
Dim b As LegendBox = c.addLegend(465, 70, True, "Arial Bold Italic", 11)
b.setBackground(c.patternColor("marble2.png"), Chart.Transparent, 1)
b.setAlignment(Chart.TopRight)
' Set the default font for all sector labels to Arial Bold/8pt/dark green (0x008000).
c.setLabelStyle("Arial Bold", 8, &H008000)
' Set the pie data and the pie labels
c.setData(data, labels)
' Explode the 3rd sector
c.setExplode(2, 40)
' Use Arial Bold/12pt/red as label font for the 3rd sector
c.sector(2).setLabelStyle("Arial Bold", 12, &Hff0000)
' Use Arial/8pt/deep blue as label font for the 5th sector. Add a background box using the
' sector fill color (SameAsMainColor), with a black (0x000000) edge and 2 pixel 3D border.
c.sector(4).setLabelStyle("Arial", 8, &H000080).setBackground(Chart.SameAsMainColor, &H000000,2)
' Use Arial Italic/8pt/light red (0xff9999) as label font for the 6th sector. Add a dark blue
' (0x000080) background box with a 2 pixel 3D border.
c.sector(0).setLabelStyle("Arial Italic", 8, &Hff9999).setBackground(&H000080, _
Chart.Transparent, 2)
' Use Times Bold Italic/8pt/deep green (0x008000) as label font for 7th sector. Add a yellow
' (0xFFFF00) background box with a black (0x000000) edge.
c.sector(6).setLabelStyle("Times New Roman Bold Italic", 8, &H008000).setBackground(&Hffff00, _
&H000000)
' Output the chart
WebChartViewer1.Image = c.makeWebImage(Chart.SVG)
' Include tool tip for the chart
WebChartViewer1.ImageMap = c.getHTMLImageMap("", "", _
"title='{label}: US${value}K ({percent}%)'")
End Sub
</script>
<html>
<head>
<script type="text/javascript" src="cdjcv.js"></script>
</head>
<body>
<chart:WebChartViewer id="WebChartViewer1" runat="server" />
</body>
</html>
[ASP.NET MVC - Controller] NetMvcCharts\Controllers\FontpieController.cs
using System;
using System.Web.Mvc;
using ChartDirector;

namespace NetMvcCharts.Controllers
{
    public class FontpieController : Controller
    {
        //
        // Default Action
        //
        public ActionResult Index()
        {
            ViewBag.Title = "Text Style and Colors";
            createChart(ViewBag.Viewer = new RazorChartViewer(HttpContext, "chart1"));
            return View("~/Views/Shared/ChartView.cshtml");
        }

        //
        // Create chart
        //
        private void createChart(RazorChartViewer viewer)
        {
            // The data for the pie chart
            double[] data = {25, 18, 15, 12, 8, 30, 35};

            // The labels for the pie chart
            string[] labels = {"Labor", "Licenses", "Taxes", "Legal", "Insurance", "Facilities",
                "Production"};

            // Create a PieChart object of size 480 x 300 pixels
            PieChart c = new PieChart(480, 300);

            //Set default directory for loading images
            c.setSearchPath(Url.Content("~/Content"));

            // Use a blue marble pattern as the background wallpaper, with a black border, and 1 pixel 3D
            // border effect
            c.setBackground(c.patternColor("marble.png"), 0x000000, 1);

            // Set the center of the pie at (150, 150) and the radius to 100 pixels
            c.setPieSize(150, 150, 100);

            // Add a title to the pie chart using Times Bold Italic/15 points/deep blue (0x000080) as
            // font, with a wood pattern as the title background
            c.addTitle("Project Cost Breakdown", "Times New Roman Bold Italic", 15, 0x000080
                ).setBackground(c.patternColor("wood.png"));

            // Draw the pie in 3D
            c.set3D();

            // Add a legend box using Arial Bold Italic/11 points font. Use a pink marble pattern as the
            // background wallpaper, with a 1 pixel 3D border. The legend box is top-right aligned
            // relative to the point (465, 70)
            LegendBox b = c.addLegend(465, 70, true, "Arial Bold Italic", 11);
            b.setBackground(c.patternColor("marble2.png"), Chart.Transparent, 1);
            b.setAlignment(Chart.TopRight);

            // Set the default font for all sector labels to Arial Bold/8pt/dark green (0x008000).
            c.setLabelStyle("Arial Bold", 8, 0x008000);

            // Set the pie data and the pie labels
            c.setData(data, labels);

            // Explode the 3rd sector
            c.setExplode(2, 40);

            // Use Arial Bold/12pt/red as label font for the 3rd sector
            c.sector(2).setLabelStyle("Arial Bold", 12, 0xff0000);

            // Use Arial/8pt/deep blue as label font for the 5th sector. Add a background box using the
            // sector fill color (SameAsMainColor), with a black (0x000000) edge and 2 pixel 3D border.
            c.sector(4).setLabelStyle("Arial", 8, 0x000080).setBackground(Chart.SameAsMainColor,
                0x000000, 2);

            // Use Arial Italic/8pt/light red (0xff9999) as label font for the 6th sector. Add a dark
            // blue (0x000080) background box with a 2 pixel 3D border.
            c.sector(0).setLabelStyle("Arial Italic", 8, 0xff9999).setBackground(0x000080,
                Chart.Transparent, 2);

            // Use Times Bold Italic/8pt/deep green (0x008000) as label font for 7th sector. Add a yellow
            // (0xFFFF00) background box with a black (0x000000) edge.
            c.sector(6).setLabelStyle("Times New Roman Bold Italic", 8, 0x008000).setBackground(0xffff00,
                0x000000);

            // Output the chart
            viewer.Image = c.makeWebImage(Chart.SVG);

            // Include tool tip for the chart
            viewer.ImageMap = c.getHTMLImageMap("", "",
                "title='{label}: US${value}K ({percent}%)'");
        }
    }
}
[ASP.NET MVC - View] NetMvcCharts\Views\Shared\ChartView.cshtml
@{ Layout = null; }

<!DOCTYPE html>

<html>
<head>
    <meta name="viewport" content="width=device-width" />
    <title>@ViewBag.Title</title>
    <style>
        @ViewBag.Style
    </style>
    @Scripts.Render("~/Scripts/cdjcv.js")
</head>
<body style="margin:5px 0px 0px 5px">
    <div style="font:bold 18pt verdana;">
        @ViewBag.Title
    </div>
    <hr style="border:solid 1px #000080; background:#000080" />
    <div>
        @{
            if (ViewBag.Viewer is Array)
            {
                // Display multiple charts
                for (int i = 0; i < ViewBag.Viewer.Length; ++i)
                {
                    @:@Html.Raw(ViewBag.Viewer[i].RenderHTML())
                }
            }
            else
            {
                // Display one chart only
                @:@Html.Raw(ViewBag.Viewer.RenderHTML())
            }
        }
    </div>
</body>
</html>
© 2023 Advanced Software Engineering Limited. All rights reserved.