[Windows Forms - C# version] NetWinCharts\CSharpWinCharts\icondonut.cs
using System;
using ChartDirector;
namespace CSharpChartExplorer
{
public class icondonut : DemoModule
{
//Name of demo module
public string getName() { return "Icon Donut Chart"; }
//Number of charts produced in this demo module
public int getNoOfCharts() { return 1; }
//Main code for creating chart.
//Note: the argument chartIndex is unused because this demo only has 1 chart.
public void createChart(WinChartViewer viewer, int chartIndex)
{
// The data for the pie chart
double[] data = {72, 18, 15, 12};
// The depths for the sectors
double[] depths = {30, 20, 10, 10};
// The labels for the pie chart
string[] labels = {"Sunny", "Cloudy", "Rainy", "Snowy"};
// The icons for the sectors
string[] icons = {"@/images/sun.png", "@/images/cloud.png", "@/images/rain.png",
"@/images/snowy.png"};
// Create a PieChart object of size 400 x 300 pixels
PieChart c = new PieChart(400, 300);
// Use the semi-transparent palette for this chart
c.setColors(Chart.transparentPalette);
// Set the background to metallic light blue (CCFFFF), with a black border and 1 pixel
// 3D border effect,
c.setBackground(Chart.metalColor(0xccccff), 0x000000, 1);
// Set donut center at (200, 175), and outer/inner radii as 100/50 pixels
c.setDonutSize(200, 175, 100, 50);
// Add a title box using 15pt Times Bold Italic font and metallic blue (8888FF)
// background color
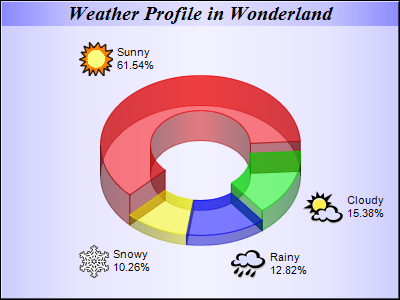
c.addTitle("Weather Profile in Wonderland", "Times New Roman Bold Italic", 15
).setBackground(Chart.metalColor(0x8888ff));
// Set the pie data and the pie labels
c.setData(data, labels);
// Add icons to the chart as a custom field
c.addExtraField(icons);
// Configure the sector labels using CDML to include the icon images
c.setLabelFormat(
"<*block,valign=absmiddle*><*img={field0}*> <*block*>{label}\n{percent}%<*/*><*/*>")
;
// Draw the pie in 3D with variable 3D depths
c.set3D2(depths);
// Set the start angle to 225 degrees may improve layout when the depths of the sector
// are sorted in descending order, because it ensures the tallest sector is at the back.
c.setStartAngle(225);
// Output the chart
viewer.Chart = c;
//include tool tip for the chart
viewer.ImageMap = c.getHTMLImageMap("clickable", "",
"title='{label}: {value} days ({percent}%)'");
}
}
}
[Windows Forms - VB Version] NetWinCharts\VBNetWinCharts\icondonut.vb
Imports System
Imports Microsoft.VisualBasic
Imports ChartDirector

Public Class icondonut
    Implements DemoModule

    'Name of demo module
    Public Function getName() As String Implements DemoModule.getName
        Return "Icon Donut Chart"
    End Function

    'Number of charts produced in this demo module
    Public Function getNoOfCharts() As Integer Implements DemoModule.getNoOfCharts
        Return 1
    End Function

    'Main code for creating chart.
    'Note: the argument chartIndex is unused because this demo only has 1 chart.
    Public Sub createChart(viewer As WinChartViewer, chartIndex As Integer) _
        Implements DemoModule.createChart

        ' The data for the pie chart
        Dim data() As Double = {72, 18, 15, 12}

        ' The depths for the sectors
        Dim depths() As Double = {30, 20, 10, 10}

        ' The labels for the pie chart
        Dim labels() As String = {"Sunny", "Cloudy", "Rainy", "Snowy"}

        ' The icons for the sectors
        Dim icons() As String = {"@/sun.png", "@/cloud.png", "@/rain.png", "@/snowy.png"}

        ' Create a PieChart object of size 400 x 300 pixels
        Dim c As PieChart = New PieChart(400, 300)

        ' Use the semi-transparent palette for this chart
        c.setColors(Chart.transparentPalette)

        ' Set the background to metallic light blue (CCFFFF), with a black border and 1 pixel 3D
        ' border effect,
        c.setBackground(Chart.metalColor(&Hccccff), &H000000, 1)

        ' Set donut center at (200, 175), and outer/inner radii as 100/50 pixels
        c.setDonutSize(200, 175, 100, 50)

        ' Add a title box using 15pt Times Bold Italic font and metallic blue (8888FF) background
        ' color
        c.addTitle("Weather Profile in Wonderland", "Times New Roman Bold Italic", 15 _
            ).setBackground(Chart.metalColor(&H8888ff))

        ' Set the pie data and the pie labels
        c.setData(data, labels)

        ' Add icons to the chart as a custom field
        c.addExtraField(icons)

        ' Configure the sector labels using CDML to include the icon images
        c.setLabelFormat( _
            "<*block,valign=absmiddle*><*img={field0}*> <*block*>{label}<*br*>{percent}%<*/*><*/*>")

        ' Draw the pie in 3D with variable 3D depths
        c.set3D2(depths)

        ' Set the start angle to 225 degrees may improve layout when the depths of the sector are
        ' sorted in descending order, because it ensures the tallest sector is at the back.
        c.setStartAngle(225)

        ' Output the chart
        viewer.Chart = c

        'include tool tip for the chart
        viewer.ImageMap = c.getHTMLImageMap("clickable", "", _
            "title='{label}: {value} days ({percent}%)'")

    End Sub

End Class
[WPF - C#] NetWPFCharts\CSharpWPFCharts\icondonut.cs
using System;
using ChartDirector;

namespace CSharpWPFCharts
{
    public class icondonut : DemoModule
    {
        //Name of demo module
        public string getName() { return "Icon Donut Chart"; }

        //Number of charts produced in this demo module
        public int getNoOfCharts() { return 1; }

        //Main code for creating chart.
        //Note: the argument chartIndex is unused because this demo only has 1 chart.
        public void createChart(WPFChartViewer viewer, int chartIndex)
        {
            // The data for the pie chart
            double[] data = {72, 18, 15, 12};

            // The depths for the sectors
            double[] depths = {30, 20, 10, 10};

            // The labels for the pie chart
            string[] labels = {"Sunny", "Cloudy", "Rainy", "Snowy"};

            // The icons for the sectors
            string[] icons = {"@/images/sun.png", "@/images/cloud.png", "@/images/rain.png",
                "@/images/snowy.png"};

            // Create a PieChart object of size 400 x 300 pixels
            PieChart c = new PieChart(400, 300);

            // Use the semi-transparent palette for this chart
            c.setColors(Chart.transparentPalette);

            // Set the background to metallic light blue (CCFFFF), with a black border and 1 pixel
            // 3D border effect,
            c.setBackground(Chart.metalColor(0xccccff), 0x000000, 1);

            // Set donut center at (200, 175), and outer/inner radii as 100/50 pixels
            c.setDonutSize(200, 175, 100, 50);

            // Add a title box using 15pt Times Bold Italic font and metallic blue (8888FF)
            // background color
            c.addTitle("Weather Profile in Wonderland", "Times New Roman Bold Italic", 15
                ).setBackground(Chart.metalColor(0x8888ff));

            // Set the pie data and the pie labels
            c.setData(data, labels);

            // Add icons to the chart as a custom field
            c.addExtraField(icons);

            // Configure the sector labels using CDML to include the icon images
            c.setLabelFormat(
                "<*block,valign=absmiddle*><*img={field0}*> <*block*>{label}\n{percent}%<*/*><*/*>")
                ;

            // Draw the pie in 3D with variable 3D depths
            c.set3D2(depths);

            // Set the start angle to 225 degrees may improve layout when the depths of the sector
            // are sorted in descending order, because it ensures the tallest sector is at the back.
            c.setStartAngle(225);

            // Output the chart
            viewer.Chart = c;

            //include tool tip for the chart
            viewer.ImageMap = c.getHTMLImageMap("clickable", "",
                "title='{label}: {value} days ({percent}%)'");
        }
    }
}
[ASP.NET Web Forms - C# version] NetWebCharts\CSharpASP\icondonut.aspx
(Click here on how to convert this code to code-behind style.)<%@ Page Language="C#" Debug="true" %>
<%@ Import Namespace="ChartDirector" %>
<%@ Register TagPrefix="chart" Namespace="ChartDirector" Assembly="netchartdir" %>
<!DOCTYPE html>
<script runat="server">
//
// Page Load event handler
//
protected void Page_Load(object sender, EventArgs e)
{
// The data for the pie chart
double[] data = {72, 18, 15, 12};
// The depths for the sectors
double[] depths = {30, 20, 10, 10};
// The labels for the pie chart
string[] labels = {"Sunny", "Cloudy", "Rainy", "Snowy"};
// The icons for the sectors
string[] icons = {"sun.png", "cloud.png", "rain.png", "snowy.png"};
// Create a PieChart object of size 400 x 300 pixels
PieChart c = new PieChart(400, 300);
// Use the semi-transparent palette for this chart
c.setColors(Chart.transparentPalette);
// Set the background to metallic light blue (CCFFFF), with a black border and 1 pixel 3D border
// effect,
c.setBackground(Chart.metalColor(0xccccff), 0x000000, 1);
//Set default directory for loading images from current script directory
c.setSearchPath(Server.MapPath("."));
// Set donut center at (200, 175), and outer/inner radii as 100/50 pixels
c.setDonutSize(200, 175, 100, 50);
// Add a title box using 15pt Times Bold Italic font and metallic blue (8888FF) background color
c.addTitle("Weather Profile in Wonderland", "Times New Roman Bold Italic", 15).setBackground(
Chart.metalColor(0x8888ff));
// Set the pie data and the pie labels
c.setData(data, labels);
// Add icons to the chart as a custom field
c.addExtraField(icons);
// Configure the sector labels using CDML to include the icon images
c.setLabelFormat(
"<*block,valign=absmiddle*><*img={field0}*> <*block*>{label}\n{percent}%<*/*><*/*>");
// Draw the pie in 3D with variable 3D depths
c.set3D2(depths);
// Set the start angle to 225 degrees may improve layout when the depths of the sector are
// sorted in descending order, because it ensures the tallest sector is at the back.
c.setStartAngle(225);
// Output the chart
WebChartViewer1.Image = c.makeWebImage(Chart.SVG);
// Include tool tip for the chart
WebChartViewer1.ImageMap = c.getHTMLImageMap("", "",
"title='{label}: {value} days ({percent}%)'");
}
</script>
<html>
<head>
<script type="text/javascript" src="cdjcv.js"></script>
</head>
<body>
<chart:WebChartViewer id="WebChartViewer1" runat="server" />
</body>
</html>
[ASP.NET Web Forms - VB Version] NetWebCharts\VBNetASP\icondonut.aspx
(Click here on how to convert this code to code-behind style.)<%@ Page Language="VB" Debug="true" %>
<%@ Import Namespace="ChartDirector" %>
<%@ Register TagPrefix="chart" Namespace="ChartDirector" Assembly="netchartdir" %>
<!DOCTYPE html>
<script runat="server">
'
' Page Load event handler
'
Protected Sub Page_Load(ByVal sender As System.Object, ByVal e As System.EventArgs)
' The data for the pie chart
Dim data() As Double = {72, 18, 15, 12}
' The depths for the sectors
Dim depths() As Double = {30, 20, 10, 10}
' The labels for the pie chart
Dim labels() As String = {"Sunny", "Cloudy", "Rainy", "Snowy"}
' The icons for the sectors
Dim icons() As String = {"sun.png", "cloud.png", "rain.png", "snowy.png"}
' Create a PieChart object of size 400 x 300 pixels
Dim c As PieChart = New PieChart(400, 300)
' Use the semi-transparent palette for this chart
c.setColors(Chart.transparentPalette)
' Set the background to metallic light blue (CCFFFF), with a black border and 1 pixel 3D border
' effect,
c.setBackground(Chart.metalColor(&Hccccff), &H000000, 1)
' Set default directory for loading images from current script directory
Call c.setSearchPath(Server.MapPath("."))
' Set donut center at (200, 175), and outer/inner radii as 100/50 pixels
c.setDonutSize(200, 175, 100, 50)
' Add a title box using 15pt Times Bold Italic font and metallic blue (8888FF) background color
c.addTitle("Weather Profile in Wonderland", "Times New Roman Bold Italic", 15).setBackground( _
Chart.metalColor(&H8888ff))
' Set the pie data and the pie labels
c.setData(data, labels)
' Add icons to the chart as a custom field
c.addExtraField(icons)
' Configure the sector labels using CDML to include the icon images
c.setLabelFormat( _
"<*block,valign=absmiddle*><*img={field0}*> <*block*>{label}<*br*>{percent}%<*/*><*/*>")
' Draw the pie in 3D with variable 3D depths
c.set3D2(depths)
' Set the start angle to 225 degrees may improve layout when the depths of the sector are sorted
' in descending order, because it ensures the tallest sector is at the back.
c.setStartAngle(225)
' Output the chart
WebChartViewer1.Image = c.makeWebImage(Chart.SVG)
' Include tool tip for the chart
WebChartViewer1.ImageMap = c.getHTMLImageMap("", "", _
"title='{label}: {value} days ({percent}%)'")
End Sub
</script>
<html>
<head>
<script type="text/javascript" src="cdjcv.js"></script>
</head>
<body>
<chart:WebChartViewer id="WebChartViewer1" runat="server" />
</body>
</html>
[ASP.NET MVC - Controller] NetMvcCharts\Controllers\IcondonutController.cs
using System;
using System.Web.Mvc;
using ChartDirector;

namespace NetMvcCharts.Controllers
{
    public class IcondonutController : Controller
    {
        //
        // Default Action
        //
        public ActionResult Index()
        {
            ViewBag.Title = "Icon Donut Chart";
            createChart(ViewBag.Viewer = new RazorChartViewer(HttpContext, "chart1"));
            return View("~/Views/Shared/ChartView.cshtml");
        }

        //
        // Create chart
        //
        private void createChart(RazorChartViewer viewer)
        {
            // The data for the pie chart
            double[] data = {72, 18, 15, 12};

            // The depths for the sectors
            double[] depths = {30, 20, 10, 10};

            // The labels for the pie chart
            string[] labels = {"Sunny", "Cloudy", "Rainy", "Snowy"};

            // The icons for the sectors
            string[] icons = {"sun.png", "cloud.png", "rain.png", "snowy.png"};

            // Create a PieChart object of size 400 x 300 pixels
            PieChart c = new PieChart(400, 300);

            // Use the semi-transparent palette for this chart
            c.setColors(Chart.transparentPalette);

            // Set the background to metallic light blue (CCFFFF), with a black border and 1 pixel 3D
            // border effect,
            c.setBackground(Chart.metalColor(0xccccff), 0x000000, 1);

            //Set default directory for loading images
            c.setSearchPath(Url.Content("~/Content"));

            // Set donut center at (200, 175), and outer/inner radii as 100/50 pixels
            c.setDonutSize(200, 175, 100, 50);

            // Add a title box using 15pt Times Bold Italic font and metallic blue (8888FF) background
            // color
            c.addTitle("Weather Profile in Wonderland", "Times New Roman Bold Italic", 15).setBackground(
                Chart.metalColor(0x8888ff));

            // Set the pie data and the pie labels
            c.setData(data, labels);

            // Add icons to the chart as a custom field
            c.addExtraField(icons);

            // Configure the sector labels using CDML to include the icon images
            c.setLabelFormat(
                "<*block,valign=absmiddle*><*img={field0}*> <*block*>{label}\n{percent}%<*/*><*/*>");

            // Draw the pie in 3D with variable 3D depths
            c.set3D2(depths);

            // Set the start angle to 225 degrees may improve layout when the depths of the sector are
            // sorted in descending order, because it ensures the tallest sector is at the back.
            c.setStartAngle(225);

            // Output the chart
            viewer.Image = c.makeWebImage(Chart.SVG);

            // Include tool tip for the chart
            viewer.ImageMap = c.getHTMLImageMap("", "",
                "title='{label}: {value} days ({percent}%)'");
        }
    }
}
[ASP.NET MVC - View] NetMvcCharts\Views\Shared\ChartView.cshtml
@{ Layout = null; }

<!DOCTYPE html>

<html>
<head>
    <meta name="viewport" content="width=device-width" />
    <title>@ViewBag.Title</title>
    <style>
        @ViewBag.Style
    </style>
    @Scripts.Render("~/Scripts/cdjcv.js")
</head>
<body style="margin:5px 0px 0px 5px">
    <div style="font:bold 18pt verdana;">
        @ViewBag.Title
    </div>
    <hr style="border:solid 1px #000080; background:#000080" />
    <div>
        @{
            if (ViewBag.Viewer is Array)
            {
                // Display multiple charts
                for (int i = 0; i < ViewBag.Viewer.Length; ++i)
                {
                    @:@Html.Raw(ViewBag.Viewer[i].RenderHTML())
                }
            }
            else
            {
                // Display one chart only
                @:@Html.Raw(ViewBag.Viewer.RenderHTML())
            }
        }
    </div>
</body>
</html>
© 2023 Advanced Software Engineering Limited. All rights reserved.