This example demonstrates using ChartDirector image maps to invoke client side Javascript functions.
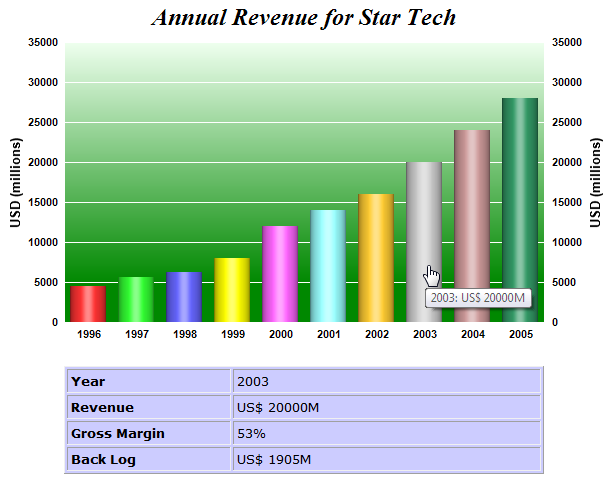
In this example, a clickable area chart will be produced. Apart from responding to mouse clicks, detail information about the data points will be displayed in a dynamic HTML block when the mouse pointer moves over the chart. This is accomplished using "onmouseover" and "onmouseout" event handlers with client side Javascript.
The code for this example is listed below.
[ASP.NET Web Forms - C# version] NetWebCharts\CSharpASP\jsclick.aspx
(Click here on how to convert this code to code-behind style.)
<%@ Page Language="C#" Debug="true" %>
<%@ Import Namespace="ChartDirector" %>
<%@ Register TagPrefix="chart" Namespace="ChartDirector" Assembly="netchartdir" %>

<script runat="server">

//
// Page Load event handler
//
protected void Page_Load(object sender, EventArgs e)
{
    //
    // For demo purpose, we use hard coded data. In real life, the following data could come from a
    // database.
    //
    double[] revenue = {4500, 5600, 6300, 8000, 12000, 14000, 16000, 20000, 24000, 28000};
    double[] grossMargin = {62, 65, 63, 60, 55, 56, 57, 53, 52, 50};
    double[] backLog = {563, 683, 788, 941, 1334, 1522, 1644, 1905, 2222, 2544};
    string[] labels = {"1996", "1997", "1998", "1999", "2000", "2001", "2002", "2003", "2004",
        "2005"};

    // Create a XYChart object of size 600 x 360 pixels
    XYChart c = new XYChart(600, 360);

    // Add a title to the chart using 18pt Times Bold Italic font
    c.addTitle("Annual Revenue for Star Tech", "Times New Roman Bold Italic", 18);

    // Set the plotarea at (60, 40) and of size 480 x 280 pixels. Use a vertical gradient color from
    // light green (eeffee) to dark green (008800) as background. Set border and grid lines to white
    // (ffffff).
    c.setPlotArea(60, 40, 480, 280, c.linearGradientColor(60, 40, 60, 280, 0xeeffee, 0x008800), -1,
        0xffffff, 0xffffff);

    // Add a multi-color bar chart layer using the revenue data.
    BarLayer layer = c.addBarLayer3(revenue);

    // Set cylinder bar shape
    layer.setBarShape(Chart.CircleShape);

    // Add extra field to the bars. These fields are used for showing additional information.
    layer.addExtraField2(grossMargin);
    layer.addExtraField2(backLog);

    // Set the labels on the x axis.
    c.xAxis().setLabels(labels);

    // In this example, we show the same scale using both axes
    c.syncYAxis();

    // Set the axis line to transparent
    c.xAxis().setColors(Chart.Transparent);
    c.yAxis().setColors(Chart.Transparent);
    c.yAxis2().setColors(Chart.Transparent);

    // Set the axis label to using 8pt Arial Bold as font
    c.yAxis().setLabelStyle("Arial Bold", 8);
    c.yAxis2().setLabelStyle("Arial Bold", 8);
    c.xAxis().setLabelStyle("Arial Bold", 8);

    // Add title to the y axes
    c.yAxis().setTitle("USD (millions)", "Arial Bold", 10);
    c.yAxis2().setTitle("USD (millions)", "Arial Bold", 10);

    // Output the chart
    WebChartViewer1.Image = c.makeWebImage(Chart.SVG);

    // Client side Javascript to show detail information "onmouseover"
    string showText = "onmouseover='showInfo(\"{xLabel}\", {value}, {field0}, {field1});' ";

    // Client side Javascript to hide detail information "onmouseout"
    string hideText = "onmouseout='showInfo(null);' ";

    // "title" attribute to show tool tip
    string toolTip = "title='{xLabel}: US$ {value|0}M'";

    // Create an image map for the chart
    string imageMap = c.getHTMLImageMap("xystub.aspx", "", showText + hideText + toolTip);

    // Assign the image map to the chart
    WebChartViewer1.ImageMap = imageMap;
}

</script>

<!DOCTYPE html>
<html>
<head>
    <title>Javascript Clickable Chart</title>
    <!-- Include ChartDirector Javascript Library to support chart interactions -->
    <script type="text/javascript" src="cdjcv.js"></script>
</head>
<body style="margin:5px 0px 0px 5px">
<script type="text/javascript">
//
//Client side script function to show and hide detail information.
//
function showInfo(year, revenue, grossMargin, backLog)
{
    var obj = document.getElementById('detailInfo');

    if (!year)
    {
        obj.style.visibility = "hidden";
        return;
    }

    var content = "<table border='1' cellpadding='3' style='font:10pt verdana; " +
        "background-color:#CCCCFF' width='480px'>";
    content += "<tr><td><b>Year</b></td><td width='300px'>" + year + "</td></tr>";
    content += "<tr><td><b>Revenue</b></td><td>US$ " + revenue + "M</td></tr>";
    content += "<tr><td><b>Gross Margin</b></td><td>" + grossMargin + "%</td></tr>";
    content += "<tr><td><b>Back Log</b></td><td>US$ " + backLog + "M</td></tr>";
    content += "</table>";

    obj.innerHTML = content;
    obj.style.visibility = "visible";
}
</script>
<div style="font:bold 18pt verdana;">
    Javascript Clickable Chart
</div>
<hr style="border:solid 1px #000080" />
<div style="font:10pt verdana; margin-bottom:20px">
    <a href='viewsource.aspx?file=<%=Request["SCRIPT_NAME"]%>'>View Source Code</a>
</div>

<!-- ****** Here is the chart image ****** -->
<chart:WebChartViewer id="WebChartViewer1" runat="server" />

<div id="detailInfo" style="margin-left:60px"></div>
</body>
</html>
[ASP.NET Web Forms - VB Version] NetWebCharts\VBNetASP\jsclick.aspx
(Click here on how to convert this code to code-behind style.)
<%@ Page Language="VB" Debug="true" %>
<%@ Import Namespace="ChartDirector" %>
<%@ Register TagPrefix="chart" Namespace="ChartDirector" Assembly="netchartdir" %>

<script runat="server">

'
' Page Load event handler
'
Protected Sub Page_Load(ByVal sender As System.Object, ByVal e As System.EventArgs)

    '
    ' For demo purpose, we use hard coded data. In real life, the following data could come from a
    ' database.
    '
    Dim revenue() As Double = {4500, 5600, 6300, 8000, 12000, 14000, 16000, 20000, 24000, 28000}
    Dim grossMargin() As Double = {62, 65, 63, 60, 55, 56, 57, 53, 52, 50}
    Dim backLog() As Double = {563, 683, 788, 941, 1334, 1522, 1644, 1905, 2222, 2544}
    Dim labels() As String = {"1996", "1997", "1998", "1999", "2000", "2001", "2002", "2003", _
        "2004", "2005"}

    ' Create a XYChart object of size 600 x 360 pixels
    Dim c As XYChart = New XYChart(600, 360)

    ' Add a title to the chart using 18pt Times Bold Italic font
    c.addTitle("Annual Revenue for Star Tech", "Times New Roman Bold Italic", 18)

    ' Set the plotarea at (60, 40) and of size 480 x 280 pixels. Use a vertical gradient color from
    ' light green (eeffee) to dark green (008800) as background. Set border and grid lines to white
    ' (ffffff).
    c.setPlotArea(60, 40, 480, 280, c.linearGradientColor(60, 40, 60, 280, &Heeffee, &H008800), _
        -1, &Hffffff, &Hffffff)

    ' Add a multi-color bar chart layer using the revenue data.
    Dim layer As BarLayer = c.addBarLayer3(revenue)

    ' Set cylinder bar shape
    layer.setBarShape(Chart.CircleShape)

    ' Add extra field to the bars. These fields are used for showing additional information.
    layer.addExtraField2(grossMargin)
    layer.addExtraField2(backLog)

    ' Set the labels on the x axis.
    c.xAxis().setLabels(labels)

    ' In this example, we show the same scale using both axes
    c.syncYAxis()

    ' Set the axis line to transparent
    c.xAxis().setColors(Chart.Transparent)
    c.yAxis().setColors(Chart.Transparent)
    c.yAxis2().setColors(Chart.Transparent)

    ' Set the axis label to using 8pt Arial Bold as font
    c.yAxis().setLabelStyle("Arial Bold", 8)
    c.yAxis2().setLabelStyle("Arial Bold", 8)
    c.xAxis().setLabelStyle("Arial Bold", 8)

    ' Add title to the y axes
    c.yAxis().setTitle("USD (millions)", "Arial Bold", 10)
    c.yAxis2().setTitle("USD (millions)", "Arial Bold", 10)

    ' Output the chart
    WebChartViewer1.Image = c.makeWebImage(Chart.SVG)

    ' Client side Javascript to show detail information "onmouseover"
    Dim showText As String = "onmouseover='showInfo(""{xLabel}"", {value}, {field0}, {field1});' "

    ' Client side Javascript to hide detail information "onmouseout"
    Dim hideText As String = "onmouseout='showInfo(null);' "

    ' "title" attribute to show tool tip
    Dim toolTip As String = "title='{xLabel}: US$ {value|0}M'"

    ' Create an image map for the chart
    Dim imageMap As String = c.getHTMLImageMap("xystub.aspx", "", showText & hideText & toolTip)

    ' Assign the image map to the chart
    WebChartViewer1.ImageMap = imageMap

End Sub

</script>

<!DOCTYPE html>
<html>
<head>
    <title>Javascript Clickable Chart</title>
    <!-- Include ChartDirector Javascript Library to support chart interactions -->
    <script type="text/javascript" src="cdjcv.js"></script>
</head>
<body style="margin:5px 0px 0px 5px">
<script type="text/javascript">
//
//Client side script function to show and hide detail information.
//
function showInfo(year, revenue, grossMargin, backLog)
{
    var obj = document.getElementById('detailInfo');

    if (!year)
    {
        obj.style.visibility = "hidden";
        return;
    }

    var content = "<table border='1' cellpadding='3' style='font:10pt verdana; " +
        "background-color:#CCCCFF' width='480px'>";
    content += "<tr><td><b>Year</b></td><td width='300px'>" + year + "</td></tr>";
    content += "<tr><td><b>Revenue</b></td><td>US$ " + revenue + "M</td></tr>";
    content += "<tr><td><b>Gross Margin</b></td><td>" + grossMargin + "%</td></tr>";
    content += "<tr><td><b>Back Log</b></td><td>US$ " + backLog + "M</td></tr>";
    content += "</table>";

    obj.innerHTML = content;
    obj.style.visibility = "visible";
}
</script>
<div style="font:bold 18pt verdana;">
    Javascript Clickable Chart
</div>
<hr style="border:solid 1px #000080" />
<div style="font:10pt verdana; margin-bottom:20px">
    <a href='viewsource.aspx?file=<%=Request("SCRIPT_NAME")%>'>View Source Code</a>
</div>

<!-- ****** Here is the chart image ****** -->
<chart:WebChartViewer id="WebChartViewer1" runat="server" />

<div id="detailInfo" style="margin-left:60px"></div>
</body>
</html>
[ASP.NET MVC - Controller] NetMvcCharts\Controllers\JsclickController.cs
using System;
using System.Web.Mvc;
using ChartDirector;

namespace NetMvcCharts.Controllers
{
    public class JsclickController : Controller
    {
        //
        // Default Action
        //
        public ActionResult Index()
        {
            createChart(ViewBag.Viewer = new RazorChartViewer(HttpContext, "chart1"));
            return View();
        }

        //
        // Create chart
        //
        private void createChart(RazorChartViewer viewer)
        {
            //
            // For demo purpose, we use hard coded data. In real life, the following data could come from
            // a database.
            //
            double[] revenue = {4500, 5600, 6300, 8000, 12000, 14000, 16000, 20000, 24000, 28000};
            double[] grossMargin = {62, 65, 63, 60, 55, 56, 57, 53, 52, 50};
            double[] backLog = {563, 683, 788, 941, 1334, 1522, 1644, 1905, 2222, 2544};
            string[] labels = {"1996", "1997", "1998", "1999", "2000", "2001", "2002", "2003", "2004",
                "2005"};

            // Create a XYChart object of size 600 x 360 pixels
            XYChart c = new XYChart(600, 360);

            // Add a title to the chart using 18pt Times Bold Italic font
            c.addTitle("Annual Revenue for Star Tech", "Times New Roman Bold Italic", 18);

            // Set the plotarea at (60, 40) and of size 480 x 280 pixels. Use a vertical gradient color
            // from light green (eeffee) to dark green (008800) as background. Set border and grid lines
            // to white (ffffff).
            c.setPlotArea(60, 40, 480, 280, c.linearGradientColor(60, 40, 60, 280, 0xeeffee, 0x008800),
                -1, 0xffffff, 0xffffff);

            // Add a multi-color bar chart layer using the revenue data.
            BarLayer layer = c.addBarLayer3(revenue);

            // Set cylinder bar shape
            layer.setBarShape(Chart.CircleShape);

            // Add extra field to the bars. These fields are used for showing additional information.
            layer.addExtraField2(grossMargin);
            layer.addExtraField2(backLog);

            // Set the labels on the x axis.
            c.xAxis().setLabels(labels);

            // In this example, we show the same scale using both axes
            c.syncYAxis();

            // Set the axis line to transparent
            c.xAxis().setColors(Chart.Transparent);
            c.yAxis().setColors(Chart.Transparent);
            c.yAxis2().setColors(Chart.Transparent);

            // Set the axis label to using 8pt Arial Bold as font
            c.yAxis().setLabelStyle("Arial Bold", 8);
            c.yAxis2().setLabelStyle("Arial Bold", 8);
            c.xAxis().setLabelStyle("Arial Bold", 8);

            // Add title to the y axes
            c.yAxis().setTitle("USD (millions)", "Arial Bold", 10);
            c.yAxis2().setTitle("USD (millions)", "Arial Bold", 10);

            // Output the chart
            viewer.Image = c.makeWebImage(Chart.SVG);

            // Client side Javascript to show detail information "onmouseover"
            string showText = "onmouseover='showInfo(\"{xLabel}\", {value}, {field0}, {field1});' ";

            // Client side Javascript to hide detail information "onmouseout"
            string hideText = "onmouseout='showInfo(null);' ";

            // "title" attribute to show tool tip
            string toolTip = "title='{xLabel}: US$ {value|0}M'";

            // Create an image map for the chart
            string imageMap = c.getHTMLImageMap(Url.Action("", "Xystub"), "", showText + hideText +
                toolTip);

            // Assign the image map to the chart
            viewer.ImageMap = imageMap;
        }
    }
}
[ASP.NET MVC - View] NetMvcCharts\Views\Jsclick\Index.cshtml
@{ Layout = null; }

<!DOCTYPE html>
<html>
<head>
    <title>Javascript Clickable Chart</title>
    <!-- Include ChartDirector Javascript Library to support chart interactions -->
    @Scripts.Render("~/Scripts/cdjcv.js")
</head>
<body style="margin:5px 0px 0px 5px">
<script type="text/javascript">
//
//Client side script function to show and hide detail information.
//
function showInfo(year, revenue, grossMargin, backLog)
{
    var obj = document.getElementById('detailInfo');

    if (!year)
    {
        obj.style.visibility = "hidden";
        return;
    }

    var content = "<table border='1' cellpadding='3' style='font:10pt verdana; " +
        "background-color:#CCCCFF' width='480px'>";
    content += "<tr><td><b>Year</b></td><td width='300px'>" + year + "</td></tr>";
    content += "<tr><td><b>Revenue</b></td><td>US$ " + revenue + "M</td></tr>";
    content += "<tr><td><b>Gross Margin</b></td><td>" + grossMargin + "%</td></tr>";
    content += "<tr><td><b>Back Log</b></td><td>US$ " + backLog + "M</td></tr>";
    content += "</table>";

    obj.innerHTML = content;
    obj.style.visibility = "visible";
}
</script>
<div style="font:bold 18pt verdana;">
    Javascript Clickable Chart
</div>
<hr style="border:solid 1px #000080" />

<!-- ****** Here is the chart image ****** -->
@Html.Raw(ViewBag.Viewer.RenderHTML())

<div id="detailInfo" style="margin-left:60px"></div>
</body>
</html>
The above code is quite similar to most of the sample codes in this documentation, so it will not be discussed in detail. The main difference is the code for creating the image map.
[ASP.NET Web Forms]
[ASP.NET MVC (Razor)]
//Client side Javascript to show detail information "onmouseover"
string showText =
 "onmouseover='showInfo(\"{xLabel}\", {value}, {field0}, {field1});' ";

//Client side Javascript to hide detail information "onmouseout"
string hideText = "onmouseout='showInfo(null);' ";

//"title" attribute to show tool tip
string toolTip = "title='{xLabel}: USD {value|0}M'";

//Output image map for the chart
WebChartViewer1.ImageMap = c.getHTMLImageMap("xystub.aspx", "", showText +
 hideText + toolTip);
[ASP.NET MVC (Razor)]
//Client side Javascript to show detail information "onmouseover"
string showText =
 "onmouseover='showInfo(\"{xLabel}\", {value}, {field0}, {field1});' ";

//Client side Javascript to hide detail information "onmouseout"
string hideText = "onmouseout='showInfo(null);' ";

//"title" attribute to show tool tip
string toolTip = "title='{xLabel}: USD {value|0}M'";

//Output image map for the chart
viewer.ImageMap = c.getHTMLImageMap(Url.Action("", "xystub"), "", showText + hideText +
 toolTip);
Note that in the third argument of getHTMLImageMap, in addition to the "title" attribute for tooltips, it also includes "onmouseover" and "onmouseout" event handlers. They call the Javascript function "showInfo", which creates and hides the dynamic HTML block for displaying additional information.
<script type="text/javascript">
//
//Client side script function to show and hide detail information.
//
function showInfo(year, revenue, grossMargin, backLog)
{
    var obj = document.getElementById('detailInfo');

    if (!year)
    {
        obj.style.visibility = "hidden";
        return;
    }

    var content = "<table border='1' cellpadding='3' style='font:10pt verdana; " +
        "background-color:#CCCCFF' width='480px'>";
    content += "<tr><td><b>Year</b></td><td width='300px'>" + year + "</td></tr>";
    content += "<tr><td><b>Revenue</b></td><td>US$ " + revenue + "M</td></tr>";
    content += "<tr><td><b>Gross Margin</b></td><td>" + grossMargin + "%</td></tr>";
    content += "<tr><td><b>Back Log</b></td><td>US$ " + backLog + "M</td></tr>";
    content += "</table>";

    obj.innerHTML = content;
    obj.style.visibility = "visible";
}
</script>
In this example, we are displaying extra information, such as the "grossMargin" and "backLog" fields, which do not come from the x or y value of the bars. This is achieved by associated these fields as "extra fields" to the data items with Layer.addExtraField2. These extra fields can then be represented using the template "{fieldN}", where "N" represents the field number. (The first field is 0, the second field is 1, etc.)
In addition to responding to mouse over and mouse out events, the chart is also clickable using "xystub.aspx" (ASP.NET Web Forms) or the "xystub" controller (ASP.NET MVC) as the handler. For demo purpose, the handler simple displays information on what is clicked. It's code is as follows.
[ASP.NET Web Forms - C# version] NetWebCharts\CSharpASP\xystub.aspx
(Click here on how to convert this code to code-behind style.)
<%@ Language="C#" Debug="true" %>
<!DOCTYPE html>
<html>
<head>
    <title>Simple Clickable XY Chart Handler</title>
</head>
<body style="margin:5px 0px 0px 5px">
<div style="font:bold 18pt verdana;">
    Simple Clickable XY Chart Handler
</div>
<hr style="border:solid 1px #000080" />
<div style="font:10pt verdana; margin-bottom:20px">
    <a href="viewsource.aspx?file=<%=Request["SCRIPT_NAME"]%>">View Source Code</a>
</div>
<div style="font:10pt verdana;">
<b>You have clicked on the following chart element :</b><br />
<ul>
    <li>Data Set : <%=Request["dataSetName"]%></li>
    <li>X Position : <%=Request["x"]%></li>
    <li>X Label : <%=Request["xLabel"]%></li>
    <li>Data Value : <%=Request["value"]%></li>
</ul>
</div>
</body>
</html>
[ASP.NET Web Forms - VB Version] NetWebCharts\VBNetASP\xystub.aspx
(Click here on how to convert this code to code-behind style.)
<%@ Language="VB" Debug="true" %>
<!DOCTYPE html>
<html>
<head>
    <title>Simple Clickable XY Chart Handler</title>
</head>
<body style="margin:5px 0px 0px 5px">
<div style="font:bold 18pt verdana;">
    Simple Clickable XY Chart Handler
</div>
<hr style="border:solid 1px #000080" />
<div style="font:10pt verdana; margin-bottom:20px">
    <a href="viewsource.aspx?file=<%=Request("SCRIPT_NAME")%>">View Source Code</a>
</div>
<div style="font:10pt verdana;">
<b>You have clicked on the following chart element :</b><br />
<ul>
    <li>Data Set : <%=Request("dataSetName")%></li>
    <li>X Position : <%=Request("x")%></li>
    <li>X Label : <%=Request("xLabel")%></li>
    <li>Data Value : <%=Request("value")%></li>
</ul>
</div>
</body>
</html>
[ASP.NET MVC - Controller] NetMvcCharts\Controllers\XystubController.cs
using System.Web.Mvc;

namespace NetMvcCharts.Controllers
{
    public class XystubController : Controller
    {
        public ActionResult Index()
        {
            return View();
        }
    }
}
[ASP.NET MVC - View] NetMvcCharts\Views\Xystub\Index.cshtml
@{ Layout = null; }

<!DOCTYPE html>
<html>
<head>
    <title>Simple Clickable XY Chart Handler</title>
</head>
<body style="margin:5px 0px 0px 5px">
<div style="font:bold 18pt verdana;">
    Simple Clickable XY Chart Handler
</div>
<hr style="border:solid 1px #000080" />
<div style="font:10pt verdana;">
<b>You have clicked on the following chart element :</b><br />
<ul>
    <li>Data Set : @Request["dataSetName"]</li>
    <li>X Position : @Request["x"]</li>
    <li>X Label : @Request["xLabel"]</li>
    <li>Data Value : @Request["value"]</li>
</ul>
</div>
</body>
</html>