[Windows Forms - C# version] NetWinCharts\CSharpWinCharts\legendpie2.cs
using System;
using ChartDirector;
namespace CSharpChartExplorer
{
public class legendpie2 : DemoModule
{
//Name of demo module
public string getName() { return "Pie Chart with Legend (2)"; }
//Number of charts produced in this demo module
public int getNoOfCharts() { return 1; }
//Main code for creating chart.
//Note: the argument chartIndex is unused because this demo only has 1 chart.
public void createChart(WinChartViewer viewer, int chartIndex)
{
// The data for the pie chart
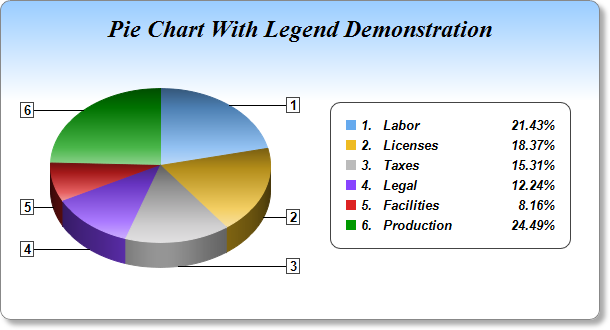
double[] data = {21, 18, 15, 12, 8, 24};
// The labels for the pie chart
string[] labels = {"Labor", "Licenses", "Taxes", "Legal", "Facilities", "Production"};
// The colors to use for the sectors
int[] colors = {0x66aaee, 0xeebb22, 0xbbbbbb, 0x8844ff, 0xdd2222, 0x009900};
// Create a PieChart object of size 600 x 320 pixels. Use a vertical gradient color from
// light blue (99ccff) to white (ffffff) spanning the top 100 pixels as background. Set
// border to grey (888888). Use rounded corners. Enable soft drop shadow.
PieChart c = new PieChart(600, 320);
c.setBackground(c.linearGradientColor(0, 0, 0, 100, 0x99ccff, 0xffffff), 0x888888);
c.setRoundedFrame();
c.setDropShadow();
// Add a title using 18pt Times New Roman Bold Italic font. Add 16 pixels top margin to
// the title.
c.addTitle("Pie Chart With Legend Demonstration", "Times New Roman Bold Italic", 18
).setMargin2(0, 0, 16, 0);
// Set the center of the pie at (160, 165) and the radius to 110 pixels
c.setPieSize(160, 165, 110);
// Draw the pie in 3D with a pie thickness of 25 pixels
c.set3D(25);
// Set the pie data and the pie labels
c.setData(data, labels);
// Set the sector colors
c.setColors2(Chart.DataColor, colors);
// Use local gradient shading for the sectors
c.setSectorStyle(Chart.LocalGradientShading);
// Use the side label layout method, with the labels positioned 16 pixels from the pie
// bounding box
c.setLabelLayout(Chart.SideLayout, 16);
// Show only the sector number as the sector label
c.setLabelFormat("{={sector}+1}");
// Set the sector label style to Arial Bold 10pt, with a dark grey (444444) border
c.setLabelStyle("Arial Bold", 10).setBackground(Chart.Transparent, 0x444444);
// Add a legend box, with the center of the left side anchored at (330, 175), and using
// 10pt Arial Bold Italic font
LegendBox b = c.addLegend(330, 175, true, "Arial Bold Italic", 10);
b.setAlignment(Chart.Left);
// Set the legend box border to dark grey (444444), and with rounded conerns
b.setBackground(Chart.Transparent, 0x444444);
b.setRoundedCorners();
// Set the legend box margin to 16 pixels, and the extra line spacing between the legend
// entries as 5 pixels
b.setMargin(16);
b.setKeySpacing(0, 5);
// Set the legend box icon to have no border (border color same as fill color)
b.setKeyBorder(Chart.SameAsMainColor);
// Set the legend text to show the sector number, followed by a 120 pixels wide block
// showing the sector label, and a 40 pixels wide block showing the percentage
b.setText(
"<*block,valign=top*>{={sector}+1}.<*advanceTo=22*><*block,width=120*>{label}" +
"<*/*><*block,width=40,halign=right*>{percent}<*/*>%");
// Output the chart
viewer.Chart = c;
//include tool tip for the chart
viewer.ImageMap = c.getHTMLImageMap("clickable", "",
"title='{label}: US${value}K ({percent}%)'");
}
}
}
[Windows Forms - VB Version] NetWinCharts\VBNetWinCharts\legendpie2.vb
Imports System
Imports Microsoft.VisualBasic
Imports ChartDirector

Public Class legendpie2
    Implements DemoModule

    'Name of demo module
    Public Function getName() As String Implements DemoModule.getName
        Return "Pie Chart with Legend (2)"
    End Function

    'Number of charts produced in this demo module
    Public Function getNoOfCharts() As Integer Implements DemoModule.getNoOfCharts
        Return 1
    End Function

    'Main code for creating chart.
    'Note: the argument chartIndex is unused because this demo only has 1 chart.
    Public Sub createChart(viewer As WinChartViewer, chartIndex As Integer) _
        Implements DemoModule.createChart

        ' The data for the pie chart
        Dim data() As Double = {21, 18, 15, 12, 8, 24}

        ' The labels for the pie chart
        Dim labels() As String = {"Labor", "Licenses", "Taxes", "Legal", "Facilities", _
            "Production"}

        ' The colors to use for the sectors
        Dim colors() As Integer = {&H66aaee, &Heebb22, &Hbbbbbb, &H8844ff, &Hdd2222, &H009900}

        ' Create a PieChart object of size 600 x 320 pixels. Use a vertical gradient color from
        ' light blue (99ccff) to white (ffffff) spanning the top 100 pixels as background. Set
        ' border to grey (888888). Use rounded corners. Enable soft drop shadow.
        Dim c As PieChart = New PieChart(600, 320)
        c.setBackground(c.linearGradientColor(0, 0, 0, 100, &H99ccff, &Hffffff), &H888888)
        c.setRoundedFrame()
        c.setDropShadow()

        ' Add a title using 18pt Times New Roman Bold Italic font. Add 16 pixels top margin to the
        ' title.
        c.addTitle("Pie Chart With Legend Demonstration", "Times New Roman Bold Italic", 18 _
            ).setMargin2(0, 0, 16, 0)

        ' Set the center of the pie at (160, 165) and the radius to 110 pixels
        c.setPieSize(160, 165, 110)

        ' Draw the pie in 3D with a pie thickness of 25 pixels
        c.set3D(25)

        ' Set the pie data and the pie labels
        c.setData(data, labels)

        ' Set the sector colors
        c.setColors2(Chart.DataColor, colors)

        ' Use local gradient shading for the sectors
        c.setSectorStyle(Chart.LocalGradientShading)

        ' Use the side label layout method, with the labels positioned 16 pixels from the pie
        ' bounding box
        c.setLabelLayout(Chart.SideLayout, 16)

        ' Show only the sector number as the sector label
        c.setLabelFormat("{={sector}+1}")

        ' Set the sector label style to Arial Bold 10pt, with a dark grey (444444) border
        c.setLabelStyle("Arial Bold", 10).setBackground(Chart.Transparent, &H444444)

        ' Add a legend box, with the center of the left side anchored at (330, 175), and using 10pt
        ' Arial Bold Italic font
        Dim b As LegendBox = c.addLegend(330, 175, True, "Arial Bold Italic", 10)
        b.setAlignment(Chart.Left)

        ' Set the legend box border to dark grey (444444), and with rounded conerns
        b.setBackground(Chart.Transparent, &H444444)
        b.setRoundedCorners()

        ' Set the legend box margin to 16 pixels, and the extra line spacing between the legend
        ' entries as 5 pixels
        b.setMargin(16)
        b.setKeySpacing(0, 5)

        ' Set the legend box icon to have no border (border color same as fill color)
        b.setKeyBorder(Chart.SameAsMainColor)

        ' Set the legend text to show the sector number, followed by a 120 pixels wide block showing
        ' the sector label, and a 40 pixels wide block showing the percentage
        b.setText( _
            "<*block,valign=top*>{={sector}+1}.<*advanceTo=22*><*block,width=120*>{label}<*/*>" & _
            "<*block,width=40,halign=right*>{percent}<*/*>%")

        ' Output the chart
        viewer.Chart = c

        'include tool tip for the chart
        viewer.ImageMap = c.getHTMLImageMap("clickable", "", _
            "title='{label}: US${value}K ({percent}%)'")

    End Sub

End Class
[WPF - C#] NetWPFCharts\CSharpWPFCharts\legendpie2.cs
using System;
using ChartDirector;

namespace CSharpWPFCharts
{
    public class legendpie2 : DemoModule
    {
        //Name of demo module
        public string getName() { return "Pie Chart with Legend (2)"; }

        //Number of charts produced in this demo module
        public int getNoOfCharts() { return 1; }

        //Main code for creating chart.
        //Note: the argument chartIndex is unused because this demo only has 1 chart.
        public void createChart(WPFChartViewer viewer, int chartIndex)
        {
            // The data for the pie chart
            double[] data = {21, 18, 15, 12, 8, 24};

            // The labels for the pie chart
            string[] labels = {"Labor", "Licenses", "Taxes", "Legal", "Facilities", "Production"};

            // The colors to use for the sectors
            int[] colors = {0x66aaee, 0xeebb22, 0xbbbbbb, 0x8844ff, 0xdd2222, 0x009900};

            // Create a PieChart object of size 600 x 320 pixels. Use a vertical gradient color from
            // light blue (99ccff) to white (ffffff) spanning the top 100 pixels as background. Set
            // border to grey (888888). Use rounded corners. Enable soft drop shadow.
            PieChart c = new PieChart(600, 320);
            c.setBackground(c.linearGradientColor(0, 0, 0, 100, 0x99ccff, 0xffffff), 0x888888);
            c.setRoundedFrame();
            c.setDropShadow();

            // Add a title using 18pt Times New Roman Bold Italic font. Add 16 pixels top margin to
            // the title.
            c.addTitle("Pie Chart With Legend Demonstration", "Times New Roman Bold Italic", 18
                ).setMargin2(0, 0, 16, 0);

            // Set the center of the pie at (160, 165) and the radius to 110 pixels
            c.setPieSize(160, 165, 110);

            // Draw the pie in 3D with a pie thickness of 25 pixels
            c.set3D(25);

            // Set the pie data and the pie labels
            c.setData(data, labels);

            // Set the sector colors
            c.setColors2(Chart.DataColor, colors);

            // Use local gradient shading for the sectors
            c.setSectorStyle(Chart.LocalGradientShading);

            // Use the side label layout method, with the labels positioned 16 pixels from the pie
            // bounding box
            c.setLabelLayout(Chart.SideLayout, 16);

            // Show only the sector number as the sector label
            c.setLabelFormat("{={sector}+1}");

            // Set the sector label style to Arial Bold 10pt, with a dark grey (444444) border
            c.setLabelStyle("Arial Bold", 10).setBackground(Chart.Transparent, 0x444444);

            // Add a legend box, with the center of the left side anchored at (330, 175), and using
            // 10pt Arial Bold Italic font
            LegendBox b = c.addLegend(330, 175, true, "Arial Bold Italic", 10);
            b.setAlignment(Chart.Left);

            // Set the legend box border to dark grey (444444), and with rounded conerns
            b.setBackground(Chart.Transparent, 0x444444);
            b.setRoundedCorners();

            // Set the legend box margin to 16 pixels, and the extra line spacing between the legend
            // entries as 5 pixels
            b.setMargin(16);
            b.setKeySpacing(0, 5);

            // Set the legend box icon to have no border (border color same as fill color)
            b.setKeyBorder(Chart.SameAsMainColor);

            // Set the legend text to show the sector number, followed by a 120 pixels wide block
            // showing the sector label, and a 40 pixels wide block showing the percentage
            b.setText(
                "<*block,valign=top*>{={sector}+1}.<*advanceTo=22*><*block,width=120*>{label}" +
                "<*/*><*block,width=40,halign=right*>{percent}<*/*>%");

            // Output the chart
            viewer.Chart = c;

            //include tool tip for the chart
            viewer.ImageMap = c.getHTMLImageMap("clickable", "",
                "title='{label}: US${value}K ({percent}%)'");
        }
    }
}
[ASP.NET Web Forms - C# version] NetWebCharts\CSharpASP\legendpie2.aspx
(Click here on how to convert this code to code-behind style.)<%@ Page Language="C#" Debug="true" %>
<%@ Import Namespace="ChartDirector" %>
<%@ Register TagPrefix="chart" Namespace="ChartDirector" Assembly="netchartdir" %>
<!DOCTYPE html>
<script runat="server">
//
// Page Load event handler
//
protected void Page_Load(object sender, EventArgs e)
{
// The data for the pie chart
double[] data = {21, 18, 15, 12, 8, 24};
// The labels for the pie chart
string[] labels = {"Labor", "Licenses", "Taxes", "Legal", "Facilities", "Production"};
// The colors to use for the sectors
int[] colors = {0x66aaee, 0xeebb22, 0xbbbbbb, 0x8844ff, 0xdd2222, 0x009900};
// Create a PieChart object of size 600 x 320 pixels. Use a vertical gradient color from light
// blue (99ccff) to white (ffffff) spanning the top 100 pixels as background. Set border to grey
// (888888). Use rounded corners. Enable soft drop shadow.
PieChart c = new PieChart(600, 320);
c.setBackground(c.linearGradientColor(0, 0, 0, 100, 0x99ccff, 0xffffff), 0x888888);
c.setRoundedFrame();
c.setDropShadow();
// Add a title using 18pt Times New Roman Bold Italic font. Add 16 pixels top margin to the
// title.
c.addTitle("Pie Chart With Legend Demonstration", "Times New Roman Bold Italic", 18).setMargin2(
0, 0, 16, 0);
// Set the center of the pie at (160, 165) and the radius to 110 pixels
c.setPieSize(160, 165, 110);
// Draw the pie in 3D with a pie thickness of 25 pixels
c.set3D(25);
// Set the pie data and the pie labels
c.setData(data, labels);
// Set the sector colors
c.setColors2(Chart.DataColor, colors);
// Use local gradient shading for the sectors
c.setSectorStyle(Chart.LocalGradientShading);
// Use the side label layout method, with the labels positioned 16 pixels from the pie bounding
// box
c.setLabelLayout(Chart.SideLayout, 16);
// Show only the sector number as the sector label
c.setLabelFormat("{={sector}+1}");
// Set the sector label style to Arial Bold 10pt, with a dark grey (444444) border
c.setLabelStyle("Arial Bold", 10).setBackground(Chart.Transparent, 0x444444);
// Add a legend box, with the center of the left side anchored at (330, 175), and using 10pt
// Arial Bold Italic font
LegendBox b = c.addLegend(330, 175, true, "Arial Bold Italic", 10);
b.setAlignment(Chart.Left);
// Set the legend box border to dark grey (444444), and with rounded conerns
b.setBackground(Chart.Transparent, 0x444444);
b.setRoundedCorners();
// Set the legend box margin to 16 pixels, and the extra line spacing between the legend entries
// as 5 pixels
b.setMargin(16);
b.setKeySpacing(0, 5);
// Set the legend box icon to have no border (border color same as fill color)
b.setKeyBorder(Chart.SameAsMainColor);
// Set the legend text to show the sector number, followed by a 120 pixels wide block showing
// the sector label, and a 40 pixels wide block showing the percentage
b.setText(
"<*block,valign=top*>{={sector}+1}.<*advanceTo=22*><*block,width=120*>{label}<*/*>" +
"<*block,width=40,halign=right*>{percent}<*/*>%");
// Output the chart
WebChartViewer1.Image = c.makeWebImage(Chart.SVG);
// Include tool tip for the chart
WebChartViewer1.ImageMap = c.getHTMLImageMap("", "", "title='{label}: US${value}K ({percent}%)'"
);
}
</script>
<html>
<head>
<script type="text/javascript" src="cdjcv.js"></script>
</head>
<body>
<chart:WebChartViewer id="WebChartViewer1" runat="server" />
</body>
</html>
[ASP.NET Web Forms - VB Version] NetWebCharts\VBNetASP\legendpie2.aspx
(Click here on how to convert this code to code-behind style.)<%@ Page Language="VB" Debug="true" %>
<%@ Import Namespace="ChartDirector" %>
<%@ Register TagPrefix="chart" Namespace="ChartDirector" Assembly="netchartdir" %>
<!DOCTYPE html>
<script runat="server">
'
' Page Load event handler
'
Protected Sub Page_Load(ByVal sender As System.Object, ByVal e As System.EventArgs)
' The data for the pie chart
Dim data() As Double = {21, 18, 15, 12, 8, 24}
' The labels for the pie chart
Dim labels() As String = {"Labor", "Licenses", "Taxes", "Legal", "Facilities", "Production"}
' The colors to use for the sectors
Dim colors() As Integer = {&H66aaee, &Heebb22, &Hbbbbbb, &H8844ff, &Hdd2222, &H009900}
' Create a PieChart object of size 600 x 320 pixels. Use a vertical gradient color from light
' blue (99ccff) to white (ffffff) spanning the top 100 pixels as background. Set border to grey
' (888888). Use rounded corners. Enable soft drop shadow.
Dim c As PieChart = New PieChart(600, 320)
c.setBackground(c.linearGradientColor(0, 0, 0, 100, &H99ccff, &Hffffff), &H888888)
c.setRoundedFrame()
c.setDropShadow()
' Add a title using 18pt Times New Roman Bold Italic font. Add 16 pixels top margin to the
' title.
c.addTitle("Pie Chart With Legend Demonstration", "Times New Roman Bold Italic", 18 _
).setMargin2(0, 0, 16, 0)
' Set the center of the pie at (160, 165) and the radius to 110 pixels
c.setPieSize(160, 165, 110)
' Draw the pie in 3D with a pie thickness of 25 pixels
c.set3D(25)
' Set the pie data and the pie labels
c.setData(data, labels)
' Set the sector colors
c.setColors2(Chart.DataColor, colors)
' Use local gradient shading for the sectors
c.setSectorStyle(Chart.LocalGradientShading)
' Use the side label layout method, with the labels positioned 16 pixels from the pie bounding
' box
c.setLabelLayout(Chart.SideLayout, 16)
' Show only the sector number as the sector label
c.setLabelFormat("{={sector}+1}")
' Set the sector label style to Arial Bold 10pt, with a dark grey (444444) border
c.setLabelStyle("Arial Bold", 10).setBackground(Chart.Transparent, &H444444)
' Add a legend box, with the center of the left side anchored at (330, 175), and using 10pt
' Arial Bold Italic font
Dim b As LegendBox = c.addLegend(330, 175, True, "Arial Bold Italic", 10)
b.setAlignment(Chart.Left)
' Set the legend box border to dark grey (444444), and with rounded conerns
b.setBackground(Chart.Transparent, &H444444)
b.setRoundedCorners()
' Set the legend box margin to 16 pixels, and the extra line spacing between the legend entries
' as 5 pixels
b.setMargin(16)
b.setKeySpacing(0, 5)
' Set the legend box icon to have no border (border color same as fill color)
b.setKeyBorder(Chart.SameAsMainColor)
' Set the legend text to show the sector number, followed by a 120 pixels wide block showing the
' sector label, and a 40 pixels wide block showing the percentage
b.setText( _
"<*block,valign=top*>{={sector}+1}.<*advanceTo=22*><*block,width=120*>{label}<*/*>" & _
"<*block,width=40,halign=right*>{percent}<*/*>%")
' Output the chart
WebChartViewer1.Image = c.makeWebImage(Chart.SVG)
' Include tool tip for the chart
WebChartViewer1.ImageMap = c.getHTMLImageMap("", "", _
"title='{label}: US${value}K ({percent}%)'")
End Sub
</script>
<html>
<head>
<script type="text/javascript" src="cdjcv.js"></script>
</head>
<body>
<chart:WebChartViewer id="WebChartViewer1" runat="server" />
</body>
</html>
[ASP.NET MVC - Controller] NetMvcCharts\Controllers\Legendpie2Controller.cs
using System;
using System.Web.Mvc;
using ChartDirector;

namespace NetMvcCharts.Controllers
{
    public class Legendpie2Controller : Controller
    {
        //
        // Default Action
        //
        public ActionResult Index()
        {
            ViewBag.Title = "Pie Chart with Legend (2)";
            createChart(ViewBag.Viewer = new RazorChartViewer(HttpContext, "chart1"));
            return View("~/Views/Shared/ChartView.cshtml");
        }

        //
        // Create chart
        //
        private void createChart(RazorChartViewer viewer)
        {
            // The data for the pie chart
            double[] data = {21, 18, 15, 12, 8, 24};

            // The labels for the pie chart
            string[] labels = {"Labor", "Licenses", "Taxes", "Legal", "Facilities", "Production"};

            // The colors to use for the sectors
            int[] colors = {0x66aaee, 0xeebb22, 0xbbbbbb, 0x8844ff, 0xdd2222, 0x009900};

            // Create a PieChart object of size 600 x 320 pixels. Use a vertical gradient color from
            // light blue (99ccff) to white (ffffff) spanning the top 100 pixels as background. Set
            // border to grey (888888). Use rounded corners. Enable soft drop shadow.
            PieChart c = new PieChart(600, 320);
            c.setBackground(c.linearGradientColor(0, 0, 0, 100, 0x99ccff, 0xffffff), 0x888888);
            c.setRoundedFrame();
            c.setDropShadow();

            // Add a title using 18pt Times New Roman Bold Italic font. Add 16 pixels top margin to the
            // title.
            c.addTitle("Pie Chart With Legend Demonstration", "Times New Roman Bold Italic", 18
                ).setMargin2(0, 0, 16, 0);

            // Set the center of the pie at (160, 165) and the radius to 110 pixels
            c.setPieSize(160, 165, 110);

            // Draw the pie in 3D with a pie thickness of 25 pixels
            c.set3D(25);

            // Set the pie data and the pie labels
            c.setData(data, labels);

            // Set the sector colors
            c.setColors2(Chart.DataColor, colors);

            // Use local gradient shading for the sectors
            c.setSectorStyle(Chart.LocalGradientShading);

            // Use the side label layout method, with the labels positioned 16 pixels from the pie
            // bounding box
            c.setLabelLayout(Chart.SideLayout, 16);

            // Show only the sector number as the sector label
            c.setLabelFormat("{={sector}+1}");

            // Set the sector label style to Arial Bold 10pt, with a dark grey (444444) border
            c.setLabelStyle("Arial Bold", 10).setBackground(Chart.Transparent, 0x444444);

            // Add a legend box, with the center of the left side anchored at (330, 175), and using 10pt
            // Arial Bold Italic font
            LegendBox b = c.addLegend(330, 175, true, "Arial Bold Italic", 10);
            b.setAlignment(Chart.Left);

            // Set the legend box border to dark grey (444444), and with rounded conerns
            b.setBackground(Chart.Transparent, 0x444444);
            b.setRoundedCorners();

            // Set the legend box margin to 16 pixels, and the extra line spacing between the legend
            // entries as 5 pixels
            b.setMargin(16);
            b.setKeySpacing(0, 5);

            // Set the legend box icon to have no border (border color same as fill color)
            b.setKeyBorder(Chart.SameAsMainColor);

            // Set the legend text to show the sector number, followed by a 120 pixels wide block showing
            // the sector label, and a 40 pixels wide block showing the percentage
            b.setText(
                "<*block,valign=top*>{={sector}+1}.<*advanceTo=22*><*block,width=120*>{label}<*/*>" +
                "<*block,width=40,halign=right*>{percent}<*/*>%");

            // Output the chart
            viewer.Image = c.makeWebImage(Chart.SVG);

            // Include tool tip for the chart
            viewer.ImageMap = c.getHTMLImageMap("", "",
                "title='{label}: US${value}K ({percent}%)'");
        }
    }
}
[ASP.NET MVC - View] NetMvcCharts\Views\Shared\ChartView.cshtml
@{ Layout = null; }

<!DOCTYPE html>

<html>
<head>
    <meta name="viewport" content="width=device-width" />
    <title>@ViewBag.Title</title>
    <style>
        @ViewBag.Style
    </style>
    @Scripts.Render("~/Scripts/cdjcv.js")
</head>
<body style="margin:5px 0px 0px 5px">
    <div style="font:bold 18pt verdana;">
        @ViewBag.Title
    </div>
    <hr style="border:solid 1px #000080; background:#000080" />
    <div>
        @{
            if (ViewBag.Viewer is Array)
            {
                // Display multiple charts
                for (int i = 0; i < ViewBag.Viewer.Length; ++i)
                {
                    @:@Html.Raw(ViewBag.Viewer[i].RenderHTML())
                }
            }
            else
            {
                // Display one chart only
                @:@Html.Raw(ViewBag.Viewer.RenderHTML())
            }
        }
    </div>
</body>
</html>
© 2023 Advanced Software Engineering Limited. All rights reserved.