[Windows Forms - C# version] NetWinCharts\CSharpWinCharts\multibar.cs
using System;
using ChartDirector;
namespace CSharpChartExplorer
{
public class multibar : DemoModule
{
//Name of demo module
public string getName() { return "Multi-Bar Chart"; }
//Number of charts produced in this demo module
public int getNoOfCharts() { return 1; }
//Main code for creating chart.
//Note: the argument chartIndex is unused because this demo only has 1 chart.
public void createChart(WinChartViewer viewer, int chartIndex)
{
// The data for the bar chart
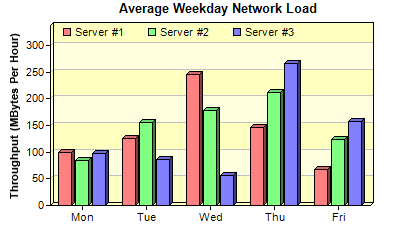
double[] data0 = {100, 125, 245, 147, 67};
double[] data1 = {85, 156, 179, 211, 123};
double[] data2 = {97, 87, 56, 267, 157};
string[] labels = {"Mon", "Tue", "Wed", "Thu", "Fri"};
// Create a XYChart object of size 400 x 240 pixels
XYChart c = new XYChart(400, 240);
// Add a title to the chart using 10 pt Arial font
c.addTitle(" Average Weekday Network Load", "", 10);
// Set the plot area at (50, 25) and of size 320 x 180. Use two alternative background
// colors (0xffffc0 and 0xffffe0)
c.setPlotArea(50, 25, 320, 180, 0xffffc0, 0xffffe0);
// Add a legend box at (55, 18) using horizontal layout. Use 8 pt Arial font, with
// transparent background
c.addLegend(55, 18, false, "", 8).setBackground(Chart.Transparent);
// Add a title to the y-axis
c.yAxis().setTitle("Throughput (MBytes Per Hour)");
// Reserve 20 pixels at the top of the y-axis for the legend box
c.yAxis().setTopMargin(20);
// Set the x axis labels
c.xAxis().setLabels(labels);
// Add a multi-bar layer with 3 data sets and 3 pixels 3D depth
BarLayer layer = c.addBarLayer2(Chart.Side, 3);
layer.addDataSet(data0, 0xff8080, "Server #1");
layer.addDataSet(data1, 0x80ff80, "Server #2");
layer.addDataSet(data2, 0x8080ff, "Server #3");
// Output the chart
viewer.Chart = c;
//include tool tip for the chart
viewer.ImageMap = c.getHTMLImageMap("clickable", "",
"title='{dataSetName} on {xLabel}: {value} MBytes/hour'");
}
}
}
[Windows Forms - VB Version] NetWinCharts\VBNetWinCharts\multibar.vb
Imports System
Imports Microsoft.VisualBasic
Imports ChartDirector

Public Class multibar
    Implements DemoModule

    'Name of demo module
    Public Function getName() As String Implements DemoModule.getName
        Return "Multi-Bar Chart"
    End Function

    'Number of charts produced in this demo module
    Public Function getNoOfCharts() As Integer Implements DemoModule.getNoOfCharts
        Return 1
    End Function

    'Main code for creating chart.
    'Note: the argument chartIndex is unused because this demo only has 1 chart.
    Public Sub createChart(viewer As WinChartViewer, chartIndex As Integer) _
        Implements DemoModule.createChart

        ' The data for the bar chart
        Dim data0() As Double = {100, 125, 245, 147, 67}
        Dim data1() As Double = {85, 156, 179, 211, 123}
        Dim data2() As Double = {97, 87, 56, 267, 157}
        Dim labels() As String = {"Mon", "Tue", "Wed", "Thu", "Fri"}

        ' Create a XYChart object of size 400 x 240 pixels
        Dim c As XYChart = New XYChart(400, 240)

        ' Add a title to the chart using 10 pt Arial font
        c.addTitle("         Average Weekday Network Load", "", 10)

        ' Set the plot area at (50, 25) and of size 320 x 180. Use two alternative background colors
        ' (0xffffc0 and 0xffffe0)
        c.setPlotArea(50, 25, 320, 180, &Hffffc0, &Hffffe0)

        ' Add a legend box at (55, 18) using horizontal layout. Use 8 pt Arial font, with
        ' transparent background
        c.addLegend(55, 18, False, "", 8).setBackground(Chart.Transparent)

        ' Add a title to the y-axis
        c.yAxis().setTitle("Throughput (MBytes Per Hour)")

        ' Reserve 20 pixels at the top of the y-axis for the legend box
        c.yAxis().setTopMargin(20)

        ' Set the x axis labels
        c.xAxis().setLabels(labels)

        ' Add a multi-bar layer with 3 data sets and 3 pixels 3D depth
        Dim layer As BarLayer = c.addBarLayer2(Chart.Side, 3)
        layer.addDataSet(data0, &Hff8080, "Server #1")
        layer.addDataSet(data1, &H80ff80, "Server #2")
        layer.addDataSet(data2, &H8080ff, "Server #3")

        ' Output the chart
        viewer.Chart = c

        'include tool tip for the chart
        viewer.ImageMap = c.getHTMLImageMap("clickable", "", _
            "title='{dataSetName} on {xLabel}: {value} MBytes/hour'")

    End Sub

End Class
[WPF - C#] NetWPFCharts\CSharpWPFCharts\multibar.cs
using System;
using ChartDirector;

namespace CSharpWPFCharts
{
    public class multibar : DemoModule
    {
        //Name of demo module
        public string getName() { return "Multi-Bar Chart"; }

        //Number of charts produced in this demo module
        public int getNoOfCharts() { return 1; }

        //Main code for creating chart.
        //Note: the argument chartIndex is unused because this demo only has 1 chart.
        public void createChart(WPFChartViewer viewer, int chartIndex)
        {
            // The data for the bar chart
            double[] data0 = {100, 125, 245, 147, 67};
            double[] data1 = {85, 156, 179, 211, 123};
            double[] data2 = {97, 87, 56, 267, 157};
            string[] labels = {"Mon", "Tue", "Wed", "Thu", "Fri"};

            // Create a XYChart object of size 400 x 240 pixels
            XYChart c = new XYChart(400, 240);

            // Add a title to the chart using 10 pt Arial font
            c.addTitle("         Average Weekday Network Load", "", 10);

            // Set the plot area at (50, 25) and of size 320 x 180. Use two alternative background
            // colors (0xffffc0 and 0xffffe0)
            c.setPlotArea(50, 25, 320, 180, 0xffffc0, 0xffffe0);

            // Add a legend box at (55, 18) using horizontal layout. Use 8 pt Arial font, with
            // transparent background
            c.addLegend(55, 18, false, "", 8).setBackground(Chart.Transparent);

            // Add a title to the y-axis
            c.yAxis().setTitle("Throughput (MBytes Per Hour)");

            // Reserve 20 pixels at the top of the y-axis for the legend box
            c.yAxis().setTopMargin(20);

            // Set the x axis labels
            c.xAxis().setLabels(labels);

            // Add a multi-bar layer with 3 data sets and 3 pixels 3D depth
            BarLayer layer = c.addBarLayer2(Chart.Side, 3);
            layer.addDataSet(data0, 0xff8080, "Server #1");
            layer.addDataSet(data1, 0x80ff80, "Server #2");
            layer.addDataSet(data2, 0x8080ff, "Server #3");

            // Output the chart
            viewer.Chart = c;

            //include tool tip for the chart
            viewer.ImageMap = c.getHTMLImageMap("clickable", "",
                "title='{dataSetName} on {xLabel}: {value} MBytes/hour'");
        }
    }
}
[ASP.NET Web Forms - C# version] NetWebCharts\CSharpASP\multibar.aspx
(Click here on how to convert this code to code-behind style.)<%@ Page Language="C#" Debug="true" %>
<%@ Import Namespace="ChartDirector" %>
<%@ Register TagPrefix="chart" Namespace="ChartDirector" Assembly="netchartdir" %>
<!DOCTYPE html>
<script runat="server">
//
// Page Load event handler
//
protected void Page_Load(object sender, EventArgs e)
{
// The data for the bar chart
double[] data0 = {100, 125, 245, 147, 67};
double[] data1 = {85, 156, 179, 211, 123};
double[] data2 = {97, 87, 56, 267, 157};
string[] labels = {"Mon", "Tue", "Wed", "Thu", "Fri"};
// Create a XYChart object of size 400 x 240 pixels
XYChart c = new XYChart(400, 240);
// Add a title to the chart using 10 pt Arial font
c.addTitle(" Average Weekday Network Load", "", 10);
// Set the plot area at (50, 25) and of size 320 x 180. Use two alternative background colors
// (0xffffc0 and 0xffffe0)
c.setPlotArea(50, 25, 320, 180, 0xffffc0, 0xffffe0);
// Add a legend box at (55, 18) using horizontal layout. Use 8 pt Arial font, with transparent
// background
c.addLegend(55, 18, false, "", 8).setBackground(Chart.Transparent);
// Add a title to the y-axis
c.yAxis().setTitle("Throughput (MBytes Per Hour)");
// Reserve 20 pixels at the top of the y-axis for the legend box
c.yAxis().setTopMargin(20);
// Set the x axis labels
c.xAxis().setLabels(labels);
// Add a multi-bar layer with 3 data sets and 3 pixels 3D depth
BarLayer layer = c.addBarLayer2(Chart.Side, 3);
layer.addDataSet(data0, 0xff8080, "Server #1");
layer.addDataSet(data1, 0x80ff80, "Server #2");
layer.addDataSet(data2, 0x8080ff, "Server #3");
// Output the chart
WebChartViewer1.Image = c.makeWebImage(Chart.SVG);
// Include tool tip for the chart
WebChartViewer1.ImageMap = c.getHTMLImageMap("", "",
"title='{dataSetName} on {xLabel}: {value} MBytes/hour'");
}
</script>
<html>
<head>
<script type="text/javascript" src="cdjcv.js"></script>
</head>
<body>
<chart:WebChartViewer id="WebChartViewer1" runat="server" />
</body>
</html>
[ASP.NET Web Forms - VB Version] NetWebCharts\VBNetASP\multibar.aspx
(Click here on how to convert this code to code-behind style.)<%@ Page Language="VB" Debug="true" %>
<%@ Import Namespace="ChartDirector" %>
<%@ Register TagPrefix="chart" Namespace="ChartDirector" Assembly="netchartdir" %>
<!DOCTYPE html>
<script runat="server">
'
' Page Load event handler
'
Protected Sub Page_Load(ByVal sender As System.Object, ByVal e As System.EventArgs)
' The data for the bar chart
Dim data0() As Double = {100, 125, 245, 147, 67}
Dim data1() As Double = {85, 156, 179, 211, 123}
Dim data2() As Double = {97, 87, 56, 267, 157}
Dim labels() As String = {"Mon", "Tue", "Wed", "Thu", "Fri"}
' Create a XYChart object of size 400 x 240 pixels
Dim c As XYChart = New XYChart(400, 240)
' Add a title to the chart using 10 pt Arial font
c.addTitle(" Average Weekday Network Load", "", 10)
' Set the plot area at (50, 25) and of size 320 x 180. Use two alternative background colors
' (0xffffc0 and 0xffffe0)
c.setPlotArea(50, 25, 320, 180, &Hffffc0, &Hffffe0)
' Add a legend box at (55, 18) using horizontal layout. Use 8 pt Arial font, with transparent
' background
c.addLegend(55, 18, False, "", 8).setBackground(Chart.Transparent)
' Add a title to the y-axis
c.yAxis().setTitle("Throughput (MBytes Per Hour)")
' Reserve 20 pixels at the top of the y-axis for the legend box
c.yAxis().setTopMargin(20)
' Set the x axis labels
c.xAxis().setLabels(labels)
' Add a multi-bar layer with 3 data sets and 3 pixels 3D depth
Dim layer As BarLayer = c.addBarLayer2(Chart.Side, 3)
layer.addDataSet(data0, &Hff8080, "Server #1")
layer.addDataSet(data1, &H80ff80, "Server #2")
layer.addDataSet(data2, &H8080ff, "Server #3")
' Output the chart
WebChartViewer1.Image = c.makeWebImage(Chart.SVG)
' Include tool tip for the chart
WebChartViewer1.ImageMap = c.getHTMLImageMap("", "", _
"title='{dataSetName} on {xLabel}: {value} MBytes/hour'")
End Sub
</script>
<html>
<head>
<script type="text/javascript" src="cdjcv.js"></script>
</head>
<body>
<chart:WebChartViewer id="WebChartViewer1" runat="server" />
</body>
</html>
[ASP.NET MVC - Controller] NetMvcCharts\Controllers\MultibarController.cs
using System;
using System.Web.Mvc;
using ChartDirector;

namespace NetMvcCharts.Controllers
{
    public class MultibarController : Controller
    {
        //
        // Default Action
        //
        public ActionResult Index()
        {
            ViewBag.Title = "Multi-Bar Chart";
            createChart(ViewBag.Viewer = new RazorChartViewer(HttpContext, "chart1"));
            return View("~/Views/Shared/ChartView.cshtml");
        }

        //
        // Create chart
        //
        private void createChart(RazorChartViewer viewer)
        {
            // The data for the bar chart
            double[] data0 = {100, 125, 245, 147, 67};
            double[] data1 = {85, 156, 179, 211, 123};
            double[] data2 = {97, 87, 56, 267, 157};
            string[] labels = {"Mon", "Tue", "Wed", "Thu", "Fri"};

            // Create a XYChart object of size 400 x 240 pixels
            XYChart c = new XYChart(400, 240);

            // Add a title to the chart using 10 pt Arial font
            c.addTitle("         Average Weekday Network Load", "", 10);

            // Set the plot area at (50, 25) and of size 320 x 180. Use two alternative background colors
            // (0xffffc0 and 0xffffe0)
            c.setPlotArea(50, 25, 320, 180, 0xffffc0, 0xffffe0);

            // Add a legend box at (55, 18) using horizontal layout. Use 8 pt Arial font, with
            // transparent background
            c.addLegend(55, 18, false, "", 8).setBackground(Chart.Transparent);

            // Add a title to the y-axis
            c.yAxis().setTitle("Throughput (MBytes Per Hour)");

            // Reserve 20 pixels at the top of the y-axis for the legend box
            c.yAxis().setTopMargin(20);

            // Set the x axis labels
            c.xAxis().setLabels(labels);

            // Add a multi-bar layer with 3 data sets and 3 pixels 3D depth
            BarLayer layer = c.addBarLayer2(Chart.Side, 3);
            layer.addDataSet(data0, 0xff8080, "Server #1");
            layer.addDataSet(data1, 0x80ff80, "Server #2");
            layer.addDataSet(data2, 0x8080ff, "Server #3");

            // Output the chart
            viewer.Image = c.makeWebImage(Chart.SVG);

            // Include tool tip for the chart
            viewer.ImageMap = c.getHTMLImageMap("", "",
                "title='{dataSetName} on {xLabel}: {value} MBytes/hour'");
        }
    }
}
[ASP.NET MVC - View] NetMvcCharts\Views\Shared\ChartView.cshtml
@{ Layout = null; }

<!DOCTYPE html>

<html>
<head>
    <meta name="viewport" content="width=device-width" />
    <title>@ViewBag.Title</title>
    <style>
        @ViewBag.Style
    </style>
    @Scripts.Render("~/Scripts/cdjcv.js")
</head>
<body style="margin:5px 0px 0px 5px">
    <div style="font:bold 18pt verdana;">
        @ViewBag.Title
    </div>
    <hr style="border:solid 1px #000080; background:#000080" />
    <div>
        @{
            if (ViewBag.Viewer is Array)
            {
                // Display multiple charts
                for (int i = 0; i < ViewBag.Viewer.Length; ++i)
                {
                    @:@Html.Raw(ViewBag.Viewer[i].RenderHTML())
                }
            }
            else
            {
                // Display one chart only
                @:@Html.Raw(ViewBag.Viewer.RenderHTML())
            }
        }
    </div>
</body>
</html>
© 2023 Advanced Software Engineering Limited. All rights reserved.