[Windows Forms - C# version] NetWinCharts\CSharpWinCharts\multidepthpie.cs
using System;
using ChartDirector;
namespace CSharpChartExplorer
{
public class multidepthpie : DemoModule
{
//Name of demo module
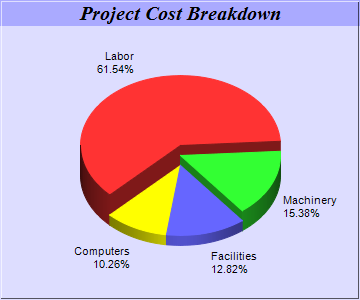
public string getName() { return "Multi-Depth Pie Chart"; }
//Number of charts produced in this demo module
public int getNoOfCharts() { return 1; }
//Main code for creating chart.
//Note: the argument chartIndex is unused because this demo only has 1 chart.
public void createChart(WinChartViewer viewer, int chartIndex)
{
// The data for the pie chart
double[] data = {72, 18, 15, 12};
// The labels for the pie chart
string[] labels = {"Labor", "Machinery", "Facilities", "Computers"};
// The depths for the sectors
double[] depths = {30, 20, 10, 10};
// Create a PieChart object of size 360 x 300 pixels, with a light blue (DDDDFF)
// background and a 1 pixel 3D border
PieChart c = new PieChart(360, 300, 0xddddff, -1, 1);
// Set the center of the pie at (180, 175) and the radius to 100 pixels
c.setPieSize(180, 175, 100);
// Add a title box using 15pt Times Bold Italic font and blue (AAAAFF) as background
// color
c.addTitle("Project Cost Breakdown", "Times New Roman Bold Italic", 15).setBackground(
0xaaaaff);
// Set the pie data and the pie labels
c.setData(data, labels);
// Draw the pie in 3D with variable 3D depths
c.set3D2(depths);
// Set the start angle to 225 degrees may improve layout when the depths of the sector
// are sorted in descending order, because it ensures the tallest sector is at the back.
c.setStartAngle(225);
// Output the chart
viewer.Chart = c;
//include tool tip for the chart
viewer.ImageMap = c.getHTMLImageMap("clickable", "",
"title='{label}: US${value}K ({percent}%)'");
}
}
}
[Windows Forms - VB Version] NetWinCharts\VBNetWinCharts\multidepthpie.vb
Imports System
Imports Microsoft.VisualBasic
Imports ChartDirector

Public Class multidepthpie
    Implements DemoModule

    'Name of demo module
    Public Function getName() As String Implements DemoModule.getName
        Return "Multi-Depth Pie Chart"
    End Function

    'Number of charts produced in this demo module
    Public Function getNoOfCharts() As Integer Implements DemoModule.getNoOfCharts
        Return 1
    End Function

    'Main code for creating chart.
    'Note: the argument chartIndex is unused because this demo only has 1 chart.
    Public Sub createChart(viewer As WinChartViewer, chartIndex As Integer) _
        Implements DemoModule.createChart

        ' The data for the pie chart
        Dim data() As Double = {72, 18, 15, 12}

        ' The labels for the pie chart
        Dim labels() As String = {"Labor", "Machinery", "Facilities", "Computers"}

        ' The depths for the sectors
        Dim depths() As Double = {30, 20, 10, 10}

        ' Create a PieChart object of size 360 x 300 pixels, with a light blue (DDDDFF) background
        ' and a 1 pixel 3D border
        Dim c As PieChart = New PieChart(360, 300, &Hddddff, -1, 1)

        ' Set the center of the pie at (180, 175) and the radius to 100 pixels
        c.setPieSize(180, 175, 100)

        ' Add a title box using 15pt Times Bold Italic font and blue (AAAAFF) as background color
        c.addTitle("Project Cost Breakdown", "Times New Roman Bold Italic", 15).setBackground( _
            &Haaaaff)

        ' Set the pie data and the pie labels
        c.setData(data, labels)

        ' Draw the pie in 3D with variable 3D depths
        c.set3D2(depths)

        ' Set the start angle to 225 degrees may improve layout when the depths of the sector are
        ' sorted in descending order, because it ensures the tallest sector is at the back.
        c.setStartAngle(225)

        ' Output the chart
        viewer.Chart = c

        'include tool tip for the chart
        viewer.ImageMap = c.getHTMLImageMap("clickable", "", _
            "title='{label}: US${value}K ({percent}%)'")

    End Sub

End Class
[WPF - C#] NetWPFCharts\CSharpWPFCharts\multidepthpie.cs
using System;
using ChartDirector;

namespace CSharpWPFCharts
{
    public class multidepthpie : DemoModule
    {
        //Name of demo module
        public string getName() { return "Multi-Depth Pie Chart"; }

        //Number of charts produced in this demo module
        public int getNoOfCharts() { return 1; }

        //Main code for creating chart.
        //Note: the argument chartIndex is unused because this demo only has 1 chart.
        public void createChart(WPFChartViewer viewer, int chartIndex)
        {
            // The data for the pie chart
            double[] data = {72, 18, 15, 12};

            // The labels for the pie chart
            string[] labels = {"Labor", "Machinery", "Facilities", "Computers"};

            // The depths for the sectors
            double[] depths = {30, 20, 10, 10};

            // Create a PieChart object of size 360 x 300 pixels, with a light blue (DDDDFF)
            // background and a 1 pixel 3D border
            PieChart c = new PieChart(360, 300, 0xddddff, -1, 1);

            // Set the center of the pie at (180, 175) and the radius to 100 pixels
            c.setPieSize(180, 175, 100);

            // Add a title box using 15pt Times Bold Italic font and blue (AAAAFF) as background
            // color
            c.addTitle("Project Cost Breakdown", "Times New Roman Bold Italic", 15).setBackground(
                0xaaaaff);

            // Set the pie data and the pie labels
            c.setData(data, labels);

            // Draw the pie in 3D with variable 3D depths
            c.set3D2(depths);

            // Set the start angle to 225 degrees may improve layout when the depths of the sector
            // are sorted in descending order, because it ensures the tallest sector is at the back.
            c.setStartAngle(225);

            // Output the chart
            viewer.Chart = c;

            //include tool tip for the chart
            viewer.ImageMap = c.getHTMLImageMap("clickable", "",
                "title='{label}: US${value}K ({percent}%)'");
        }
    }
}
[ASP.NET Web Forms - C# version] NetWebCharts\CSharpASP\multidepthpie.aspx
(Click here on how to convert this code to code-behind style.)<%@ Page Language="C#" Debug="true" %>
<%@ Import Namespace="ChartDirector" %>
<%@ Register TagPrefix="chart" Namespace="ChartDirector" Assembly="netchartdir" %>
<!DOCTYPE html>
<script runat="server">
//
// Page Load event handler
//
protected void Page_Load(object sender, EventArgs e)
{
// The data for the pie chart
double[] data = {72, 18, 15, 12};
// The labels for the pie chart
string[] labels = {"Labor", "Machinery", "Facilities", "Computers"};
// The depths for the sectors
double[] depths = {30, 20, 10, 10};
// Create a PieChart object of size 360 x 300 pixels, with a light blue (DDDDFF) background and
// a 1 pixel 3D border
PieChart c = new PieChart(360, 300, 0xddddff, -1, 1);
// Set the center of the pie at (180, 175) and the radius to 100 pixels
c.setPieSize(180, 175, 100);
// Add a title box using 15pt Times Bold Italic font and blue (AAAAFF) as background color
c.addTitle("Project Cost Breakdown", "Times New Roman Bold Italic", 15).setBackground(0xaaaaff);
// Set the pie data and the pie labels
c.setData(data, labels);
// Draw the pie in 3D with variable 3D depths
c.set3D2(depths);
// Set the start angle to 225 degrees may improve layout when the depths of the sector are
// sorted in descending order, because it ensures the tallest sector is at the back.
c.setStartAngle(225);
// Output the chart
WebChartViewer1.Image = c.makeWebImage(Chart.SVG);
// Include tool tip for the chart
WebChartViewer1.ImageMap = c.getHTMLImageMap("", "", "title='{label}: US${value}K ({percent}%)'"
);
}
</script>
<html>
<head>
<script type="text/javascript" src="cdjcv.js"></script>
</head>
<body>
<chart:WebChartViewer id="WebChartViewer1" runat="server" />
</body>
</html>
[ASP.NET Web Forms - VB Version] NetWebCharts\VBNetASP\multidepthpie.aspx
(Click here on how to convert this code to code-behind style.)<%@ Page Language="VB" Debug="true" %>
<%@ Import Namespace="ChartDirector" %>
<%@ Register TagPrefix="chart" Namespace="ChartDirector" Assembly="netchartdir" %>
<!DOCTYPE html>
<script runat="server">
'
' Page Load event handler
'
Protected Sub Page_Load(ByVal sender As System.Object, ByVal e As System.EventArgs)
' The data for the pie chart
Dim data() As Double = {72, 18, 15, 12}
' The labels for the pie chart
Dim labels() As String = {"Labor", "Machinery", "Facilities", "Computers"}
' The depths for the sectors
Dim depths() As Double = {30, 20, 10, 10}
' Create a PieChart object of size 360 x 300 pixels, with a light blue (DDDDFF) background and a
' 1 pixel 3D border
Dim c As PieChart = New PieChart(360, 300, &Hddddff, -1, 1)
' Set the center of the pie at (180, 175) and the radius to 100 pixels
c.setPieSize(180, 175, 100)
' Add a title box using 15pt Times Bold Italic font and blue (AAAAFF) as background color
c.addTitle("Project Cost Breakdown", "Times New Roman Bold Italic", 15).setBackground(&Haaaaff)
' Set the pie data and the pie labels
c.setData(data, labels)
' Draw the pie in 3D with variable 3D depths
c.set3D2(depths)
' Set the start angle to 225 degrees may improve layout when the depths of the sector are sorted
' in descending order, because it ensures the tallest sector is at the back.
c.setStartAngle(225)
' Output the chart
WebChartViewer1.Image = c.makeWebImage(Chart.SVG)
' Include tool tip for the chart
WebChartViewer1.ImageMap = c.getHTMLImageMap("", "", _
"title='{label}: US${value}K ({percent}%)'")
End Sub
</script>
<html>
<head>
<script type="text/javascript" src="cdjcv.js"></script>
</head>
<body>
<chart:WebChartViewer id="WebChartViewer1" runat="server" />
</body>
</html>
[ASP.NET MVC - Controller] NetMvcCharts\Controllers\MultidepthpieController.cs
using System;
using System.Web.Mvc;
using ChartDirector;

namespace NetMvcCharts.Controllers
{
    public class MultidepthpieController : Controller
    {
        //
        // Default Action
        //
        public ActionResult Index()
        {
            ViewBag.Title = "Multi-Depth Pie Chart";
            createChart(ViewBag.Viewer = new RazorChartViewer(HttpContext, "chart1"));
            return View("~/Views/Shared/ChartView.cshtml");
        }

        //
        // Create chart
        //
        private void createChart(RazorChartViewer viewer)
        {
            // The data for the pie chart
            double[] data = {72, 18, 15, 12};

            // The labels for the pie chart
            string[] labels = {"Labor", "Machinery", "Facilities", "Computers"};

            // The depths for the sectors
            double[] depths = {30, 20, 10, 10};

            // Create a PieChart object of size 360 x 300 pixels, with a light blue (DDDDFF) background
            // and a 1 pixel 3D border
            PieChart c = new PieChart(360, 300, 0xddddff, -1, 1);

            // Set the center of the pie at (180, 175) and the radius to 100 pixels
            c.setPieSize(180, 175, 100);

            // Add a title box using 15pt Times Bold Italic font and blue (AAAAFF) as background color
            c.addTitle("Project Cost Breakdown", "Times New Roman Bold Italic", 15).setBackground(
                0xaaaaff);

            // Set the pie data and the pie labels
            c.setData(data, labels);

            // Draw the pie in 3D with variable 3D depths
            c.set3D2(depths);

            // Set the start angle to 225 degrees may improve layout when the depths of the sector are
            // sorted in descending order, because it ensures the tallest sector is at the back.
            c.setStartAngle(225);

            // Output the chart
            viewer.Image = c.makeWebImage(Chart.SVG);

            // Include tool tip for the chart
            viewer.ImageMap = c.getHTMLImageMap("", "",
                "title='{label}: US${value}K ({percent}%)'");
        }
    }
}
[ASP.NET MVC - View] NetMvcCharts\Views\Shared\ChartView.cshtml
@{ Layout = null; }

<!DOCTYPE html>

<html>
<head>
    <meta name="viewport" content="width=device-width" />
    <title>@ViewBag.Title</title>
    <style>
        @ViewBag.Style
    </style>
    @Scripts.Render("~/Scripts/cdjcv.js")
</head>
<body style="margin:5px 0px 0px 5px">
    <div style="font:bold 18pt verdana;">
        @ViewBag.Title
    </div>
    <hr style="border:solid 1px #000080; background:#000080" />
    <div>
        @{
            if (ViewBag.Viewer is Array)
            {
                // Display multiple charts
                for (int i = 0; i < ViewBag.Viewer.Length; ++i)
                {
                    @:@Html.Raw(ViewBag.Viewer[i].RenderHTML())
                }
            }
            else
            {
                // Display one chart only
                @:@Html.Raw(ViewBag.Viewer.RenderHTML())
            }
        }
    </div>
</body>
</html>
© 2023 Advanced Software Engineering Limited. All rights reserved.