[Windows Forms - C# version] NetWinCharts\CSharpWinCharts\multileveltreemaplayout.cs
using System;
using ChartDirector;
namespace CSharpChartExplorer
{
public class multileveltreemaplayout : DemoModule
{
//Name of demo module
public string getName() { return "Multi Level Tree Map Layout"; }
//Number of charts produced in this demo module
public int getNoOfCharts() { return 6; }
//Main code for creating charts
public void createChart(WinChartViewer viewer, int chartIndex)
{
// The first level nodes of the tree map. There are 4 nodes.
string[] names = {"A", "B", "C", "D"};
// Use random numbers for second level nodes
RanSeries r = new RanSeries(11 + chartIndex);
double[] series0 = r.getSeries(6, 10, 100);
double[] series1 = r.getSeries(6, 10, 100);
double[] series2 = r.getSeries(6, 10, 100);
double[] series3 = r.getSeries(6, 10, 100);
// Colors for second level nodes
int[] colors0 = {0xddeedd, 0xbbeebb, 0x99ee99, 0x77ee77, 0x55ee55, 0x33ee33};
int[] colors1 = {0xffeedd, 0xffddbb, 0xffcc99, 0xffbb77, 0xffaa55, 0xff9933};
int[] colors2 = {0xddeeff, 0xbbddff, 0x99ccee, 0x77bbee, 0x55aadd, 0x3399dd};
int[] colors3 = {0xffeeff, 0xeeccee, 0xddaadd, 0xcc88cc, 0xbb66bb, 0xaa44aa};
// Create a Tree Map object of size 400 x 380 pixels
TreeMapChart c = new TreeMapChart(400, 380);
// Set the plotarea at (10, 35) and of size 380 x 300 pixels
c.setPlotArea(10, 35, 380, 300);
// Obtain the root of the tree map, which is the entire plot area
TreeMapNode root = c.getRootNode();
// Add first level nodes to the root. We do not need to provide data as they will be
// computed as the sum of the second level nodes.
root.setData(null, names);
// Add second level nodes to each of the first level node
root.getNode(0).setData(series0, null, colors0);
root.getNode(1).setData(series1, null, colors1);
root.getNode(2).setData(series2, null, colors2);
root.getNode(3).setData(series3, null, colors2);
// Get the prototype (template) for the first level nodes.
TreeMapNode nodeConfig = c.getLevelPrototype(1);
// Hide the first level node cell border by setting its color to transparent
nodeConfig.setColors(-1, Chart.Transparent);
// Get the prototype (template) for the second level nodes.
TreeMapNode nodeConfig2 = c.getLevelPrototype(2);
// Set the label format for the nodes to include the parent node's label and index of
// the second level node. Use semi-transparent black (3f000000) Arial Bold font and put
// the label at the center of the cell.
nodeConfig2.setLabelFormat("{parent.label}{index}", "Arial Bold", 8, 0x3f000000,
Chart.Center);
// Set the second level node cell border to white (ffffff)
nodeConfig2.setColors(-1, 0xffffff);
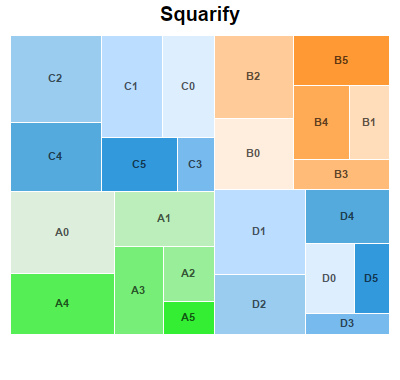
if (chartIndex == 0) {
// Squarify (default) - Layout the cells so that they are as square as possible.
c.addTitle("Squarify", "Arial Bold", 15);
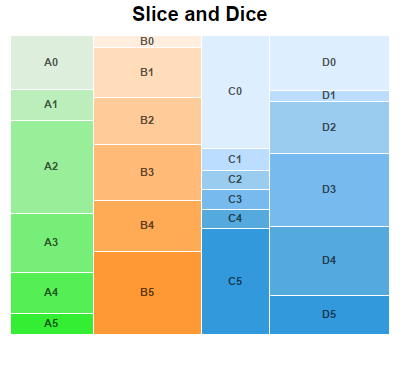
} else if (chartIndex == 1) {
// Slice and Dice - First level cells flow horizontally. Second level cells flow
// vertically. (The setLayoutMethod also supports other flow directions.)
c.addTitle("Slice and Dice", "Arial Bold", 15);
root.setLayoutMethod(Chart.TreeMapSliceAndDice);
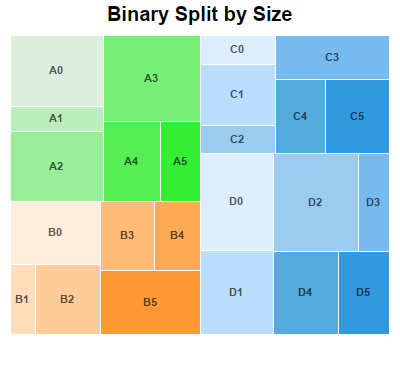
} else if (chartIndex == 2) {
// Binary Split by Size - Split the cells into left/right groups so that their size
// are as close as possible. For each group, split the cells into top/bottom groups
// using the same criteria. Continue until each group contains one cell. (The
// setLayoutMethod also supports other flow directions.)
c.addTitle("Binary Split by Size", "Arial Bold", 15);
root.setLayoutMethod(Chart.TreeMapBinaryBySize);
nodeConfig.setLayoutMethod(Chart.TreeMapBinaryBySize);
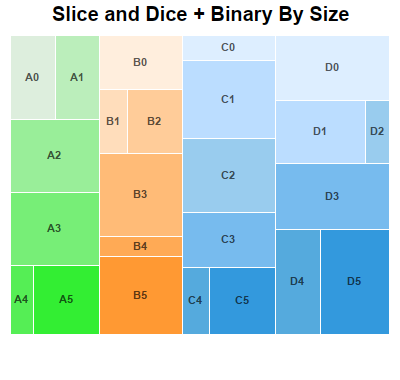
} else if (chartIndex == 3) {
// Layout first level cells using Slice and Dice. Layout second level cells using
// Binary Split By Size.
c.addTitle("Slice and Dice + Binary By Size", "Arial Bold", 15);
root.setLayoutMethod(Chart.TreeMapSliceAndDice);
nodeConfig.setLayoutMethod(Chart.TreeMapBinaryBySize);
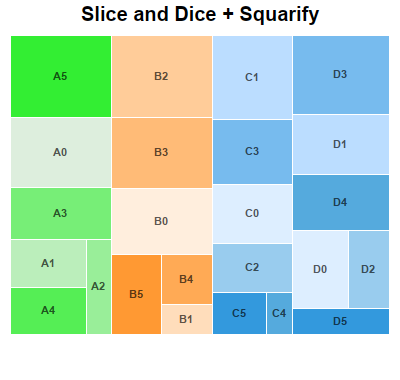
} else if (chartIndex == 4) {
// Layout first level cells using Slice and Dice. Layout second level cells using
// Squarify.
c.addTitle("Slice and Dice + Squarify", "Arial Bold", 15);
root.setLayoutMethod(Chart.TreeMapSliceAndDice);
nodeConfig.setLayoutMethod(Chart.TreeMapSquarify);
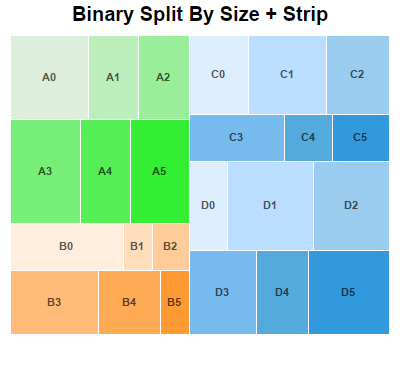
} else if (chartIndex == 5) {
// Layout first level cells using Binary Split By Size.. Layout second level cells
// using Strip. With Strip layout, cells flow from left to right, top to bottom. The
// number of cells in each row is such that they will be as close to a square as
// possible. (The setLayoutMethod also supports other flow directions.)
c.addTitle("Binary Split By Size + Strip", "Arial Bold", 15);
root.setLayoutMethod(Chart.TreeMapBinaryBySize);
nodeConfig.setLayoutMethod(Chart.TreeMapStrip);
}
// Output the chart
viewer.Chart = c;
//include tool tip for the chart
viewer.ImageMap = c.getHTMLImageMap("clickable", "",
"title='<*cdml*>{parent.label}{index}: {value|2}'");
}
}
}
[Windows Forms - VB Version] NetWinCharts\VBNetWinCharts\multileveltreemaplayout.vb
Imports System
Imports Microsoft.VisualBasic
Imports ChartDirector

Public Class multileveltreemaplayout
    Implements DemoModule

    'Name of demo module
    Public Function getName() As String Implements DemoModule.getName
        Return "Multi Level Tree Map Layout"
    End Function

    'Number of charts produced in this demo module
    Public Function getNoOfCharts() As Integer Implements DemoModule.getNoOfCharts
        Return 6
    End Function

    'Main code for creating charts
    Public Sub createChart(viewer As WinChartViewer, chartIndex As Integer) _
        Implements DemoModule.createChart

        ' The first level nodes of the tree map. There are 4 nodes.
        Dim names() As String = {"A", "B", "C", "D"}

        ' Use random numbers for second level nodes
        Dim r As RanSeries = New RanSeries(11 + chartIndex)

        Dim series0() As Double = r.getSeries(6, 10, 100)
        Dim series1() As Double = r.getSeries(6, 10, 100)
        Dim series2() As Double = r.getSeries(6, 10, 100)
        Dim series3() As Double = r.getSeries(6, 10, 100)

        ' Colors for second level nodes
        Dim colors0() As Integer = {&Hddeedd, &Hbbeebb, &H99ee99, &H77ee77, &H55ee55, &H33ee33}
        Dim colors1() As Integer = {&Hffeedd, &Hffddbb, &Hffcc99, &Hffbb77, &Hffaa55, &Hff9933}
        Dim colors2() As Integer = {&Hddeeff, &Hbbddff, &H99ccee, &H77bbee, &H55aadd, &H3399dd}
        Dim colors3() As Integer = {&Hffeeff, &Heeccee, &Hddaadd, &Hcc88cc, &Hbb66bb, &Haa44aa}

        ' Create a Tree Map object of size 400 x 380 pixels
        Dim c As TreeMapChart = New TreeMapChart(400, 380)

        ' Set the plotarea at (10, 35) and of size 380 x 300 pixels
        c.setPlotArea(10, 35, 380, 300)

        ' Obtain the root of the tree map, which is the entire plot area
        Dim root As TreeMapNode = c.getRootNode()

        ' Add first level nodes to the root. We do not need to provide data as they will be computed
        ' as the sum of the second level nodes.
        root.setData(Nothing, names)

        ' Add second level nodes to each of the first level node
        root.getNode(0).setData(series0, Nothing, colors0)
        root.getNode(1).setData(series1, Nothing, colors1)
        root.getNode(2).setData(series2, Nothing, colors2)
        root.getNode(3).setData(series3, Nothing, colors2)

        ' Get the prototype (template) for the first level nodes.
        Dim nodeConfig As TreeMapNode = c.getLevelPrototype(1)

        ' Hide the first level node cell border by setting its color to transparent
        nodeConfig.setColors(-1, Chart.Transparent)

        ' Get the prototype (template) for the second level nodes.
        Dim nodeConfig2 As TreeMapNode = c.getLevelPrototype(2)

        ' Set the label format for the nodes to include the parent node's label and index of the
        ' second level node. Use semi-transparent black (3f000000) Arial Bold font and put the label
        ' at the center of the cell.
        nodeConfig2.setLabelFormat("{parent.label}{index}", "Arial Bold", 8, &H3f000000, _
            Chart.Center)

        ' Set the second level node cell border to white (ffffff)
        nodeConfig2.setColors(-1, &Hffffff)

        If chartIndex = 0 Then
            ' Squarify (default) - Layout the cells so that they are as square as possible.
            c.addTitle("Squarify", "Arial Bold", 15)
        ElseIf chartIndex = 1 Then
            ' Slice and Dice - First level cells flow horizontally. Second level cells flow
            ' vertically. (The setLayoutMethod also supports other flow directions.)
            c.addTitle("Slice and Dice", "Arial Bold", 15)
            root.setLayoutMethod(Chart.TreeMapSliceAndDice)
        ElseIf chartIndex = 2 Then
            ' Binary Split by Size - Split the cells into left/right groups so that their size are
            ' as close as possible. For each group, split the cells into top/bottom groups using the
            ' same criteria. Continue until each group contains one cell. (The setLayoutMethod also
            ' supports other flow directions.)
            c.addTitle("Binary Split by Size", "Arial Bold", 15)
            root.setLayoutMethod(Chart.TreeMapBinaryBySize)
            nodeConfig.setLayoutMethod(Chart.TreeMapBinaryBySize)
        ElseIf chartIndex = 3 Then
            ' Layout first level cells using Slice and Dice. Layout second level cells using Binary
            ' Split By Size.
            c.addTitle("Slice and Dice + Binary By Size", "Arial Bold", 15)
            root.setLayoutMethod(Chart.TreeMapSliceAndDice)
            nodeConfig.setLayoutMethod(Chart.TreeMapBinaryBySize)
        ElseIf chartIndex = 4 Then
            ' Layout first level cells using Slice and Dice. Layout second level cells using
            ' Squarify.
            c.addTitle("Slice and Dice + Squarify", "Arial Bold", 15)
            root.setLayoutMethod(Chart.TreeMapSliceAndDice)
            nodeConfig.setLayoutMethod(Chart.TreeMapSquarify)
        ElseIf chartIndex = 5 Then
            ' Layout first level cells using Binary Split By Size.. Layout second level cells using
            ' Strip. With Strip layout, cells flow from left to right, top to bottom. The number of
            ' cells in each row is such that they will be as close to a square as possible. (The
            ' setLayoutMethod also supports other flow directions.)
            c.addTitle("Binary Split By Size + Strip", "Arial Bold", 15)
            root.setLayoutMethod(Chart.TreeMapBinaryBySize)
            nodeConfig.setLayoutMethod(Chart.TreeMapStrip)
        End If

        ' Output the chart
        viewer.Chart = c

        'include tool tip for the chart
        viewer.ImageMap = c.getHTMLImageMap("clickable", "", _
            "title='<*cdml*>{parent.label}{index}: {value|2}'")

    End Sub

End Class
[WPF - C#] NetWPFCharts\CSharpWPFCharts\multileveltreemaplayout.cs
using System;
using ChartDirector;

namespace CSharpWPFCharts
{
    public class multileveltreemaplayout : DemoModule
    {
        //Name of demo module
        public string getName() { return "Multi Level Tree Map Layout"; }

        //Number of charts produced in this demo module
        public int getNoOfCharts() { return 6; }

        //Main code for creating charts
        public void createChart(WPFChartViewer viewer, int chartIndex)
        {
            // The first level nodes of the tree map. There are 4 nodes.
            string[] names = {"A", "B", "C", "D"};

            // Use random numbers for second level nodes
            RanSeries r = new RanSeries(11 + chartIndex);

            double[] series0 = r.getSeries(6, 10, 100);
            double[] series1 = r.getSeries(6, 10, 100);
            double[] series2 = r.getSeries(6, 10, 100);
            double[] series3 = r.getSeries(6, 10, 100);

            // Colors for second level nodes
            int[] colors0 = {0xddeedd, 0xbbeebb, 0x99ee99, 0x77ee77, 0x55ee55, 0x33ee33};
            int[] colors1 = {0xffeedd, 0xffddbb, 0xffcc99, 0xffbb77, 0xffaa55, 0xff9933};
            int[] colors2 = {0xddeeff, 0xbbddff, 0x99ccee, 0x77bbee, 0x55aadd, 0x3399dd};
            int[] colors3 = {0xffeeff, 0xeeccee, 0xddaadd, 0xcc88cc, 0xbb66bb, 0xaa44aa};

            // Create a Tree Map object of size 400 x 380 pixels
            TreeMapChart c = new TreeMapChart(400, 380);

            // Set the plotarea at (10, 35) and of size 380 x 300 pixels
            c.setPlotArea(10, 35, 380, 300);

            // Obtain the root of the tree map, which is the entire plot area
            TreeMapNode root = c.getRootNode();

            // Add first level nodes to the root. We do not need to provide data as they will be
            // computed as the sum of the second level nodes.
            root.setData(null, names);

            // Add second level nodes to each of the first level node
            root.getNode(0).setData(series0, null, colors0);
            root.getNode(1).setData(series1, null, colors1);
            root.getNode(2).setData(series2, null, colors2);
            root.getNode(3).setData(series3, null, colors2);

            // Get the prototype (template) for the first level nodes.
            TreeMapNode nodeConfig = c.getLevelPrototype(1);

            // Hide the first level node cell border by setting its color to transparent
            nodeConfig.setColors(-1, Chart.Transparent);

            // Get the prototype (template) for the second level nodes.
            TreeMapNode nodeConfig2 = c.getLevelPrototype(2);

            // Set the label format for the nodes to include the parent node's label and index of
            // the second level node. Use semi-transparent black (3f000000) Arial Bold font and put
            // the label at the center of the cell.
            nodeConfig2.setLabelFormat("{parent.label}{index}", "Arial Bold", 8, 0x3f000000,
                Chart.Center);

            // Set the second level node cell border to white (ffffff)
            nodeConfig2.setColors(-1, 0xffffff);

            if (chartIndex == 0) {
                // Squarify (default) - Layout the cells so that they are as square as possible.
                c.addTitle("Squarify", "Arial Bold", 15);
            } else if (chartIndex == 1) {
                // Slice and Dice - First level cells flow horizontally. Second level cells flow
                // vertically. (The setLayoutMethod also supports other flow directions.)
                c.addTitle("Slice and Dice", "Arial Bold", 15);
                root.setLayoutMethod(Chart.TreeMapSliceAndDice);
            } else if (chartIndex == 2) {
                // Binary Split by Size - Split the cells into left/right groups so that their size
                // are as close as possible. For each group, split the cells into top/bottom groups
                // using the same criteria. Continue until each group contains one cell. (The
                // setLayoutMethod also supports other flow directions.)
                c.addTitle("Binary Split by Size", "Arial Bold", 15);
                root.setLayoutMethod(Chart.TreeMapBinaryBySize);
                nodeConfig.setLayoutMethod(Chart.TreeMapBinaryBySize);
            } else if (chartIndex == 3) {
                // Layout first level cells using Slice and Dice. Layout second level cells using
                // Binary Split By Size.
                c.addTitle("Slice and Dice + Binary By Size", "Arial Bold", 15);
                root.setLayoutMethod(Chart.TreeMapSliceAndDice);
                nodeConfig.setLayoutMethod(Chart.TreeMapBinaryBySize);
            } else if (chartIndex == 4) {
                // Layout first level cells using Slice and Dice. Layout second level cells using
                // Squarify.
                c.addTitle("Slice and Dice + Squarify", "Arial Bold", 15);
                root.setLayoutMethod(Chart.TreeMapSliceAndDice);
                nodeConfig.setLayoutMethod(Chart.TreeMapSquarify);
            } else if (chartIndex == 5) {
                // Layout first level cells using Binary Split By Size.. Layout second level cells
                // using Strip. With Strip layout, cells flow from left to right, top to bottom. The
                // number of cells in each row is such that they will be as close to a square as
                // possible. (The setLayoutMethod also supports other flow directions.)
                c.addTitle("Binary Split By Size + Strip", "Arial Bold", 15);
                root.setLayoutMethod(Chart.TreeMapBinaryBySize);
                nodeConfig.setLayoutMethod(Chart.TreeMapStrip);
            }

            // Output the chart
            viewer.Chart = c;

            //include tool tip for the chart
            viewer.ImageMap = c.getHTMLImageMap("clickable", "",
                "title='<*cdml*>{parent.label}{index}: {value|2}'");
        }
    }
}
[ASP.NET Web Forms - C# version] NetWebCharts\CSharpASP\multileveltreemaplayout.aspx
(Click here on how to convert this code to code-behind style.)<%@ Page Language="C#" Debug="true" %>
<%@ Import Namespace="ChartDirector" %>
<%@ Register TagPrefix="chart" Namespace="ChartDirector" Assembly="netchartdir" %>
<!DOCTYPE html>
<script runat="server">
//
// Create chart
//
protected void createChart(WebChartViewer viewer, int chartIndex)
{
// The first level nodes of the tree map. There are 4 nodes.
string[] names = {"A", "B", "C", "D"};
// Use random numbers for second level nodes
RanSeries r = new RanSeries(11 + chartIndex);
double[] series0 = r.getSeries(6, 10, 100);
double[] series1 = r.getSeries(6, 10, 100);
double[] series2 = r.getSeries(6, 10, 100);
double[] series3 = r.getSeries(6, 10, 100);
// Colors for second level nodes
int[] colors0 = {0xddeedd, 0xbbeebb, 0x99ee99, 0x77ee77, 0x55ee55, 0x33ee33};
int[] colors1 = {0xffeedd, 0xffddbb, 0xffcc99, 0xffbb77, 0xffaa55, 0xff9933};
int[] colors2 = {0xddeeff, 0xbbddff, 0x99ccee, 0x77bbee, 0x55aadd, 0x3399dd};
int[] colors3 = {0xffeeff, 0xeeccee, 0xddaadd, 0xcc88cc, 0xbb66bb, 0xaa44aa};
// Create a Tree Map object of size 400 x 380 pixels
TreeMapChart c = new TreeMapChart(400, 380);
// Set the plotarea at (10, 35) and of size 380 x 300 pixels
c.setPlotArea(10, 35, 380, 300);
// Obtain the root of the tree map, which is the entire plot area
TreeMapNode root = c.getRootNode();
// Add first level nodes to the root. We do not need to provide data as they will be computed as
// the sum of the second level nodes.
root.setData(null, names);
// Add second level nodes to each of the first level node
root.getNode(0).setData(series0, null, colors0);
root.getNode(1).setData(series1, null, colors1);
root.getNode(2).setData(series2, null, colors2);
root.getNode(3).setData(series3, null, colors2);
// Get the prototype (template) for the first level nodes.
TreeMapNode nodeConfig = c.getLevelPrototype(1);
// Hide the first level node cell border by setting its color to transparent
nodeConfig.setColors(-1, Chart.Transparent);
// Get the prototype (template) for the second level nodes.
TreeMapNode nodeConfig2 = c.getLevelPrototype(2);
// Set the label format for the nodes to include the parent node's label and index of the second
// level node. Use semi-transparent black (3f000000) Arial Bold font and put the label at the
// center of the cell.
nodeConfig2.setLabelFormat("{parent.label}{index}", "Arial Bold", 8, 0x3f000000, Chart.Center);
// Set the second level node cell border to white (ffffff)
nodeConfig2.setColors(-1, 0xffffff);
if (chartIndex == 0) {
// Squarify (default) - Layout the cells so that they are as square as possible.
c.addTitle("Squarify", "Arial Bold", 15);
} else if (chartIndex == 1) {
// Slice and Dice - First level cells flow horizontally. Second level cells flow vertically.
// (The setLayoutMethod also supports other flow directions.)
c.addTitle("Slice and Dice", "Arial Bold", 15);
root.setLayoutMethod(Chart.TreeMapSliceAndDice);
} else if (chartIndex == 2) {
// Binary Split by Size - Split the cells into left/right groups so that their size are as
// close as possible. For each group, split the cells into top/bottom groups using the same
// criteria. Continue until each group contains one cell. (The setLayoutMethod also supports
// other flow directions.)
c.addTitle("Binary Split by Size", "Arial Bold", 15);
root.setLayoutMethod(Chart.TreeMapBinaryBySize);
nodeConfig.setLayoutMethod(Chart.TreeMapBinaryBySize);
} else if (chartIndex == 3) {
// Layout first level cells using Slice and Dice. Layout second level cells using Binary
// Split By Size.
c.addTitle("Slice and Dice + Binary By Size", "Arial Bold", 15);
root.setLayoutMethod(Chart.TreeMapSliceAndDice);
nodeConfig.setLayoutMethod(Chart.TreeMapBinaryBySize);
} else if (chartIndex == 4) {
// Layout first level cells using Slice and Dice. Layout second level cells using Squarify.
c.addTitle("Slice and Dice + Squarify", "Arial Bold", 15);
root.setLayoutMethod(Chart.TreeMapSliceAndDice);
nodeConfig.setLayoutMethod(Chart.TreeMapSquarify);
} else if (chartIndex == 5) {
// Layout first level cells using Binary Split By Size.. Layout second level cells using
// Strip. With Strip layout, cells flow from left to right, top to bottom. The number of
// cells in each row is such that they will be as close to a square as possible. (The
// setLayoutMethod also supports other flow directions.)
c.addTitle("Binary Split By Size + Strip", "Arial Bold", 15);
root.setLayoutMethod(Chart.TreeMapBinaryBySize);
nodeConfig.setLayoutMethod(Chart.TreeMapStrip);
}
// Output the chart
viewer.Image = c.makeWebImage(Chart.SVG);
// Include tool tip for the chart
viewer.ImageMap = c.getHTMLImageMap("", "", "title='<*cdml*>{parent.label}{index}: {value|2}'");
}
//
// Page Load event handler
//
protected void Page_Load(object sender, EventArgs e)
{
createChart(WebChartViewer0, 0);
createChart(WebChartViewer1, 1);
createChart(WebChartViewer2, 2);
createChart(WebChartViewer3, 3);
createChart(WebChartViewer4, 4);
createChart(WebChartViewer5, 5);
}
</script>
<html>
<head>
<script type="text/javascript" src="cdjcv.js"></script>
</head>
<body>
<chart:WebChartViewer id="WebChartViewer0" runat="server" />
<chart:WebChartViewer id="WebChartViewer1" runat="server" />
<chart:WebChartViewer id="WebChartViewer2" runat="server" />
<chart:WebChartViewer id="WebChartViewer3" runat="server" />
<chart:WebChartViewer id="WebChartViewer4" runat="server" />
<chart:WebChartViewer id="WebChartViewer5" runat="server" />
</body>
</html>
[ASP.NET Web Forms - VB Version] NetWebCharts\VBNetASP\multileveltreemaplayout.aspx
(Click here on how to convert this code to code-behind style.)<%@ Page Language="VB" Debug="true" %>
<%@ Import Namespace="ChartDirector" %>
<%@ Register TagPrefix="chart" Namespace="ChartDirector" Assembly="netchartdir" %>
<!DOCTYPE html>
<script runat="server">
'
' Create chart
'
Protected Sub createChart(viewer As WebChartViewer, chartIndex As Integer)
' The first level nodes of the tree map. There are 4 nodes.
Dim names() As String = {"A", "B", "C", "D"}
' Use random numbers for second level nodes
Dim r As RanSeries = New RanSeries(11 + chartIndex)
Dim series0() As Double = r.getSeries(6, 10, 100)
Dim series1() As Double = r.getSeries(6, 10, 100)
Dim series2() As Double = r.getSeries(6, 10, 100)
Dim series3() As Double = r.getSeries(6, 10, 100)
' Colors for second level nodes
Dim colors0() As Integer = {&Hddeedd, &Hbbeebb, &H99ee99, &H77ee77, &H55ee55, &H33ee33}
Dim colors1() As Integer = {&Hffeedd, &Hffddbb, &Hffcc99, &Hffbb77, &Hffaa55, &Hff9933}
Dim colors2() As Integer = {&Hddeeff, &Hbbddff, &H99ccee, &H77bbee, &H55aadd, &H3399dd}
Dim colors3() As Integer = {&Hffeeff, &Heeccee, &Hddaadd, &Hcc88cc, &Hbb66bb, &Haa44aa}
' Create a Tree Map object of size 400 x 380 pixels
Dim c As TreeMapChart = New TreeMapChart(400, 380)
' Set the plotarea at (10, 35) and of size 380 x 300 pixels
c.setPlotArea(10, 35, 380, 300)
' Obtain the root of the tree map, which is the entire plot area
Dim root As TreeMapNode = c.getRootNode()
' Add first level nodes to the root. We do not need to provide data as they will be computed as
' the sum of the second level nodes.
root.setData(Nothing, names)
' Add second level nodes to each of the first level node
root.getNode(0).setData(series0, Nothing, colors0)
root.getNode(1).setData(series1, Nothing, colors1)
root.getNode(2).setData(series2, Nothing, colors2)
root.getNode(3).setData(series3, Nothing, colors2)
' Get the prototype (template) for the first level nodes.
Dim nodeConfig As TreeMapNode = c.getLevelPrototype(1)
' Hide the first level node cell border by setting its color to transparent
nodeConfig.setColors(-1, Chart.Transparent)
' Get the prototype (template) for the second level nodes.
Dim nodeConfig2 As TreeMapNode = c.getLevelPrototype(2)
' Set the label format for the nodes to include the parent node's label and index of the second
' level node. Use semi-transparent black (3f000000) Arial Bold font and put the label at the
' center of the cell.
nodeConfig2.setLabelFormat("{parent.label}{index}", "Arial Bold", 8, &H3f000000, Chart.Center)
' Set the second level node cell border to white (ffffff)
nodeConfig2.setColors(-1, &Hffffff)
If chartIndex = 0 Then
' Squarify (default) - Layout the cells so that they are as square as possible.
c.addTitle("Squarify", "Arial Bold", 15)
ElseIf chartIndex = 1 Then
' Slice and Dice - First level cells flow horizontally. Second level cells flow vertically.
' (The setLayoutMethod also supports other flow directions.)
c.addTitle("Slice and Dice", "Arial Bold", 15)
root.setLayoutMethod(Chart.TreeMapSliceAndDice)
ElseIf chartIndex = 2 Then
' Binary Split by Size - Split the cells into left/right groups so that their size are as
' close as possible. For each group, split the cells into top/bottom groups using the same
' criteria. Continue until each group contains one cell. (The setLayoutMethod also supports
' other flow directions.)
c.addTitle("Binary Split by Size", "Arial Bold", 15)
root.setLayoutMethod(Chart.TreeMapBinaryBySize)
nodeConfig.setLayoutMethod(Chart.TreeMapBinaryBySize)
ElseIf chartIndex = 3 Then
' Layout first level cells using Slice and Dice. Layout second level cells using Binary
' Split By Size.
c.addTitle("Slice and Dice + Binary By Size", "Arial Bold", 15)
root.setLayoutMethod(Chart.TreeMapSliceAndDice)
nodeConfig.setLayoutMethod(Chart.TreeMapBinaryBySize)
ElseIf chartIndex = 4 Then
' Layout first level cells using Slice and Dice. Layout second level cells using Squarify.
c.addTitle("Slice and Dice + Squarify", "Arial Bold", 15)
root.setLayoutMethod(Chart.TreeMapSliceAndDice)
nodeConfig.setLayoutMethod(Chart.TreeMapSquarify)
ElseIf chartIndex = 5 Then
' Layout first level cells using Binary Split By Size.. Layout second level cells using
' Strip. With Strip layout, cells flow from left to right, top to bottom. The number of
' cells in each row is such that they will be as close to a square as possible. (The
' setLayoutMethod also supports other flow directions.)
c.addTitle("Binary Split By Size + Strip", "Arial Bold", 15)
root.setLayoutMethod(Chart.TreeMapBinaryBySize)
nodeConfig.setLayoutMethod(Chart.TreeMapStrip)
End If
' Output the chart
viewer.Image = c.makeWebImage(Chart.SVG)
' Include tool tip for the chart
viewer.ImageMap = c.getHTMLImageMap("", "", "title='<*cdml*>{parent.label}{index}: {value|2}'")
End Sub
'
' Page Load event handler
'
Protected Sub Page_Load(ByVal sender As System.Object, ByVal e As System.EventArgs)
createChart(WebChartViewer0, 0)
createChart(WebChartViewer1, 1)
createChart(WebChartViewer2, 2)
createChart(WebChartViewer3, 3)
createChart(WebChartViewer4, 4)
createChart(WebChartViewer5, 5)
End Sub
</script>
<html>
<head>
<script type="text/javascript" src="cdjcv.js"></script>
</head>
<body>
<chart:WebChartViewer id="WebChartViewer0" runat="server" />
<chart:WebChartViewer id="WebChartViewer1" runat="server" />
<chart:WebChartViewer id="WebChartViewer2" runat="server" />
<chart:WebChartViewer id="WebChartViewer3" runat="server" />
<chart:WebChartViewer id="WebChartViewer4" runat="server" />
<chart:WebChartViewer id="WebChartViewer5" runat="server" />
</body>
</html>
[ASP.NET MVC - Controller] NetMvcCharts\Controllers\MultileveltreemaplayoutController.cs
using System;
using System.Web.Mvc;
using ChartDirector;

namespace NetMvcCharts.Controllers
{
    public class MultileveltreemaplayoutController : Controller
    {
        //
        // Default Action
        //
        public ActionResult Index()
        {
            ViewBag.Title = "Multi Level Tree Map Layout";

            // This example contains 6 charts.
            ViewBag.Viewer = new RazorChartViewer[6];
            for (int i = 0; i < ViewBag.Viewer.Length; ++i)
                createChart(ViewBag.Viewer[i] = new RazorChartViewer(HttpContext, "chart" + i), i);

            return View("~/Views/Shared/ChartView.cshtml");
        }

        //
        // Create chart
        //
        private void createChart(RazorChartViewer viewer, int chartIndex)
        {
            // The first level nodes of the tree map. There are 4 nodes.
            string[] names = {"A", "B", "C", "D"};

            // Use random numbers for second level nodes
            RanSeries r = new RanSeries(11 + chartIndex);

            double[] series0 = r.getSeries(6, 10, 100);
            double[] series1 = r.getSeries(6, 10, 100);
            double[] series2 = r.getSeries(6, 10, 100);
            double[] series3 = r.getSeries(6, 10, 100);

            // Colors for second level nodes
            int[] colors0 = {0xddeedd, 0xbbeebb, 0x99ee99, 0x77ee77, 0x55ee55, 0x33ee33};
            int[] colors1 = {0xffeedd, 0xffddbb, 0xffcc99, 0xffbb77, 0xffaa55, 0xff9933};
            int[] colors2 = {0xddeeff, 0xbbddff, 0x99ccee, 0x77bbee, 0x55aadd, 0x3399dd};
            int[] colors3 = {0xffeeff, 0xeeccee, 0xddaadd, 0xcc88cc, 0xbb66bb, 0xaa44aa};

            // Create a Tree Map object of size 400 x 380 pixels
            TreeMapChart c = new TreeMapChart(400, 380);

            // Set the plotarea at (10, 35) and of size 380 x 300 pixels
            c.setPlotArea(10, 35, 380, 300);

            // Obtain the root of the tree map, which is the entire plot area
            TreeMapNode root = c.getRootNode();

            // Add first level nodes to the root. We do not need to provide data as they will be computed
            // as the sum of the second level nodes.
            root.setData(null, names);

            // Add second level nodes to each of the first level node
            root.getNode(0).setData(series0, null, colors0);
            root.getNode(1).setData(series1, null, colors1);
            root.getNode(2).setData(series2, null, colors2);
            root.getNode(3).setData(series3, null, colors2);

            // Get the prototype (template) for the first level nodes.
            TreeMapNode nodeConfig = c.getLevelPrototype(1);

            // Hide the first level node cell border by setting its color to transparent
            nodeConfig.setColors(-1, Chart.Transparent);

            // Get the prototype (template) for the second level nodes.
            TreeMapNode nodeConfig2 = c.getLevelPrototype(2);

            // Set the label format for the nodes to include the parent node's label and index of the
            // second level node. Use semi-transparent black (3f000000) Arial Bold font and put the label
            // at the center of the cell.
            nodeConfig2.setLabelFormat("{parent.label}{index}", "Arial Bold", 8, 0x3f000000, Chart.Center
                );

            // Set the second level node cell border to white (ffffff)
            nodeConfig2.setColors(-1, 0xffffff);

            if (chartIndex == 0) {
                // Squarify (default) - Layout the cells so that they are as square as possible.
                c.addTitle("Squarify", "Arial Bold", 15);
            } else if (chartIndex == 1) {
                // Slice and Dice - First level cells flow horizontally. Second level cells flow
                // vertically. (The setLayoutMethod also supports other flow directions.)
                c.addTitle("Slice and Dice", "Arial Bold", 15);
                root.setLayoutMethod(Chart.TreeMapSliceAndDice);
            } else if (chartIndex == 2) {
                // Binary Split by Size - Split the cells into left/right groups so that their size are
                // as close as possible. For each group, split the cells into top/bottom groups using the
                // same criteria. Continue until each group contains one cell. (The setLayoutMethod also
                // supports other flow directions.)
                c.addTitle("Binary Split by Size", "Arial Bold", 15);
                root.setLayoutMethod(Chart.TreeMapBinaryBySize);
                nodeConfig.setLayoutMethod(Chart.TreeMapBinaryBySize);
            } else if (chartIndex == 3) {
                // Layout first level cells using Slice and Dice. Layout second level cells using Binary
                // Split By Size.
                c.addTitle("Slice and Dice + Binary By Size", "Arial Bold", 15);
                root.setLayoutMethod(Chart.TreeMapSliceAndDice);
                nodeConfig.setLayoutMethod(Chart.TreeMapBinaryBySize);
            } else if (chartIndex == 4) {
                // Layout first level cells using Slice and Dice. Layout second level cells using
                // Squarify.
                c.addTitle("Slice and Dice + Squarify", "Arial Bold", 15);
                root.setLayoutMethod(Chart.TreeMapSliceAndDice);
                nodeConfig.setLayoutMethod(Chart.TreeMapSquarify);
            } else if (chartIndex == 5) {
                // Layout first level cells using Binary Split By Size.. Layout second level cells using
                // Strip. With Strip layout, cells flow from left to right, top to bottom. The number of
                // cells in each row is such that they will be as close to a square as possible. (The
                // setLayoutMethod also supports other flow directions.)
                c.addTitle("Binary Split By Size + Strip", "Arial Bold", 15);
                root.setLayoutMethod(Chart.TreeMapBinaryBySize);
                nodeConfig.setLayoutMethod(Chart.TreeMapStrip);
            }

            // Output the chart
            viewer.Image = c.makeWebImage(Chart.SVG);

            // Include tool tip for the chart
            viewer.ImageMap = c.getHTMLImageMap("", "",
                "title='<*cdml*>{parent.label}{index}: {value|2}'");
        }
    }
}
[ASP.NET MVC - View] NetMvcCharts\Views\Shared\ChartView.cshtml
@{ Layout = null; }

<!DOCTYPE html>

<html>
<head>
    <meta name="viewport" content="width=device-width" />
    <title>@ViewBag.Title</title>
    <style>
        @ViewBag.Style
    </style>
    @Scripts.Render("~/Scripts/cdjcv.js")
</head>
<body style="margin:5px 0px 0px 5px">
    <div style="font:bold 18pt verdana;">
        @ViewBag.Title
    </div>
    <hr style="border:solid 1px #000080; background:#000080" />
    <div>
        @{
            if (ViewBag.Viewer is Array)
            {
                // Display multiple charts
                for (int i = 0; i < ViewBag.Viewer.Length; ++i)
                {
                    @:@Html.Raw(ViewBag.Viewer[i].RenderHTML())
                }
            }
            else
            {
                // Display one chart only
                @:@Html.Raw(ViewBag.Viewer.RenderHTML())
            }
        }
    </div>
</body>
</html>
© 2023 Advanced Software Engineering Limited. All rights reserved.