[Windows Forms - C# version] NetWinCharts\CSharpWinCharts\multiline.cs
using System;
using ChartDirector;
namespace CSharpChartExplorer
{
public class multiline : DemoModule
{
//Name of demo module
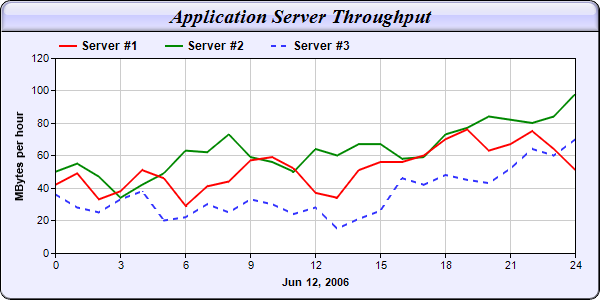
public string getName() { return "Multi-Line Chart (1)"; }
//Number of charts produced in this demo module
public int getNoOfCharts() { return 1; }
//Main code for creating chart.
//Note: the argument chartIndex is unused because this demo only has 1 chart.
public void createChart(WinChartViewer viewer, int chartIndex)
{
// The data for the line chart
double[] data0 = {42, 49, 33, 38, 51, 46, 29, 41, 44, 57, 59, 52, 37, 34, 51, 56, 56,
60, 70, 76, 63, 67, 75, 64, 51};
double[] data1 = {50, 55, 47, 34, 42, 49, 63, 62, 73, 59, 56, 50, 64, 60, 67, 67, 58,
59, 73, 77, 84, 82, 80, 84, 98};
double[] data2 = {36, 28, 25, 33, 38, 20, 22, 30, 25, 33, 30, 24, 28, 15, 21, 26, 46,
42, 48, 45, 43, 52, 64, 60, 70};
// The labels for the line chart
string[] labels = {"0", "1", "2", "3", "4", "5", "6", "7", "8", "9", "10", "11", "12",
"13", "14", "15", "16", "17", "18", "19", "20", "21", "22", "23", "24"};
// Create an XYChart object of size 600 x 300 pixels, with a light blue (EEEEFF)
// background, black border, 1 pxiel 3D border effect and rounded corners
XYChart c = new XYChart(600, 300, 0xeeeeff, 0x000000, 1);
c.setRoundedFrame();
// Set the plotarea at (55, 58) and of size 520 x 195 pixels, with white background.
// Turn on both horizontal and vertical grid lines with light grey color (0xcccccc)
c.setPlotArea(55, 58, 520, 195, 0xffffff, -1, -1, 0xcccccc, 0xcccccc);
// Add a legend box at (50, 30) (top of the chart) with horizontal layout. Use 9pt Arial
// Bold font. Set the background and border color to Transparent.
c.addLegend(50, 30, false, "Arial Bold", 9).setBackground(Chart.Transparent);
// Add a title box to the chart using 15pt Times Bold Italic font, on a light blue
// (CCCCFF) background with glass effect. white (0xffffff) on a dark red (0x800000)
// background, with a 1 pixel 3D border.
c.addTitle("Application Server Throughput", "Times New Roman Bold Italic", 15
).setBackground(0xccccff, 0x000000, Chart.glassEffect());
// Add a title to the y axis
c.yAxis().setTitle("MBytes per hour");
// Set the labels on the x axis.
c.xAxis().setLabels(labels);
// Display 1 out of 3 labels on the x-axis.
c.xAxis().setLabelStep(3);
// Add a title to the x axis
c.xAxis().setTitle("Jun 12, 2006");
// Add a line layer to the chart
LineLayer layer = c.addLineLayer2();
// Set the default line width to 2 pixels
layer.setLineWidth(2);
// Add the three data sets to the line layer. For demo purpose, we use a dash line color
// for the last line
layer.addDataSet(data0, 0xff0000, "Server #1");
layer.addDataSet(data1, 0x008800, "Server #2");
layer.addDataSet(data2, c.dashLineColor(0x3333ff, Chart.DashLine), "Server #3");
// Output the chart
viewer.Chart = c;
//include tool tip for the chart
viewer.ImageMap = c.getHTMLImageMap("clickable", "",
"title='[{dataSetName}] Hour {xLabel}: {value} MBytes'");
}
}
}
[Windows Forms - VB Version] NetWinCharts\VBNetWinCharts\multiline.vb
Imports System
Imports Microsoft.VisualBasic
Imports ChartDirector

Public Class multiline
    Implements DemoModule

    'Name of demo module
    Public Function getName() As String Implements DemoModule.getName
        Return "Multi-Line Chart (1)"
    End Function

    'Number of charts produced in this demo module
    Public Function getNoOfCharts() As Integer Implements DemoModule.getNoOfCharts
        Return 1
    End Function

    'Main code for creating chart.
    'Note: the argument chartIndex is unused because this demo only has 1 chart.
    Public Sub createChart(viewer As WinChartViewer, chartIndex As Integer) _
        Implements DemoModule.createChart

        ' The data for the line chart
        Dim data0() As Double = {42, 49, 33, 38, 51, 46, 29, 41, 44, 57, 59, 52, 37, 34, 51, 56, _
            56, 60, 70, 76, 63, 67, 75, 64, 51}
        Dim data1() As Double = {50, 55, 47, 34, 42, 49, 63, 62, 73, 59, 56, 50, 64, 60, 67, 67, _
            58, 59, 73, 77, 84, 82, 80, 84, 98}
        Dim data2() As Double = {36, 28, 25, 33, 38, 20, 22, 30, 25, 33, 30, 24, 28, 15, 21, 26, _
            46, 42, 48, 45, 43, 52, 64, 60, 70}

        ' The labels for the line chart
        Dim labels() As String = {"0", "1", "2", "3", "4", "5", "6", "7", "8", "9", "10", "11", _
            "12", "13", "14", "15", "16", "17", "18", "19", "20", "21", "22", "23", "24"}

        ' Create an XYChart object of size 600 x 300 pixels, with a light blue (EEEEFF) background,
        ' black border, 1 pxiel 3D border effect and rounded corners
        Dim c As XYChart = New XYChart(600, 300, &Heeeeff, &H000000, 1)
        c.setRoundedFrame()

        ' Set the plotarea at (55, 58) and of size 520 x 195 pixels, with white background. Turn on
        ' both horizontal and vertical grid lines with light grey color (0xcccccc)
        c.setPlotArea(55, 58, 520, 195, &Hffffff, -1, -1, &Hcccccc, &Hcccccc)

        ' Add a legend box at (50, 30) (top of the chart) with horizontal layout. Use 9pt Arial Bold
        ' font. Set the background and border color to Transparent.
        c.addLegend(50, 30, False, "Arial Bold", 9).setBackground(Chart.Transparent)

        ' Add a title box to the chart using 15pt Times Bold Italic font, on a light blue (CCCCFF)
        ' background with glass effect. white (0xffffff) on a dark red (0x800000) background, with a
        ' 1 pixel 3D border.
        c.addTitle("Application Server Throughput", "Times New Roman Bold Italic", 15 _
            ).setBackground(&Hccccff, &H000000, Chart.glassEffect())

        ' Add a title to the y axis
        c.yAxis().setTitle("MBytes per hour")

        ' Set the labels on the x axis.
        c.xAxis().setLabels(labels)

        ' Display 1 out of 3 labels on the x-axis.
        c.xAxis().setLabelStep(3)

        ' Add a title to the x axis
        c.xAxis().setTitle("Jun 12, 2006")

        ' Add a line layer to the chart
        Dim layer As LineLayer = c.addLineLayer2()

        ' Set the default line width to 2 pixels
        layer.setLineWidth(2)

        ' Add the three data sets to the line layer. For demo purpose, we use a dash line color for
        ' the last line
        layer.addDataSet(data0, &Hff0000, "Server #1")
        layer.addDataSet(data1, &H008800, "Server #2")
        layer.addDataSet(data2, c.dashLineColor(&H3333ff, Chart.DashLine), "Server #3")

        ' Output the chart
        viewer.Chart = c

        'include tool tip for the chart
        viewer.ImageMap = c.getHTMLImageMap("clickable", "", _
            "title='[{dataSetName}] Hour {xLabel}: {value} MBytes'")

    End Sub

End Class
[WPF - C#] NetWPFCharts\CSharpWPFCharts\multiline.cs
using System;
using ChartDirector;

namespace CSharpWPFCharts
{
    public class multiline : DemoModule
    {
        //Name of demo module
        public string getName() { return "Multi-Line Chart (1)"; }

        //Number of charts produced in this demo module
        public int getNoOfCharts() { return 1; }

        //Main code for creating chart.
        //Note: the argument chartIndex is unused because this demo only has 1 chart.
        public void createChart(WPFChartViewer viewer, int chartIndex)
        {
            // The data for the line chart
            double[] data0 = {42, 49, 33, 38, 51, 46, 29, 41, 44, 57, 59, 52, 37, 34, 51, 56, 56,
                60, 70, 76, 63, 67, 75, 64, 51};
            double[] data1 = {50, 55, 47, 34, 42, 49, 63, 62, 73, 59, 56, 50, 64, 60, 67, 67, 58,
                59, 73, 77, 84, 82, 80, 84, 98};
            double[] data2 = {36, 28, 25, 33, 38, 20, 22, 30, 25, 33, 30, 24, 28, 15, 21, 26, 46,
                42, 48, 45, 43, 52, 64, 60, 70};

            // The labels for the line chart
            string[] labels = {"0", "1", "2", "3", "4", "5", "6", "7", "8", "9", "10", "11", "12",
                "13", "14", "15", "16", "17", "18", "19", "20", "21", "22", "23", "24"};

            // Create an XYChart object of size 600 x 300 pixels, with a light blue (EEEEFF)
            // background, black border, 1 pxiel 3D border effect and rounded corners
            XYChart c = new XYChart(600, 300, 0xeeeeff, 0x000000, 1);
            c.setRoundedFrame();

            // Set the plotarea at (55, 58) and of size 520 x 195 pixels, with white background.
            // Turn on both horizontal and vertical grid lines with light grey color (0xcccccc)
            c.setPlotArea(55, 58, 520, 195, 0xffffff, -1, -1, 0xcccccc, 0xcccccc);

            // Add a legend box at (50, 30) (top of the chart) with horizontal layout. Use 9pt Arial
            // Bold font. Set the background and border color to Transparent.
            c.addLegend(50, 30, false, "Arial Bold", 9).setBackground(Chart.Transparent);

            // Add a title box to the chart using 15pt Times Bold Italic font, on a light blue
            // (CCCCFF) background with glass effect. white (0xffffff) on a dark red (0x800000)
            // background, with a 1 pixel 3D border.
            c.addTitle("Application Server Throughput", "Times New Roman Bold Italic", 15
                ).setBackground(0xccccff, 0x000000, Chart.glassEffect());

            // Add a title to the y axis
            c.yAxis().setTitle("MBytes per hour");

            // Set the labels on the x axis.
            c.xAxis().setLabels(labels);

            // Display 1 out of 3 labels on the x-axis.
            c.xAxis().setLabelStep(3);

            // Add a title to the x axis
            c.xAxis().setTitle("Jun 12, 2006");

            // Add a line layer to the chart
            LineLayer layer = c.addLineLayer2();

            // Set the default line width to 2 pixels
            layer.setLineWidth(2);

            // Add the three data sets to the line layer. For demo purpose, we use a dash line color
            // for the last line
            layer.addDataSet(data0, 0xff0000, "Server #1");
            layer.addDataSet(data1, 0x008800, "Server #2");
            layer.addDataSet(data2, c.dashLineColor(0x3333ff, Chart.DashLine), "Server #3");

            // Output the chart
            viewer.Chart = c;

            //include tool tip for the chart
            viewer.ImageMap = c.getHTMLImageMap("clickable", "",
                "title='[{dataSetName}] Hour {xLabel}: {value} MBytes'");
        }
    }
}
[ASP.NET Web Forms - C# version] NetWebCharts\CSharpASP\multiline.aspx
(Click here on how to convert this code to code-behind style.)<%@ Page Language="C#" Debug="true" %>
<%@ Import Namespace="ChartDirector" %>
<%@ Register TagPrefix="chart" Namespace="ChartDirector" Assembly="netchartdir" %>
<!DOCTYPE html>
<script runat="server">
//
// Page Load event handler
//
protected void Page_Load(object sender, EventArgs e)
{
// The data for the line chart
double[] data0 = {42, 49, 33, 38, 51, 46, 29, 41, 44, 57, 59, 52, 37, 34, 51, 56, 56, 60, 70,
76, 63, 67, 75, 64, 51};
double[] data1 = {50, 55, 47, 34, 42, 49, 63, 62, 73, 59, 56, 50, 64, 60, 67, 67, 58, 59, 73,
77, 84, 82, 80, 84, 98};
double[] data2 = {36, 28, 25, 33, 38, 20, 22, 30, 25, 33, 30, 24, 28, 15, 21, 26, 46, 42, 48,
45, 43, 52, 64, 60, 70};
// The labels for the line chart
string[] labels = {"0", "1", "2", "3", "4", "5", "6", "7", "8", "9", "10", "11", "12", "13",
"14", "15", "16", "17", "18", "19", "20", "21", "22", "23", "24"};
// Create an XYChart object of size 600 x 300 pixels, with a light blue (EEEEFF) background,
// black border, 1 pxiel 3D border effect and rounded corners
XYChart c = new XYChart(600, 300, 0xeeeeff, 0x000000, 1);
c.setRoundedFrame();
// Set the plotarea at (55, 58) and of size 520 x 195 pixels, with white background. Turn on
// both horizontal and vertical grid lines with light grey color (0xcccccc)
c.setPlotArea(55, 58, 520, 195, 0xffffff, -1, -1, 0xcccccc, 0xcccccc);
// Add a legend box at (50, 30) (top of the chart) with horizontal layout. Use 9pt Arial Bold
// font. Set the background and border color to Transparent.
c.addLegend(50, 30, false, "Arial Bold", 9).setBackground(Chart.Transparent);
// Add a title box to the chart using 15pt Times Bold Italic font, on a light blue (CCCCFF)
// background with glass effect. white (0xffffff) on a dark red (0x800000) background, with a 1
// pixel 3D border.
c.addTitle("Application Server Throughput", "Times New Roman Bold Italic", 15).setBackground(
0xccccff, 0x000000, Chart.glassEffect());
// Add a title to the y axis
c.yAxis().setTitle("MBytes per hour");
// Set the labels on the x axis.
c.xAxis().setLabels(labels);
// Display 1 out of 3 labels on the x-axis.
c.xAxis().setLabelStep(3);
// Add a title to the x axis
c.xAxis().setTitle("Jun 12, 2006");
// Add a line layer to the chart
LineLayer layer = c.addLineLayer2();
// Set the default line width to 2 pixels
layer.setLineWidth(2);
// Add the three data sets to the line layer. For demo purpose, we use a dash line color for the
// last line
layer.addDataSet(data0, 0xff0000, "Server #1");
layer.addDataSet(data1, 0x008800, "Server #2");
layer.addDataSet(data2, c.dashLineColor(0x3333ff, Chart.DashLine), "Server #3");
// Output the chart
WebChartViewer1.Image = c.makeWebImage(Chart.SVG);
// Include tool tip for the chart
WebChartViewer1.ImageMap = c.getHTMLImageMap("", "",
"title='[{dataSetName}] Hour {xLabel}: {value} MBytes'");
}
</script>
<html>
<head>
<script type="text/javascript" src="cdjcv.js"></script>
</head>
<body>
<chart:WebChartViewer id="WebChartViewer1" runat="server" />
</body>
</html>
[ASP.NET Web Forms - VB Version] NetWebCharts\VBNetASP\multiline.aspx
(Click here on how to convert this code to code-behind style.)<%@ Page Language="VB" Debug="true" %>
<%@ Import Namespace="ChartDirector" %>
<%@ Register TagPrefix="chart" Namespace="ChartDirector" Assembly="netchartdir" %>
<!DOCTYPE html>
<script runat="server">
'
' Page Load event handler
'
Protected Sub Page_Load(ByVal sender As System.Object, ByVal e As System.EventArgs)
' The data for the line chart
Dim data0() As Double = {42, 49, 33, 38, 51, 46, 29, 41, 44, 57, 59, 52, 37, 34, 51, 56, 56, _
60, 70, 76, 63, 67, 75, 64, 51}
Dim data1() As Double = {50, 55, 47, 34, 42, 49, 63, 62, 73, 59, 56, 50, 64, 60, 67, 67, 58, _
59, 73, 77, 84, 82, 80, 84, 98}
Dim data2() As Double = {36, 28, 25, 33, 38, 20, 22, 30, 25, 33, 30, 24, 28, 15, 21, 26, 46, _
42, 48, 45, 43, 52, 64, 60, 70}
' The labels for the line chart
Dim labels() As String = {"0", "1", "2", "3", "4", "5", "6", "7", "8", "9", "10", "11", "12", _
"13", "14", "15", "16", "17", "18", "19", "20", "21", "22", "23", "24"}
' Create an XYChart object of size 600 x 300 pixels, with a light blue (EEEEFF) background,
' black border, 1 pxiel 3D border effect and rounded corners
Dim c As XYChart = New XYChart(600, 300, &Heeeeff, &H000000, 1)
c.setRoundedFrame()
' Set the plotarea at (55, 58) and of size 520 x 195 pixels, with white background. Turn on both
' horizontal and vertical grid lines with light grey color (0xcccccc)
c.setPlotArea(55, 58, 520, 195, &Hffffff, -1, -1, &Hcccccc, &Hcccccc)
' Add a legend box at (50, 30) (top of the chart) with horizontal layout. Use 9pt Arial Bold
' font. Set the background and border color to Transparent.
c.addLegend(50, 30, False, "Arial Bold", 9).setBackground(Chart.Transparent)
' Add a title box to the chart using 15pt Times Bold Italic font, on a light blue (CCCCFF)
' background with glass effect. white (0xffffff) on a dark red (0x800000) background, with a 1
' pixel 3D border.
c.addTitle("Application Server Throughput", "Times New Roman Bold Italic", 15).setBackground( _
&Hccccff, &H000000, Chart.glassEffect())
' Add a title to the y axis
c.yAxis().setTitle("MBytes per hour")
' Set the labels on the x axis.
c.xAxis().setLabels(labels)
' Display 1 out of 3 labels on the x-axis.
c.xAxis().setLabelStep(3)
' Add a title to the x axis
c.xAxis().setTitle("Jun 12, 2006")
' Add a line layer to the chart
Dim layer As LineLayer = c.addLineLayer2()
' Set the default line width to 2 pixels
layer.setLineWidth(2)
' Add the three data sets to the line layer. For demo purpose, we use a dash line color for the
' last line
layer.addDataSet(data0, &Hff0000, "Server #1")
layer.addDataSet(data1, &H008800, "Server #2")
layer.addDataSet(data2, c.dashLineColor(&H3333ff, Chart.DashLine), "Server #3")
' Output the chart
WebChartViewer1.Image = c.makeWebImage(Chart.SVG)
' Include tool tip for the chart
WebChartViewer1.ImageMap = c.getHTMLImageMap("", "", _
"title='[{dataSetName}] Hour {xLabel}: {value} MBytes'")
End Sub
</script>
<html>
<head>
<script type="text/javascript" src="cdjcv.js"></script>
</head>
<body>
<chart:WebChartViewer id="WebChartViewer1" runat="server" />
</body>
</html>
[ASP.NET MVC - Controller] NetMvcCharts\Controllers\MultilineController.cs
using System;
using System.Web.Mvc;
using ChartDirector;

namespace NetMvcCharts.Controllers
{
    public class MultilineController : Controller
    {
        //
        // Default Action
        //
        public ActionResult Index()
        {
            ViewBag.Title = "Multi-Line Chart (1)";
            createChart(ViewBag.Viewer = new RazorChartViewer(HttpContext, "chart1"));
            return View("~/Views/Shared/ChartView.cshtml");
        }

        //
        // Create chart
        //
        private void createChart(RazorChartViewer viewer)
        {
            // The data for the line chart
            double[] data0 = {42, 49, 33, 38, 51, 46, 29, 41, 44, 57, 59, 52, 37, 34, 51, 56, 56, 60, 70,
                76, 63, 67, 75, 64, 51};
            double[] data1 = {50, 55, 47, 34, 42, 49, 63, 62, 73, 59, 56, 50, 64, 60, 67, 67, 58, 59, 73,
                77, 84, 82, 80, 84, 98};
            double[] data2 = {36, 28, 25, 33, 38, 20, 22, 30, 25, 33, 30, 24, 28, 15, 21, 26, 46, 42, 48,
                45, 43, 52, 64, 60, 70};

            // The labels for the line chart
            string[] labels = {"0", "1", "2", "3", "4", "5", "6", "7", "8", "9", "10", "11", "12", "13",
                "14", "15", "16", "17", "18", "19", "20", "21", "22", "23", "24"};

            // Create an XYChart object of size 600 x 300 pixels, with a light blue (EEEEFF) background,
            // black border, 1 pxiel 3D border effect and rounded corners
            XYChart c = new XYChart(600, 300, 0xeeeeff, 0x000000, 1);
            c.setRoundedFrame();

            // Set the plotarea at (55, 58) and of size 520 x 195 pixels, with white background. Turn on
            // both horizontal and vertical grid lines with light grey color (0xcccccc)
            c.setPlotArea(55, 58, 520, 195, 0xffffff, -1, -1, 0xcccccc, 0xcccccc);

            // Add a legend box at (50, 30) (top of the chart) with horizontal layout. Use 9pt Arial Bold
            // font. Set the background and border color to Transparent.
            c.addLegend(50, 30, false, "Arial Bold", 9).setBackground(Chart.Transparent);

            // Add a title box to the chart using 15pt Times Bold Italic font, on a light blue (CCCCFF)
            // background with glass effect. white (0xffffff) on a dark red (0x800000) background, with a
            // 1 pixel 3D border.
            c.addTitle("Application Server Throughput", "Times New Roman Bold Italic", 15).setBackground(
                0xccccff, 0x000000, Chart.glassEffect());

            // Add a title to the y axis
            c.yAxis().setTitle("MBytes per hour");

            // Set the labels on the x axis.
            c.xAxis().setLabels(labels);

            // Display 1 out of 3 labels on the x-axis.
            c.xAxis().setLabelStep(3);

            // Add a title to the x axis
            c.xAxis().setTitle("Jun 12, 2006");

            // Add a line layer to the chart
            LineLayer layer = c.addLineLayer2();

            // Set the default line width to 2 pixels
            layer.setLineWidth(2);

            // Add the three data sets to the line layer. For demo purpose, we use a dash line color for
            // the last line
            layer.addDataSet(data0, 0xff0000, "Server #1");
            layer.addDataSet(data1, 0x008800, "Server #2");
            layer.addDataSet(data2, c.dashLineColor(0x3333ff, Chart.DashLine), "Server #3");

            // Output the chart
            viewer.Image = c.makeWebImage(Chart.SVG);

            // Include tool tip for the chart
            viewer.ImageMap = c.getHTMLImageMap("", "",
                "title='[{dataSetName}] Hour {xLabel}: {value} MBytes'");
        }
    }
}
[ASP.NET MVC - View] NetMvcCharts\Views\Shared\ChartView.cshtml
@{ Layout = null; }

<!DOCTYPE html>

<html>
<head>
    <meta name="viewport" content="width=device-width" />
    <title>@ViewBag.Title</title>
    <style>
        @ViewBag.Style
    </style>
    @Scripts.Render("~/Scripts/cdjcv.js")
</head>
<body style="margin:5px 0px 0px 5px">
    <div style="font:bold 18pt verdana;">
        @ViewBag.Title
    </div>
    <hr style="border:solid 1px #000080; background:#000080" />
    <div>
        @{
            if (ViewBag.Viewer is Array)
            {
                // Display multiple charts
                for (int i = 0; i < ViewBag.Viewer.Length; ++i)
                {
                    @:@Html.Raw(ViewBag.Viewer[i].RenderHTML())
                }
            }
            else
            {
                // Display one chart only
                @:@Html.Raw(ViewBag.Viewer.RenderHTML())
            }
        }
    </div>
</body>
</html>
© 2023 Advanced Software Engineering Limited. All rights reserved.