[Windows Forms - C# version] NetWinCharts\CSharpWinCharts\multipie.cs
using System;
using ChartDirector;
namespace CSharpChartExplorer
{
public class multipie : DemoModule
{
//Name of demo module
public string getName() { return "Multi-Pie Chart"; }
//Number of charts produced in this demo module
public int getNoOfCharts() { return 3; }
//Main code for creating charts
public void createChart(WinChartViewer viewer, int chartIndex)
{
// The data for the pie chart
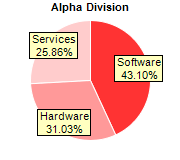
double[] data0 = {25, 18, 15};
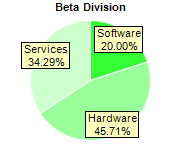
double[] data1 = {14, 32, 24};
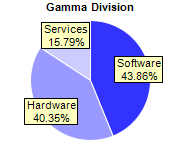
double[] data2 = {25, 23, 9};
// The labels for the pie chart
string[] labels = {"Software", "Hardware", "Services"};
// Create a PieChart object of size 180 x 160 pixels
PieChart c = new PieChart(180, 160);
// Set the center of the pie at (90, 80) and the radius to 60 pixels
c.setPieSize(90, 80, 60);
// Set the border color of the sectors to white (ffffff)
c.setLineColor(0xffffff);
// Set the background color of the sector label to pale yellow (ffffc0) with a black
// border (000000)
c.setLabelStyle().setBackground(0xffffc0, 0x000000);
// Set the label to be slightly inside the perimeter of the circle
c.setLabelLayout(Chart.CircleLayout, -10);
// Set the title, data and colors according to which pie to draw
if (chartIndex == 0) {
c.addTitle("Alpha Division", "Arial Bold", 8);
c.setData(data0, labels);
int[] colors0 = {0xff3333, 0xff9999, 0xffcccc};
c.setColors2(Chart.DataColor, colors0);
} else if (chartIndex == 1) {
c.addTitle("Beta Division", "Arial Bold", 8);
c.setData(data1, labels);
int[] colors1 = {0x33ff33, 0x99ff99, 0xccffcc};
c.setColors2(Chart.DataColor, colors1);
} else {
c.addTitle("Gamma Division", "Arial Bold", 8);
c.setData(data2, labels);
int[] colors2 = {0x3333ff, 0x9999ff, 0xccccff};
c.setColors2(Chart.DataColor, colors2);
}
// Output the chart
viewer.Chart = c;
//include tool tip for the chart
viewer.ImageMap = c.getHTMLImageMap("clickable", "",
"title='{label}: US${value}M ({percent}%)'");
}
}
}
[Windows Forms - VB Version] NetWinCharts\VBNetWinCharts\multipie.vb
Imports System
Imports Microsoft.VisualBasic
Imports ChartDirector

Public Class multipie
    Implements DemoModule

    'Name of demo module
    Public Function getName() As String Implements DemoModule.getName
        Return "Multi-Pie Chart"
    End Function

    'Number of charts produced in this demo module
    Public Function getNoOfCharts() As Integer Implements DemoModule.getNoOfCharts
        Return 3
    End Function

    'Main code for creating charts
    Public Sub createChart(viewer As WinChartViewer, chartIndex As Integer) _
        Implements DemoModule.createChart

        ' The data for the pie chart
        Dim data0() As Double = {25, 18, 15}
        Dim data1() As Double = {14, 32, 24}
        Dim data2() As Double = {25, 23, 9}

        ' The labels for the pie chart
        Dim labels() As String = {"Software", "Hardware", "Services"}

        ' Create a PieChart object of size 180 x 160 pixels
        Dim c As PieChart = New PieChart(180, 160)

        ' Set the center of the pie at (90, 80) and the radius to 60 pixels
        c.setPieSize(90, 80, 60)

        ' Set the border color of the sectors to white (ffffff)
        c.setLineColor(&Hffffff)

        ' Set the background color of the sector label to pale yellow (ffffc0) with a black border
        ' (000000)
        c.setLabelStyle().setBackground(&Hffffc0, &H000000)

        ' Set the label to be slightly inside the perimeter of the circle
        c.setLabelLayout(Chart.CircleLayout, -10)

        ' Set the title, data and colors according to which pie to draw
        If chartIndex = 0 Then
            c.addTitle("Alpha Division", "Arial Bold", 8)
            c.setData(data0, labels)
            Dim colors0() As Integer = {&Hff3333, &Hff9999, &Hffcccc}
            c.setColors2(Chart.DataColor, colors0)
        ElseIf chartIndex = 1 Then
            c.addTitle("Beta Division", "Arial Bold", 8)
            c.setData(data1, labels)
            Dim colors1() As Integer = {&H33ff33, &H99ff99, &Hccffcc}
            c.setColors2(Chart.DataColor, colors1)
        Else
            c.addTitle("Gamma Division", "Arial Bold", 8)
            c.setData(data2, labels)
            Dim colors2() As Integer = {&H3333ff, &H9999ff, &Hccccff}
            c.setColors2(Chart.DataColor, colors2)
        End If

        ' Output the chart
        viewer.Chart = c

        'include tool tip for the chart
        viewer.ImageMap = c.getHTMLImageMap("clickable", "", _
            "title='{label}: US${value}M ({percent}%)'")

    End Sub

End Class
[WPF - C#] NetWPFCharts\CSharpWPFCharts\multipie.cs
using System;
using ChartDirector;

namespace CSharpWPFCharts
{
    public class multipie : DemoModule
    {
        //Name of demo module
        public string getName() { return "Multi-Pie Chart"; }

        //Number of charts produced in this demo module
        public int getNoOfCharts() { return 3; }

        //Main code for creating charts
        public void createChart(WPFChartViewer viewer, int chartIndex)
        {
            // The data for the pie chart
            double[] data0 = {25, 18, 15};
            double[] data1 = {14, 32, 24};
            double[] data2 = {25, 23, 9};

            // The labels for the pie chart
            string[] labels = {"Software", "Hardware", "Services"};

            // Create a PieChart object of size 180 x 160 pixels
            PieChart c = new PieChart(180, 160);

            // Set the center of the pie at (90, 80) and the radius to 60 pixels
            c.setPieSize(90, 80, 60);

            // Set the border color of the sectors to white (ffffff)
            c.setLineColor(0xffffff);

            // Set the background color of the sector label to pale yellow (ffffc0) with a black
            // border (000000)
            c.setLabelStyle().setBackground(0xffffc0, 0x000000);

            // Set the label to be slightly inside the perimeter of the circle
            c.setLabelLayout(Chart.CircleLayout, -10);

            // Set the title, data and colors according to which pie to draw
            if (chartIndex == 0) {
                c.addTitle("Alpha Division", "Arial Bold", 8);
                c.setData(data0, labels);
                int[] colors0 = {0xff3333, 0xff9999, 0xffcccc};
                c.setColors2(Chart.DataColor, colors0);
            } else if (chartIndex == 1) {
                c.addTitle("Beta Division", "Arial Bold", 8);
                c.setData(data1, labels);
                int[] colors1 = {0x33ff33, 0x99ff99, 0xccffcc};
                c.setColors2(Chart.DataColor, colors1);
            } else {
                c.addTitle("Gamma Division", "Arial Bold", 8);
                c.setData(data2, labels);
                int[] colors2 = {0x3333ff, 0x9999ff, 0xccccff};
                c.setColors2(Chart.DataColor, colors2);
            }

            // Output the chart
            viewer.Chart = c;

            //include tool tip for the chart
            viewer.ImageMap = c.getHTMLImageMap("clickable", "",
                "title='{label}: US${value}M ({percent}%)'");
        }
    }
}
[ASP.NET Web Forms - C# version] NetWebCharts\CSharpASP\multipie.aspx
(Click here on how to convert this code to code-behind style.)<%@ Page Language="C#" Debug="true" %>
<%@ Import Namespace="ChartDirector" %>
<%@ Register TagPrefix="chart" Namespace="ChartDirector" Assembly="netchartdir" %>
<!DOCTYPE html>
<script runat="server">
//
// Create chart
//
protected void createChart(WebChartViewer viewer, int chartIndex)
{
// The data for the pie chart
double[] data0 = {25, 18, 15};
double[] data1 = {14, 32, 24};
double[] data2 = {25, 23, 9};
// The labels for the pie chart
string[] labels = {"Software", "Hardware", "Services"};
// Create a PieChart object of size 180 x 160 pixels
PieChart c = new PieChart(180, 160);
// Set the center of the pie at (90, 80) and the radius to 60 pixels
c.setPieSize(90, 80, 60);
// Set the border color of the sectors to white (ffffff)
c.setLineColor(0xffffff);
// Set the background color of the sector label to pale yellow (ffffc0) with a black border
// (000000)
c.setLabelStyle().setBackground(0xffffc0, 0x000000);
// Set the label to be slightly inside the perimeter of the circle
c.setLabelLayout(Chart.CircleLayout, -10);
// Set the title, data and colors according to which pie to draw
if (chartIndex == 0) {
c.addTitle("Alpha Division", "Arial Bold", 8);
c.setData(data0, labels);
int[] colors0 = {0xff3333, 0xff9999, 0xffcccc};
c.setColors2(Chart.DataColor, colors0);
} else if (chartIndex == 1) {
c.addTitle("Beta Division", "Arial Bold", 8);
c.setData(data1, labels);
int[] colors1 = {0x33ff33, 0x99ff99, 0xccffcc};
c.setColors2(Chart.DataColor, colors1);
} else {
c.addTitle("Gamma Division", "Arial Bold", 8);
c.setData(data2, labels);
int[] colors2 = {0x3333ff, 0x9999ff, 0xccccff};
c.setColors2(Chart.DataColor, colors2);
}
// Output the chart
viewer.Image = c.makeWebImage(Chart.SVG);
// Include tool tip for the chart
viewer.ImageMap = c.getHTMLImageMap("", "", "title='{label}: US${value}M ({percent}%)'");
}
//
// Page Load event handler
//
protected void Page_Load(object sender, EventArgs e)
{
createChart(WebChartViewer0, 0);
createChart(WebChartViewer1, 1);
createChart(WebChartViewer2, 2);
}
</script>
<html>
<head>
<script type="text/javascript" src="cdjcv.js"></script>
</head>
<body>
<chart:WebChartViewer id="WebChartViewer0" runat="server" />
<chart:WebChartViewer id="WebChartViewer1" runat="server" />
<chart:WebChartViewer id="WebChartViewer2" runat="server" />
</body>
</html>
[ASP.NET Web Forms - VB Version] NetWebCharts\VBNetASP\multipie.aspx
(Click here on how to convert this code to code-behind style.)<%@ Page Language="VB" Debug="true" %>
<%@ Import Namespace="ChartDirector" %>
<%@ Register TagPrefix="chart" Namespace="ChartDirector" Assembly="netchartdir" %>
<!DOCTYPE html>
<script runat="server">
'
' Create chart
'
Protected Sub createChart(viewer As WebChartViewer, chartIndex As Integer)
' The data for the pie chart
Dim data0() As Double = {25, 18, 15}
Dim data1() As Double = {14, 32, 24}
Dim data2() As Double = {25, 23, 9}
' The labels for the pie chart
Dim labels() As String = {"Software", "Hardware", "Services"}
' Create a PieChart object of size 180 x 160 pixels
Dim c As PieChart = New PieChart(180, 160)
' Set the center of the pie at (90, 80) and the radius to 60 pixels
c.setPieSize(90, 80, 60)
' Set the border color of the sectors to white (ffffff)
c.setLineColor(&Hffffff)
' Set the background color of the sector label to pale yellow (ffffc0) with a black border
' (000000)
c.setLabelStyle().setBackground(&Hffffc0, &H000000)
' Set the label to be slightly inside the perimeter of the circle
c.setLabelLayout(Chart.CircleLayout, -10)
' Set the title, data and colors according to which pie to draw
If chartIndex = 0 Then
c.addTitle("Alpha Division", "Arial Bold", 8)
c.setData(data0, labels)
Dim colors0() As Integer = {&Hff3333, &Hff9999, &Hffcccc}
c.setColors2(Chart.DataColor, colors0)
ElseIf chartIndex = 1 Then
c.addTitle("Beta Division", "Arial Bold", 8)
c.setData(data1, labels)
Dim colors1() As Integer = {&H33ff33, &H99ff99, &Hccffcc}
c.setColors2(Chart.DataColor, colors1)
Else
c.addTitle("Gamma Division", "Arial Bold", 8)
c.setData(data2, labels)
Dim colors2() As Integer = {&H3333ff, &H9999ff, &Hccccff}
c.setColors2(Chart.DataColor, colors2)
End If
' Output the chart
viewer.Image = c.makeWebImage(Chart.SVG)
' Include tool tip for the chart
viewer.ImageMap = c.getHTMLImageMap("", "", "title='{label}: US${value}M ({percent}%)'")
End Sub
'
' Page Load event handler
'
Protected Sub Page_Load(ByVal sender As System.Object, ByVal e As System.EventArgs)
createChart(WebChartViewer0, 0)
createChart(WebChartViewer1, 1)
createChart(WebChartViewer2, 2)
End Sub
</script>
<html>
<head>
<script type="text/javascript" src="cdjcv.js"></script>
</head>
<body>
<chart:WebChartViewer id="WebChartViewer0" runat="server" />
<chart:WebChartViewer id="WebChartViewer1" runat="server" />
<chart:WebChartViewer id="WebChartViewer2" runat="server" />
</body>
</html>
[ASP.NET MVC - Controller] NetMvcCharts\Controllers\MultipieController.cs
using System;
using System.Web.Mvc;
using ChartDirector;

namespace NetMvcCharts.Controllers
{
    public class MultipieController : Controller
    {
        //
        // Default Action
        //
        public ActionResult Index()
        {
            ViewBag.Title = "Multi-Pie Chart";

            // This example contains 3 charts.
            ViewBag.Viewer = new RazorChartViewer[3];
            for (int i = 0; i < ViewBag.Viewer.Length; ++i)
                createChart(ViewBag.Viewer[i] = new RazorChartViewer(HttpContext, "chart" + i), i);

            return View("~/Views/Shared/ChartView.cshtml");
        }

        //
        // Create chart
        //
        private void createChart(RazorChartViewer viewer, int chartIndex)
        {
            // The data for the pie chart
            double[] data0 = {25, 18, 15};
            double[] data1 = {14, 32, 24};
            double[] data2 = {25, 23, 9};

            // The labels for the pie chart
            string[] labels = {"Software", "Hardware", "Services"};

            // Create a PieChart object of size 180 x 160 pixels
            PieChart c = new PieChart(180, 160);

            // Set the center of the pie at (90, 80) and the radius to 60 pixels
            c.setPieSize(90, 80, 60);

            // Set the border color of the sectors to white (ffffff)
            c.setLineColor(0xffffff);

            // Set the background color of the sector label to pale yellow (ffffc0) with a black border
            // (000000)
            c.setLabelStyle().setBackground(0xffffc0, 0x000000);

            // Set the label to be slightly inside the perimeter of the circle
            c.setLabelLayout(Chart.CircleLayout, -10);

            // Set the title, data and colors according to which pie to draw
            if (chartIndex == 0) {
                c.addTitle("Alpha Division", "Arial Bold", 8);
                c.setData(data0, labels);
                int[] colors0 = {0xff3333, 0xff9999, 0xffcccc};
                c.setColors2(Chart.DataColor, colors0);
            } else if (chartIndex == 1) {
                c.addTitle("Beta Division", "Arial Bold", 8);
                c.setData(data1, labels);
                int[] colors1 = {0x33ff33, 0x99ff99, 0xccffcc};
                c.setColors2(Chart.DataColor, colors1);
            } else {
                c.addTitle("Gamma Division", "Arial Bold", 8);
                c.setData(data2, labels);
                int[] colors2 = {0x3333ff, 0x9999ff, 0xccccff};
                c.setColors2(Chart.DataColor, colors2);
            }

            // Output the chart
            viewer.Image = c.makeWebImage(Chart.SVG);

            // Include tool tip for the chart
            viewer.ImageMap = c.getHTMLImageMap("", "", "title='{label}: US${value}M ({percent}%)'");
        }
    }
}
[ASP.NET MVC - View] NetMvcCharts\Views\Shared\ChartView.cshtml
@{ Layout = null; }

<!DOCTYPE html>

<html>
<head>
    <meta name="viewport" content="width=device-width" />
    <title>@ViewBag.Title</title>
    <style>
        @ViewBag.Style
    </style>
    @Scripts.Render("~/Scripts/cdjcv.js")
</head>
<body style="margin:5px 0px 0px 5px">
    <div style="font:bold 18pt verdana;">
        @ViewBag.Title
    </div>
    <hr style="border:solid 1px #000080; background:#000080" />
    <div>
        @{
            if (ViewBag.Viewer is Array)
            {
                // Display multiple charts
                for (int i = 0; i < ViewBag.Viewer.Length; ++i)
                {
                    @:@Html.Raw(ViewBag.Viewer[i].RenderHTML())
                }
            }
            else
            {
                // Display one chart only
                @:@Html.Raw(ViewBag.Viewer.RenderHTML())
            }
        }
    </div>
</body>
</html>
© 2023 Advanced Software Engineering Limited. All rights reserved.