
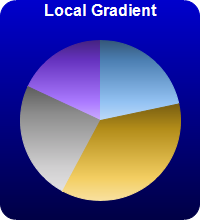
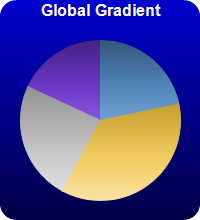
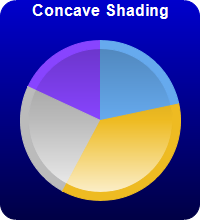
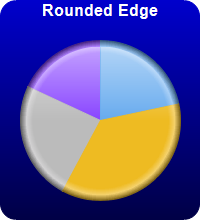
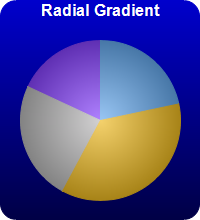
This example demonstrates various sector shading effects applicable to 2D pie charts.
ChartDirector 7.1 (.NET Edition)
2D Pie Shading
Source Code Listing
using System;
using ChartDirector;

namespace CSharpChartExplorer
{
    public class pieshading : DemoModule
    {
        //Name of demo module
        public string getName() { return "2D Pie Shading"; }

        //Number of charts produced in this demo module
        public int getNoOfCharts() { return 6; }

        //Main code for creating charts
        public void createChart(WinChartViewer viewer, int chartIndex)
        {
            // The data for the pie chart
            double[] data = {18, 30, 20, 15};

            // The labels for the pie chart
            string[] labels = {"Labor", "Licenses", "Facilities", "Production"};

            // The colors to use for the sectors
            int[] colors = {0x66aaee, 0xeebb22, 0xbbbbbb, 0x8844ff};

            // Create a PieChart object of size 200 x 220 pixels. Use a vertical gradient color from
            // blue (0000cc) to deep blue (000044) as background. Use rounded corners of 16 pixels
            // radius.
            PieChart c = new PieChart(200, 220);
            c.setBackground(c.linearGradientColor(0, 0, 0, c.getHeight(), 0x0000cc, 0x000044));
            c.setRoundedFrame(0xffffff, 16);

            // Set the center of the pie at (100, 120) and the radius to 80 pixels
            c.setPieSize(100, 120, 80);

            // Set the pie data
            c.setData(data, labels);

            // Set the sector colors
            c.setColors2(Chart.DataColor, colors);

            // Demonstrates various shading modes
            if (chartIndex == 0) {
                c.addTitle("Default Shading", "bold", 12, 0xffffff);
            } else if (chartIndex == 1) {
                c.addTitle("Local Gradient", "bold", 12, 0xffffff);
                c.setSectorStyle(Chart.LocalGradientShading);
            } else if (chartIndex == 2) {
                c.addTitle("Global Gradient", "bold", 12, 0xffffff);
                c.setSectorStyle(Chart.GlobalGradientShading);
            } else if (chartIndex == 3) {
                c.addTitle("Concave Shading", "bold", 12, 0xffffff);
                c.setSectorStyle(Chart.ConcaveShading);
            } else if (chartIndex == 4) {
                c.addTitle("Rounded Edge", "bold", 12, 0xffffff);
                c.setSectorStyle(Chart.RoundedEdgeShading);
            } else if (chartIndex == 5) {
                c.addTitle("Radial Gradient", "bold", 12, 0xffffff);
                c.setSectorStyle(Chart.RadialShading);
            }

            // Disable the sector labels by setting the color to Transparent
            c.setLabelStyle("", 8, Chart.Transparent);

            // Output the chart
            viewer.Chart = c;

            //include tool tip for the chart
            viewer.ImageMap = c.getHTMLImageMap("clickable", "",
                "title='{label}: US${value}K ({percent}%)'");
        }
    }
}Imports System
Imports Microsoft.VisualBasic
Imports ChartDirector
Public Class pieshading
Implements DemoModule
'Name of demo module
Public Function getName() As String Implements DemoModule.getName
Return "2D Pie Shading"
End Function
'Number of charts produced in this demo module
Public Function getNoOfCharts() As Integer Implements DemoModule.getNoOfCharts
Return 6
End Function
'Main code for creating charts
Public Sub createChart(viewer As WinChartViewer, chartIndex As Integer) _
Implements DemoModule.createChart
' The data for the pie chart
Dim data() As Double = {18, 30, 20, 15}
' The labels for the pie chart
Dim labels() As String = {"Labor", "Licenses", "Facilities", "Production"}
' The colors to use for the sectors
Dim colors() As Integer = {&H66aaee, &Heebb22, &Hbbbbbb, &H8844ff}
' Create a PieChart object of size 200 x 220 pixels. Use a vertical gradient color from blue
' (0000cc) to deep blue (000044) as background. Use rounded corners of 16 pixels radius.
Dim c As PieChart = New PieChart(200, 220)
c.setBackground(c.linearGradientColor(0, 0, 0, c.getHeight(), &H0000cc, &H000044))
c.setRoundedFrame(&Hffffff, 16)
' Set the center of the pie at (100, 120) and the radius to 80 pixels
c.setPieSize(100, 120, 80)
' Set the pie data
c.setData(data, labels)
' Set the sector colors
c.setColors2(Chart.DataColor, colors)
' Demonstrates various shading modes
If chartIndex = 0 Then
c.addTitle("Default Shading", "bold", 12, &Hffffff)
ElseIf chartIndex = 1 Then
c.addTitle("Local Gradient", "bold", 12, &Hffffff)
c.setSectorStyle(Chart.LocalGradientShading)
ElseIf chartIndex = 2 Then
c.addTitle("Global Gradient", "bold", 12, &Hffffff)
c.setSectorStyle(Chart.GlobalGradientShading)
ElseIf chartIndex = 3 Then
c.addTitle("Concave Shading", "bold", 12, &Hffffff)
c.setSectorStyle(Chart.ConcaveShading)
ElseIf chartIndex = 4 Then
c.addTitle("Rounded Edge", "bold", 12, &Hffffff)
c.setSectorStyle(Chart.RoundedEdgeShading)
ElseIf chartIndex = 5 Then
c.addTitle("Radial Gradient", "bold", 12, &Hffffff)
c.setSectorStyle(Chart.RadialShading)
End If
' Disable the sector labels by setting the color to Transparent
c.setLabelStyle("", 8, Chart.Transparent)
' Output the chart
viewer.Chart = c
'include tool tip for the chart
viewer.ImageMap = c.getHTMLImageMap("clickable", "", _
"title='{label}: US${value}K ({percent}%)'")
End Sub
End Classusing System;
using ChartDirector;
namespace CSharpWPFCharts
{
public class pieshading : DemoModule
{
//Name of demo module
public string getName() { return "2D Pie Shading"; }
//Number of charts produced in this demo module
public int getNoOfCharts() { return 6; }
//Main code for creating charts
public void createChart(WPFChartViewer viewer, int chartIndex)
{
// The data for the pie chart
double[] data = {18, 30, 20, 15};
// The labels for the pie chart
string[] labels = {"Labor", "Licenses", "Facilities", "Production"};
// The colors to use for the sectors
int[] colors = {0x66aaee, 0xeebb22, 0xbbbbbb, 0x8844ff};
// Create a PieChart object of size 200 x 220 pixels. Use a vertical gradient color from
// blue (0000cc) to deep blue (000044) as background. Use rounded corners of 16 pixels
// radius.
PieChart c = new PieChart(200, 220);
c.setBackground(c.linearGradientColor(0, 0, 0, c.getHeight(), 0x0000cc, 0x000044));
c.setRoundedFrame(0xffffff, 16);
// Set the center of the pie at (100, 120) and the radius to 80 pixels
c.setPieSize(100, 120, 80);
// Set the pie data
c.setData(data, labels);
// Set the sector colors
c.setColors2(Chart.DataColor, colors);
// Demonstrates various shading modes
if (chartIndex == 0) {
c.addTitle("Default Shading", "bold", 12, 0xffffff);
} else if (chartIndex == 1) {
c.addTitle("Local Gradient", "bold", 12, 0xffffff);
c.setSectorStyle(Chart.LocalGradientShading);
} else if (chartIndex == 2) {
c.addTitle("Global Gradient", "bold", 12, 0xffffff);
c.setSectorStyle(Chart.GlobalGradientShading);
} else if (chartIndex == 3) {
c.addTitle("Concave Shading", "bold", 12, 0xffffff);
c.setSectorStyle(Chart.ConcaveShading);
} else if (chartIndex == 4) {
c.addTitle("Rounded Edge", "bold", 12, 0xffffff);
c.setSectorStyle(Chart.RoundedEdgeShading);
} else if (chartIndex == 5) {
c.addTitle("Radial Gradient", "bold", 12, 0xffffff);
c.setSectorStyle(Chart.RadialShading);
}
// Disable the sector labels by setting the color to Transparent
c.setLabelStyle("", 8, Chart.Transparent);
// Output the chart
viewer.Chart = c;
//include tool tip for the chart
viewer.ImageMap = c.getHTMLImageMap("clickable", "",
"title='{label}: US${value}K ({percent}%)'");
}
}
}<%@ Page Language="C#" Debug="true" %>
<%@ Import Namespace="ChartDirector" %>
<%@ Register TagPrefix="chart" Namespace="ChartDirector" Assembly="netchartdir" %>
<!DOCTYPE html>
<script runat="server">
//
// Create chart
//
protected void createChart(WebChartViewer viewer, int chartIndex)
{
// The data for the pie chart
double[] data = {18, 30, 20, 15};
// The labels for the pie chart
string[] labels = {"Labor", "Licenses", "Facilities", "Production"};
// The colors to use for the sectors
int[] colors = {0x66aaee, 0xeebb22, 0xbbbbbb, 0x8844ff};
// Create a PieChart object of size 200 x 220 pixels. Use a vertical gradient color from blue
// (0000cc) to deep blue (000044) as background. Use rounded corners of 16 pixels radius.
PieChart c = new PieChart(200, 220);
c.setBackground(c.linearGradientColor(0, 0, 0, c.getHeight(), 0x0000cc, 0x000044));
c.setRoundedFrame(0xffffff, 16);
// Set the center of the pie at (100, 120) and the radius to 80 pixels
c.setPieSize(100, 120, 80);
// Set the pie data
c.setData(data, labels);
// Set the sector colors
c.setColors2(Chart.DataColor, colors);
// Demonstrates various shading modes
if (chartIndex == 0) {
c.addTitle("Default Shading", "bold", 12, 0xffffff);
} else if (chartIndex == 1) {
c.addTitle("Local Gradient", "bold", 12, 0xffffff);
c.setSectorStyle(Chart.LocalGradientShading);
} else if (chartIndex == 2) {
c.addTitle("Global Gradient", "bold", 12, 0xffffff);
c.setSectorStyle(Chart.GlobalGradientShading);
} else if (chartIndex == 3) {
c.addTitle("Concave Shading", "bold", 12, 0xffffff);
c.setSectorStyle(Chart.ConcaveShading);
} else if (chartIndex == 4) {
c.addTitle("Rounded Edge", "bold", 12, 0xffffff);
c.setSectorStyle(Chart.RoundedEdgeShading);
} else if (chartIndex == 5) {
c.addTitle("Radial Gradient", "bold", 12, 0xffffff);
c.setSectorStyle(Chart.RadialShading);
}
// Disable the sector labels by setting the color to Transparent
c.setLabelStyle("", 8, Chart.Transparent);
// Output the chart
viewer.Image = c.makeWebImage(Chart.SVG);
// Include tool tip for the chart
viewer.ImageMap = c.getHTMLImageMap("", "", "title='{label}: US${value}K ({percent}%)'");
}
//
// Page Load event handler
//
protected void Page_Load(object sender, EventArgs e)
{
createChart(WebChartViewer0, 0);
createChart(WebChartViewer1, 1);
createChart(WebChartViewer2, 2);
createChart(WebChartViewer3, 3);
createChart(WebChartViewer4, 4);
createChart(WebChartViewer5, 5);
}
</script>
<html>
<head>
<script type="text/javascript" src="cdjcv.js"></script>
</head>
<body>
<chart:WebChartViewer id="WebChartViewer0" runat="server" />
<chart:WebChartViewer id="WebChartViewer1" runat="server" />
<chart:WebChartViewer id="WebChartViewer2" runat="server" />
<chart:WebChartViewer id="WebChartViewer3" runat="server" />
<chart:WebChartViewer id="WebChartViewer4" runat="server" />
<chart:WebChartViewer id="WebChartViewer5" runat="server" />
</body>
</html><%@ Page Language="VB" Debug="true" %>
<%@ Import Namespace="ChartDirector" %>
<%@ Register TagPrefix="chart" Namespace="ChartDirector" Assembly="netchartdir" %>
<!DOCTYPE html>
<script runat="server">
'
' Create chart
'
Protected Sub createChart(viewer As WebChartViewer, chartIndex As Integer)
' The data for the pie chart
Dim data() As Double = {18, 30, 20, 15}
' The labels for the pie chart
Dim labels() As String = {"Labor", "Licenses", "Facilities", "Production"}
' The colors to use for the sectors
Dim colors() As Integer = {&H66aaee, &Heebb22, &Hbbbbbb, &H8844ff}
' Create a PieChart object of size 200 x 220 pixels. Use a vertical gradient color from blue
' (0000cc) to deep blue (000044) as background. Use rounded corners of 16 pixels radius.
Dim c As PieChart = New PieChart(200, 220)
c.setBackground(c.linearGradientColor(0, 0, 0, c.getHeight(), &H0000cc, &H000044))
c.setRoundedFrame(&Hffffff, 16)
' Set the center of the pie at (100, 120) and the radius to 80 pixels
c.setPieSize(100, 120, 80)
' Set the pie data
c.setData(data, labels)
' Set the sector colors
c.setColors2(Chart.DataColor, colors)
' Demonstrates various shading modes
If chartIndex = 0 Then
c.addTitle("Default Shading", "bold", 12, &Hffffff)
ElseIf chartIndex = 1 Then
c.addTitle("Local Gradient", "bold", 12, &Hffffff)
c.setSectorStyle(Chart.LocalGradientShading)
ElseIf chartIndex = 2 Then
c.addTitle("Global Gradient", "bold", 12, &Hffffff)
c.setSectorStyle(Chart.GlobalGradientShading)
ElseIf chartIndex = 3 Then
c.addTitle("Concave Shading", "bold", 12, &Hffffff)
c.setSectorStyle(Chart.ConcaveShading)
ElseIf chartIndex = 4 Then
c.addTitle("Rounded Edge", "bold", 12, &Hffffff)
c.setSectorStyle(Chart.RoundedEdgeShading)
ElseIf chartIndex = 5 Then
c.addTitle("Radial Gradient", "bold", 12, &Hffffff)
c.setSectorStyle(Chart.RadialShading)
End If
' Disable the sector labels by setting the color to Transparent
c.setLabelStyle("", 8, Chart.Transparent)
' Output the chart
viewer.Image = c.makeWebImage(Chart.SVG)
' Include tool tip for the chart
viewer.ImageMap = c.getHTMLImageMap("", "", "title='{label}: US${value}K ({percent}%)'")
End Sub
'
' Page Load event handler
'
Protected Sub Page_Load(ByVal sender As System.Object, ByVal e As System.EventArgs)
createChart(WebChartViewer0, 0)
createChart(WebChartViewer1, 1)
createChart(WebChartViewer2, 2)
createChart(WebChartViewer3, 3)
createChart(WebChartViewer4, 4)
createChart(WebChartViewer5, 5)
End Sub
</script>
<html>
<head>
<script type="text/javascript" src="cdjcv.js"></script>
</head>
<body>
<chart:WebChartViewer id="WebChartViewer0" runat="server" />
<chart:WebChartViewer id="WebChartViewer1" runat="server" />
<chart:WebChartViewer id="WebChartViewer2" runat="server" />
<chart:WebChartViewer id="WebChartViewer3" runat="server" />
<chart:WebChartViewer id="WebChartViewer4" runat="server" />
<chart:WebChartViewer id="WebChartViewer5" runat="server" />
</body>
</html>using System;
using System.Web.Mvc;
using ChartDirector;
namespace NetMvcCharts.Controllers
{
public class PieshadingController : Controller
{
//
// Default Action
//
public ActionResult Index()
{
ViewBag.Title = "2D Pie Shading";
// This example contains 6 charts.
ViewBag.Viewer = new RazorChartViewer[6];
for (int i = 0; i < ViewBag.Viewer.Length; ++i)
createChart(ViewBag.Viewer[i] = new RazorChartViewer(HttpContext, "chart" + i), i);
return View("~/Views/Shared/ChartView.cshtml");
}
//
// Create chart
//
private void createChart(RazorChartViewer viewer, int chartIndex)
{
// The data for the pie chart
double[] data = {18, 30, 20, 15};
// The labels for the pie chart
string[] labels = {"Labor", "Licenses", "Facilities", "Production"};
// The colors to use for the sectors
int[] colors = {0x66aaee, 0xeebb22, 0xbbbbbb, 0x8844ff};
// Create a PieChart object of size 200 x 220 pixels. Use a vertical gradient color from blue
// (0000cc) to deep blue (000044) as background. Use rounded corners of 16 pixels radius.
PieChart c = new PieChart(200, 220);
c.setBackground(c.linearGradientColor(0, 0, 0, c.getHeight(), 0x0000cc, 0x000044));
c.setRoundedFrame(0xffffff, 16);
// Set the center of the pie at (100, 120) and the radius to 80 pixels
c.setPieSize(100, 120, 80);
// Set the pie data
c.setData(data, labels);
// Set the sector colors
c.setColors2(Chart.DataColor, colors);
// Demonstrates various shading modes
if (chartIndex == 0) {
c.addTitle("Default Shading", "bold", 12, 0xffffff);
} else if (chartIndex == 1) {
c.addTitle("Local Gradient", "bold", 12, 0xffffff);
c.setSectorStyle(Chart.LocalGradientShading);
} else if (chartIndex == 2) {
c.addTitle("Global Gradient", "bold", 12, 0xffffff);
c.setSectorStyle(Chart.GlobalGradientShading);
} else if (chartIndex == 3) {
c.addTitle("Concave Shading", "bold", 12, 0xffffff);
c.setSectorStyle(Chart.ConcaveShading);
} else if (chartIndex == 4) {
c.addTitle("Rounded Edge", "bold", 12, 0xffffff);
c.setSectorStyle(Chart.RoundedEdgeShading);
} else if (chartIndex == 5) {
c.addTitle("Radial Gradient", "bold", 12, 0xffffff);
c.setSectorStyle(Chart.RadialShading);
}
// Disable the sector labels by setting the color to Transparent
c.setLabelStyle("", 8, Chart.Transparent);
// Output the chart
viewer.Image = c.makeWebImage(Chart.SVG);
// Include tool tip for the chart
viewer.ImageMap = c.getHTMLImageMap("", "", "title='{label}: US${value}K ({percent}%)'");
}
}
}@{ Layout = null; }
<!DOCTYPE html>
<html>
<head>
<meta name="viewport" content="width=device-width" />
<title>@ViewBag.Title</title>
<style>
@ViewBag.Style
</style>
@Scripts.Render("~/Scripts/cdjcv.js")
</head>
<body style="margin:5px 0px 0px 5px">
<div style="font:bold 18pt verdana;">
@ViewBag.Title
</div>
<hr style="border:solid 1px #000080; background:#000080" />
<div>
@{
if (ViewBag.Viewer is Array)
{
// Display multiple charts
for (int i = 0; i < ViewBag.Viewer.Length; ++i)
{
@:@Html.Raw(ViewBag.Viewer[i].RenderHTML())
}
}
else
{
// Display one chart only
@:@Html.Raw(ViewBag.Viewer.RenderHTML())
}
}
</div>
</body>
</html>