[Windows Forms - C# version] NetWinCharts\CSharpWinCharts\polygonbar.cs
using System;
using ChartDirector;
namespace CSharpChartExplorer
{
public class polygonbar : DemoModule
{
//Name of demo module
public string getName() { return "Polygon Bar Shapes"; }
//Number of charts produced in this demo module
public int getNoOfCharts() { return 1; }
//Main code for creating chart.
//Note: the argument chartIndex is unused because this demo only has 1 chart.
public void createChart(WinChartViewer viewer, int chartIndex)
{
// The data for the bar chart
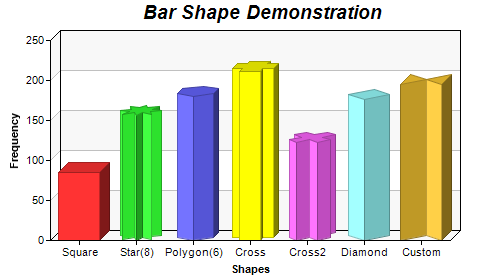
double[] data = {85, 156, 179.5, 211, 123, 176, 195};
// The labels for the bar chart
string[] labels = {"Square", "Star(8)", "Polygon(6)", "Cross", "Cross2", "Diamond",
"Custom"};
// Create a XYChart object of size 500 x 280 pixels.
XYChart c = new XYChart(500, 280);
// Set the plotarea at (50, 40) with alternating light grey (f8f8f8) / white (ffffff)
// background
c.setPlotArea(50, 40, 400, 200, 0xf8f8f8, 0xffffff);
// Add a title to the chart using 14pt Arial Bold Italic font
c.addTitle(" Bar Shape Demonstration", "Arial Bold Italic", 14);
// Add a multi-color bar chart layer
BarLayer layer = c.addBarLayer3(data);
// Set layer to 3D with 10 pixels 3D depth
layer.set3D(10);
// Set bar shape to circular (cylinder)
layer.setBarShape(Chart.CircleShape);
// Set the first bar (index = 0) to square shape
layer.setBarShape(Chart.SquareShape, 0, 0);
// Set the second bar to 8-pointed star
layer.setBarShape(Chart.StarShape(8), 0, 1);
// Set the third bar to 6-sided polygon
layer.setBarShape(Chart.PolygonShape(6), 0, 2);
// Set the next 3 bars to cross shape, X shape and diamond shape
layer.setBarShape(Chart.CrossShape(), 0, 3);
layer.setBarShape(Chart.Cross2Shape(), 0, 4);
layer.setBarShape(Chart.DiamondShape, 0, 5);
// Set the last bar to a custom shape, specified as an array of (x, y) points in
// normalized coordinates
int[] customShape = {-500, 0, 0, 500, 500, 0, 500, 1000, 0, 500, -500, 1000};
layer.setBarShape2(customShape, 0, 6);
// Set the labels on the x axis.
c.xAxis().setLabels(labels);
// Add a title to the y axis
c.yAxis().setTitle("Frequency");
// Add a title to the x axis
c.xAxis().setTitle("Shapes");
// Output the chart
viewer.Chart = c;
//include tool tip for the chart
viewer.ImageMap = c.getHTMLImageMap("clickable", "", "title='{xLabel}: {value}'");
}
}
}
[Windows Forms - VB Version] NetWinCharts\VBNetWinCharts\polygonbar.vb
Imports System
Imports Microsoft.VisualBasic
Imports ChartDirector

Public Class polygonbar
    Implements DemoModule

    'Name of demo module
    Public Function getName() As String Implements DemoModule.getName
        Return "Polygon Bar Shapes"
    End Function

    'Number of charts produced in this demo module
    Public Function getNoOfCharts() As Integer Implements DemoModule.getNoOfCharts
        Return 1
    End Function

    'Main code for creating chart.
    'Note: the argument chartIndex is unused because this demo only has 1 chart.
    Public Sub createChart(viewer As WinChartViewer, chartIndex As Integer) _
        Implements DemoModule.createChart

        ' The data for the bar chart
        Dim data() As Double = {85, 156, 179.5, 211, 123, 176, 195}

        ' The labels for the bar chart
        Dim labels() As String = {"Square", "Star(8)", "Polygon(6)", "Cross", "Cross2", "Diamond", _
            "Custom"}

        ' Create a XYChart object of size 500 x 280 pixels.
        Dim c As XYChart = New XYChart(500, 280)

        ' Set the plotarea at (50, 40) with alternating light grey (f8f8f8) / white (ffffff)
        ' background
        c.setPlotArea(50, 40, 400, 200, &Hf8f8f8, &Hffffff)

        ' Add a title to the chart using 14pt Arial Bold Italic font
        c.addTitle("    Bar Shape Demonstration", "Arial Bold Italic", 14)

        ' Add a multi-color bar chart layer
        Dim layer As BarLayer = c.addBarLayer3(data)

        ' Set layer to 3D with 10 pixels 3D depth
        layer.set3D(10)

        ' Set bar shape to circular (cylinder)
        layer.setBarShape(Chart.CircleShape)

        ' Set the first bar (index = 0) to square shape
        layer.setBarShape(Chart.SquareShape, 0, 0)

        ' Set the second bar to 8-pointed star
        layer.setBarShape(Chart.StarShape(8), 0, 1)

        ' Set the third bar to 6-sided polygon
        layer.setBarShape(Chart.PolygonShape(6), 0, 2)

        ' Set the next 3 bars to cross shape, X shape and diamond shape
        layer.setBarShape(Chart.CrossShape(), 0, 3)
        layer.setBarShape(Chart.Cross2Shape(), 0, 4)
        layer.setBarShape(Chart.DiamondShape, 0, 5)

        ' Set the last bar to a custom shape, specified as an array of (x, y) points in normalized
        ' coordinates
        Dim customShape() As Integer = {-500, 0, 0, 500, 500, 0, 500, 1000, 0, 500, -500, 1000}
        layer.setBarShape2(customShape, 0, 6)

        ' Set the labels on the x axis.
        c.xAxis().setLabels(labels)

        ' Add a title to the y axis
        c.yAxis().setTitle("Frequency")

        ' Add a title to the x axis
        c.xAxis().setTitle("Shapes")

        ' Output the chart
        viewer.Chart = c

        'include tool tip for the chart
        viewer.ImageMap = c.getHTMLImageMap("clickable", "", "title='{xLabel}: {value}'")

    End Sub

End Class
[WPF - C#] NetWPFCharts\CSharpWPFCharts\polygonbar.cs
using System;
using ChartDirector;

namespace CSharpWPFCharts
{
    public class polygonbar : DemoModule
    {
        //Name of demo module
        public string getName() { return "Polygon Bar Shapes"; }

        //Number of charts produced in this demo module
        public int getNoOfCharts() { return 1; }

        //Main code for creating chart.
        //Note: the argument chartIndex is unused because this demo only has 1 chart.
        public void createChart(WPFChartViewer viewer, int chartIndex)
        {
            // The data for the bar chart
            double[] data = {85, 156, 179.5, 211, 123, 176, 195};

            // The labels for the bar chart
            string[] labels = {"Square", "Star(8)", "Polygon(6)", "Cross", "Cross2", "Diamond",
                "Custom"};

            // Create a XYChart object of size 500 x 280 pixels.
            XYChart c = new XYChart(500, 280);

            // Set the plotarea at (50, 40) with alternating light grey (f8f8f8) / white (ffffff)
            // background
            c.setPlotArea(50, 40, 400, 200, 0xf8f8f8, 0xffffff);

            // Add a title to the chart using 14pt Arial Bold Italic font
            c.addTitle("    Bar Shape Demonstration", "Arial Bold Italic", 14);

            // Add a multi-color bar chart layer
            BarLayer layer = c.addBarLayer3(data);

            // Set layer to 3D with 10 pixels 3D depth
            layer.set3D(10);

            // Set bar shape to circular (cylinder)
            layer.setBarShape(Chart.CircleShape);

            // Set the first bar (index = 0) to square shape
            layer.setBarShape(Chart.SquareShape, 0, 0);

            // Set the second bar to 8-pointed star
            layer.setBarShape(Chart.StarShape(8), 0, 1);

            // Set the third bar to 6-sided polygon
            layer.setBarShape(Chart.PolygonShape(6), 0, 2);

            // Set the next 3 bars to cross shape, X shape and diamond shape
            layer.setBarShape(Chart.CrossShape(), 0, 3);
            layer.setBarShape(Chart.Cross2Shape(), 0, 4);
            layer.setBarShape(Chart.DiamondShape, 0, 5);

            // Set the last bar to a custom shape, specified as an array of (x, y) points in
            // normalized coordinates
            int[] customShape = {-500, 0, 0, 500, 500, 0, 500, 1000, 0, 500, -500, 1000};
            layer.setBarShape2(customShape, 0, 6);

            // Set the labels on the x axis.
            c.xAxis().setLabels(labels);

            // Add a title to the y axis
            c.yAxis().setTitle("Frequency");

            // Add a title to the x axis
            c.xAxis().setTitle("Shapes");

            // Output the chart
            viewer.Chart = c;

            //include tool tip for the chart
            viewer.ImageMap = c.getHTMLImageMap("clickable", "", "title='{xLabel}: {value}'");
        }
    }
}
[ASP.NET Web Forms - C# version] NetWebCharts\CSharpASP\polygonbar.aspx
(Click here on how to convert this code to code-behind style.)<%@ Page Language="C#" Debug="true" %>
<%@ Import Namespace="ChartDirector" %>
<%@ Register TagPrefix="chart" Namespace="ChartDirector" Assembly="netchartdir" %>
<!DOCTYPE html>
<script runat="server">
//
// Page Load event handler
//
protected void Page_Load(object sender, EventArgs e)
{
// The data for the bar chart
double[] data = {85, 156, 179.5, 211, 123, 176, 195};
// The labels for the bar chart
string[] labels = {"Square", "Star(8)", "Polygon(6)", "Cross", "Cross2", "Diamond", "Custom"};
// Create a XYChart object of size 500 x 280 pixels.
XYChart c = new XYChart(500, 280);
// Set the plotarea at (50, 40) with alternating light grey (f8f8f8) / white (ffffff) background
c.setPlotArea(50, 40, 400, 200, 0xf8f8f8, 0xffffff);
// Add a title to the chart using 14pt Arial Bold Italic font
c.addTitle(" Bar Shape Demonstration", "Arial Bold Italic", 14);
// Add a multi-color bar chart layer
BarLayer layer = c.addBarLayer3(data);
// Set layer to 3D with 10 pixels 3D depth
layer.set3D(10);
// Set bar shape to circular (cylinder)
layer.setBarShape(Chart.CircleShape);
// Set the first bar (index = 0) to square shape
layer.setBarShape(Chart.SquareShape, 0, 0);
// Set the second bar to 8-pointed star
layer.setBarShape(Chart.StarShape(8), 0, 1);
// Set the third bar to 6-sided polygon
layer.setBarShape(Chart.PolygonShape(6), 0, 2);
// Set the next 3 bars to cross shape, X shape and diamond shape
layer.setBarShape(Chart.CrossShape(), 0, 3);
layer.setBarShape(Chart.Cross2Shape(), 0, 4);
layer.setBarShape(Chart.DiamondShape, 0, 5);
// Set the last bar to a custom shape, specified as an array of (x, y) points in normalized
// coordinates
int[] customShape = {-500, 0, 0, 500, 500, 0, 500, 1000, 0, 500, -500, 1000};
layer.setBarShape2(customShape, 0, 6);
// Set the labels on the x axis.
c.xAxis().setLabels(labels);
// Add a title to the y axis
c.yAxis().setTitle("Frequency");
// Add a title to the x axis
c.xAxis().setTitle("Shapes");
// Output the chart
WebChartViewer1.Image = c.makeWebImage(Chart.SVG);
// Include tool tip for the chart
WebChartViewer1.ImageMap = c.getHTMLImageMap("", "", "title='{xLabel}: {value}'");
}
</script>
<html>
<head>
<script type="text/javascript" src="cdjcv.js"></script>
</head>
<body>
<chart:WebChartViewer id="WebChartViewer1" runat="server" />
</body>
</html>
[ASP.NET Web Forms - VB Version] NetWebCharts\VBNetASP\polygonbar.aspx
(Click here on how to convert this code to code-behind style.)<%@ Page Language="VB" Debug="true" %>
<%@ Import Namespace="ChartDirector" %>
<%@ Register TagPrefix="chart" Namespace="ChartDirector" Assembly="netchartdir" %>
<!DOCTYPE html>
<script runat="server">
'
' Page Load event handler
'
Protected Sub Page_Load(ByVal sender As System.Object, ByVal e As System.EventArgs)
' The data for the bar chart
Dim data() As Double = {85, 156, 179.5, 211, 123, 176, 195}
' The labels for the bar chart
Dim labels() As String = {"Square", "Star(8)", "Polygon(6)", "Cross", "Cross2", "Diamond", _
"Custom"}
' Create a XYChart object of size 500 x 280 pixels.
Dim c As XYChart = New XYChart(500, 280)
' Set the plotarea at (50, 40) with alternating light grey (f8f8f8) / white (ffffff) background
c.setPlotArea(50, 40, 400, 200, &Hf8f8f8, &Hffffff)
' Add a title to the chart using 14pt Arial Bold Italic font
c.addTitle(" Bar Shape Demonstration", "Arial Bold Italic", 14)
' Add a multi-color bar chart layer
Dim layer As BarLayer = c.addBarLayer3(data)
' Set layer to 3D with 10 pixels 3D depth
layer.set3D(10)
' Set bar shape to circular (cylinder)
layer.setBarShape(Chart.CircleShape)
' Set the first bar (index = 0) to square shape
layer.setBarShape(Chart.SquareShape, 0, 0)
' Set the second bar to 8-pointed star
layer.setBarShape(Chart.StarShape(8), 0, 1)
' Set the third bar to 6-sided polygon
layer.setBarShape(Chart.PolygonShape(6), 0, 2)
' Set the next 3 bars to cross shape, X shape and diamond shape
layer.setBarShape(Chart.CrossShape(), 0, 3)
layer.setBarShape(Chart.Cross2Shape(), 0, 4)
layer.setBarShape(Chart.DiamondShape, 0, 5)
' Set the last bar to a custom shape, specified as an array of (x, y) points in normalized
' coordinates
Dim customShape() As Integer = {-500, 0, 0, 500, 500, 0, 500, 1000, 0, 500, -500, 1000}
layer.setBarShape2(customShape, 0, 6)
' Set the labels on the x axis.
c.xAxis().setLabels(labels)
' Add a title to the y axis
c.yAxis().setTitle("Frequency")
' Add a title to the x axis
c.xAxis().setTitle("Shapes")
' Output the chart
WebChartViewer1.Image = c.makeWebImage(Chart.SVG)
' Include tool tip for the chart
WebChartViewer1.ImageMap = c.getHTMLImageMap("", "", "title='{xLabel}: {value}'")
End Sub
</script>
<html>
<head>
<script type="text/javascript" src="cdjcv.js"></script>
</head>
<body>
<chart:WebChartViewer id="WebChartViewer1" runat="server" />
</body>
</html>
[ASP.NET MVC - Controller] NetMvcCharts\Controllers\PolygonbarController.cs
using System;
using System.Web.Mvc;
using ChartDirector;

namespace NetMvcCharts.Controllers
{
    public class PolygonbarController : Controller
    {
        //
        // Default Action
        //
        public ActionResult Index()
        {
            ViewBag.Title = "Polygon Bar Shapes";
            createChart(ViewBag.Viewer = new RazorChartViewer(HttpContext, "chart1"));
            return View("~/Views/Shared/ChartView.cshtml");
        }

        //
        // Create chart
        //
        private void createChart(RazorChartViewer viewer)
        {
            // The data for the bar chart
            double[] data = {85, 156, 179.5, 211, 123, 176, 195};

            // The labels for the bar chart
            string[] labels = {"Square", "Star(8)", "Polygon(6)", "Cross", "Cross2", "Diamond", "Custom"}
                ;

            // Create a XYChart object of size 500 x 280 pixels.
            XYChart c = new XYChart(500, 280);

            // Set the plotarea at (50, 40) with alternating light grey (f8f8f8) / white (ffffff)
            // background
            c.setPlotArea(50, 40, 400, 200, 0xf8f8f8, 0xffffff);

            // Add a title to the chart using 14pt Arial Bold Italic font
            c.addTitle("    Bar Shape Demonstration", "Arial Bold Italic", 14);

            // Add a multi-color bar chart layer
            BarLayer layer = c.addBarLayer3(data);

            // Set layer to 3D with 10 pixels 3D depth
            layer.set3D(10);

            // Set bar shape to circular (cylinder)
            layer.setBarShape(Chart.CircleShape);

            // Set the first bar (index = 0) to square shape
            layer.setBarShape(Chart.SquareShape, 0, 0);

            // Set the second bar to 8-pointed star
            layer.setBarShape(Chart.StarShape(8), 0, 1);

            // Set the third bar to 6-sided polygon
            layer.setBarShape(Chart.PolygonShape(6), 0, 2);

            // Set the next 3 bars to cross shape, X shape and diamond shape
            layer.setBarShape(Chart.CrossShape(), 0, 3);
            layer.setBarShape(Chart.Cross2Shape(), 0, 4);
            layer.setBarShape(Chart.DiamondShape, 0, 5);

            // Set the last bar to a custom shape, specified as an array of (x, y) points in normalized
            // coordinates
            int[] customShape = {-500, 0, 0, 500, 500, 0, 500, 1000, 0, 500, -500, 1000};
            layer.setBarShape2(customShape, 0, 6);

            // Set the labels on the x axis.
            c.xAxis().setLabels(labels);

            // Add a title to the y axis
            c.yAxis().setTitle("Frequency");

            // Add a title to the x axis
            c.xAxis().setTitle("Shapes");

            // Output the chart
            viewer.Image = c.makeWebImage(Chart.SVG);

            // Include tool tip for the chart
            viewer.ImageMap = c.getHTMLImageMap("", "", "title='{xLabel}: {value}'");
        }
    }
}
[ASP.NET MVC - View] NetMvcCharts\Views\Shared\ChartView.cshtml
@{ Layout = null; }

<!DOCTYPE html>

<html>
<head>
    <meta name="viewport" content="width=device-width" />
    <title>@ViewBag.Title</title>
    <style>
        @ViewBag.Style
    </style>
    @Scripts.Render("~/Scripts/cdjcv.js")
</head>
<body style="margin:5px 0px 0px 5px">
    <div style="font:bold 18pt verdana;">
        @ViewBag.Title
    </div>
    <hr style="border:solid 1px #000080; background:#000080" />
    <div>
        @{
            if (ViewBag.Viewer is Array)
            {
                // Display multiple charts
                for (int i = 0; i < ViewBag.Viewer.Length; ++i)
                {
                    @:@Html.Raw(ViewBag.Viewer[i].RenderHTML())
                }
            }
            else
            {
                // Display one chart only
                @:@Html.Raw(ViewBag.Viewer.RenderHTML())
            }
        }
    </div>
</body>
</html>
© 2023 Advanced Software Engineering Limited. All rights reserved.