[Windows Forms - C# version] NetWinCharts\CSharpWinCharts\posnegbar.cs
using System;
using ChartDirector;
namespace CSharpChartExplorer
{
public class posnegbar : DemoModule
{
//Name of demo module
public string getName() { return "Positive Negative Bars"; }
//Number of charts produced in this demo module
public int getNoOfCharts() { return 1; }
//Main code for creating chart.
//Note: the argument chartIndex is unused because this demo only has 1 chart.
public void createChart(WinChartViewer viewer, int chartIndex)
{
// The data for the bar chart
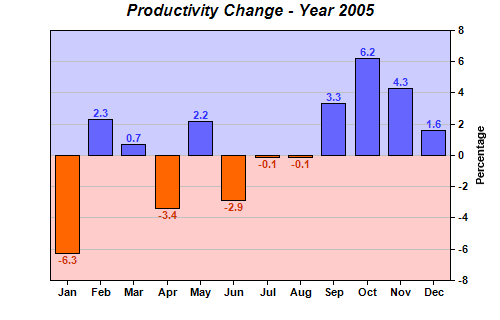
double[] data = {-6.3, 2.3, 0.7, -3.4, 2.2, -2.9, -0.1, -0.1, 3.3, 6.2, 4.3, 1.6};
// The labels for the bar chart
string[] labels = {"Jan", "Feb", "Mar", "Apr", "May", "Jun", "Jul", "Aug", "Sep", "Oct",
"Nov", "Dec"};
// Create a XYChart object of size 500 x 320 pixels
XYChart c = new XYChart(500, 320);
// Add a title to the chart using Arial Bold Italic font
c.addTitle("Productivity Change - Year 2005", "Arial Bold Italic");
// Set the plotarea at (50, 30) and of size 400 x 250 pixels
c.setPlotArea(50, 30, 400, 250);
// Add a bar layer to the chart using the Overlay data combine method
BarLayer layer = c.addBarLayer2(Chart.Overlay);
// Select positive data and add it as data set with blue (6666ff) color
layer.addDataSet(new ArrayMath(data).selectGEZ(null, Chart.NoValue).result(), 0x6666ff);
// Select negative data and add it as data set with orange (ff6600) color
layer.addDataSet(new ArrayMath(data).selectLTZ(null, Chart.NoValue).result(), 0xff6600);
// Add labels to the top of the bar using 8 pt Arial Bold font. The font color is
// configured to be red (0xcc3300) below zero, and blue (0x3333ff) above zero.
layer.setAggregateLabelStyle("Arial Bold", 8, layer.yZoneColor(0, 0xcc3300, 0x3333ff));
// Set the labels on the x axis and use Arial Bold as the label font
c.xAxis().setLabels(labels).setFontStyle("Arial Bold");
// Draw the y axis on the right of the plot area
c.setYAxisOnRight(true);
// Use Arial Bold as the y axis label font
c.yAxis().setLabelStyle("Arial Bold");
// Add a title to the y axis
c.yAxis().setTitle("Percentage");
// Add a light blue (0xccccff) zone for positive part of the plot area
c.yAxis().addZone(0, 9999, 0xccccff);
// Add a pink (0xffffcc) zone for negative part of the plot area
c.yAxis().addZone(-9999, 0, 0xffcccc);
// Output the chart
viewer.Chart = c;
//include tool tip for the chart
viewer.ImageMap = c.getHTMLImageMap("clickable", "", "title='{xLabel}: {value}%'");
}
}
}
[Windows Forms - VB Version] NetWinCharts\VBNetWinCharts\posnegbar.vb
Imports System
Imports Microsoft.VisualBasic
Imports ChartDirector

Public Class posnegbar
    Implements DemoModule

    'Name of demo module
    Public Function getName() As String Implements DemoModule.getName
        Return "Positive Negative Bars"
    End Function

    'Number of charts produced in this demo module
    Public Function getNoOfCharts() As Integer Implements DemoModule.getNoOfCharts
        Return 1
    End Function

    'Main code for creating chart.
    'Note: the argument chartIndex is unused because this demo only has 1 chart.
    Public Sub createChart(viewer As WinChartViewer, chartIndex As Integer) _
        Implements DemoModule.createChart

        ' The data for the bar chart
        Dim data() As Double = {-6.3, 2.3, 0.7, -3.4, 2.2, -2.9, -0.1, -0.1, 3.3, 6.2, 4.3, 1.6}

        ' The labels for the bar chart
        Dim labels() As String = {"Jan", "Feb", "Mar", "Apr", "May", "Jun", "Jul", "Aug", "Sep", _
            "Oct", "Nov", "Dec"}

        ' Create a XYChart object of size 500 x 320 pixels
        Dim c As XYChart = New XYChart(500, 320)

        ' Add a title to the chart using Arial Bold Italic font
        c.addTitle("Productivity Change - Year 2005", "Arial Bold Italic")

        ' Set the plotarea at (50, 30) and of size 400 x 250 pixels
        c.setPlotArea(50, 30, 400, 250)

        ' Add a bar layer to the chart using the Overlay data combine method
        Dim layer As BarLayer = c.addBarLayer2(Chart.Overlay)

        ' Select positive data and add it as data set with blue (6666ff) color
        layer.addDataSet(New ArrayMath(data).selectGEZ(Nothing, Chart.NoValue).result(), &H6666ff)

        ' Select negative data and add it as data set with orange (ff6600) color
        layer.addDataSet(New ArrayMath(data).selectLTZ(Nothing, Chart.NoValue).result(), &Hff6600)

        ' Add labels to the top of the bar using 8 pt Arial Bold font. The font color is configured
        ' to be red (0xcc3300) below zero, and blue (0x3333ff) above zero.
        layer.setAggregateLabelStyle("Arial Bold", 8, layer.yZoneColor(0, &Hcc3300, &H3333ff))

        ' Set the labels on the x axis and use Arial Bold as the label font
        c.xAxis().setLabels(labels).setFontStyle("Arial Bold")

        ' Draw the y axis on the right of the plot area
        c.setYAxisOnRight(True)

        ' Use Arial Bold as the y axis label font
        c.yAxis().setLabelStyle("Arial Bold")

        ' Add a title to the y axis
        c.yAxis().setTitle("Percentage")

        ' Add a light blue (0xccccff) zone for positive part of the plot area
        c.yAxis().addZone(0, 9999, &Hccccff)

        ' Add a pink (0xffffcc) zone for negative part of the plot area
        c.yAxis().addZone(-9999, 0, &Hffcccc)

        ' Output the chart
        viewer.Chart = c

        'include tool tip for the chart
        viewer.ImageMap = c.getHTMLImageMap("clickable", "", "title='{xLabel}: {value}%'")

    End Sub

End Class
[WPF - C#] NetWPFCharts\CSharpWPFCharts\posnegbar.cs
using System;
using ChartDirector;

namespace CSharpWPFCharts
{
    public class posnegbar : DemoModule
    {
        //Name of demo module
        public string getName() { return "Positive Negative Bars"; }

        //Number of charts produced in this demo module
        public int getNoOfCharts() { return 1; }

        //Main code for creating chart.
        //Note: the argument chartIndex is unused because this demo only has 1 chart.
        public void createChart(WPFChartViewer viewer, int chartIndex)
        {
            // The data for the bar chart
            double[] data = {-6.3, 2.3, 0.7, -3.4, 2.2, -2.9, -0.1, -0.1, 3.3, 6.2, 4.3, 1.6};

            // The labels for the bar chart
            string[] labels = {"Jan", "Feb", "Mar", "Apr", "May", "Jun", "Jul", "Aug", "Sep", "Oct",
                "Nov", "Dec"};

            // Create a XYChart object of size 500 x 320 pixels
            XYChart c = new XYChart(500, 320);

            // Add a title to the chart using Arial Bold Italic font
            c.addTitle("Productivity Change - Year 2005", "Arial Bold Italic");

            // Set the plotarea at (50, 30) and of size 400 x 250 pixels
            c.setPlotArea(50, 30, 400, 250);

            // Add a bar layer to the chart using the Overlay data combine method
            BarLayer layer = c.addBarLayer2(Chart.Overlay);

            // Select positive data and add it as data set with blue (6666ff) color
            layer.addDataSet(new ArrayMath(data).selectGEZ(null, Chart.NoValue).result(), 0x6666ff);

            // Select negative data and add it as data set with orange (ff6600) color
            layer.addDataSet(new ArrayMath(data).selectLTZ(null, Chart.NoValue).result(), 0xff6600);

            // Add labels to the top of the bar using 8 pt Arial Bold font. The font color is
            // configured to be red (0xcc3300) below zero, and blue (0x3333ff) above zero.
            layer.setAggregateLabelStyle("Arial Bold", 8, layer.yZoneColor(0, 0xcc3300, 0x3333ff));

            // Set the labels on the x axis and use Arial Bold as the label font
            c.xAxis().setLabels(labels).setFontStyle("Arial Bold");

            // Draw the y axis on the right of the plot area
            c.setYAxisOnRight(true);

            // Use Arial Bold as the y axis label font
            c.yAxis().setLabelStyle("Arial Bold");

            // Add a title to the y axis
            c.yAxis().setTitle("Percentage");

            // Add a light blue (0xccccff) zone for positive part of the plot area
            c.yAxis().addZone(0, 9999, 0xccccff);

            // Add a pink (0xffffcc) zone for negative part of the plot area
            c.yAxis().addZone(-9999, 0, 0xffcccc);

            // Output the chart
            viewer.Chart = c;

            //include tool tip for the chart
            viewer.ImageMap = c.getHTMLImageMap("clickable", "", "title='{xLabel}: {value}%'");
        }
    }
}
[ASP.NET Web Forms - C# version] NetWebCharts\CSharpASP\posnegbar.aspx
(Click here on how to convert this code to code-behind style.)<%@ Page Language="C#" Debug="true" %>
<%@ Import Namespace="ChartDirector" %>
<%@ Register TagPrefix="chart" Namespace="ChartDirector" Assembly="netchartdir" %>
<!DOCTYPE html>
<script runat="server">
//
// Page Load event handler
//
protected void Page_Load(object sender, EventArgs e)
{
// The data for the bar chart
double[] data = {-6.3, 2.3, 0.7, -3.4, 2.2, -2.9, -0.1, -0.1, 3.3, 6.2, 4.3, 1.6};
// The labels for the bar chart
string[] labels = {"Jan", "Feb", "Mar", "Apr", "May", "Jun", "Jul", "Aug", "Sep", "Oct", "Nov",
"Dec"};
// Create a XYChart object of size 500 x 320 pixels
XYChart c = new XYChart(500, 320);
// Add a title to the chart using Arial Bold Italic font
c.addTitle("Productivity Change - Year 2005", "Arial Bold Italic");
// Set the plotarea at (50, 30) and of size 400 x 250 pixels
c.setPlotArea(50, 30, 400, 250);
// Add a bar layer to the chart using the Overlay data combine method
BarLayer layer = c.addBarLayer2(Chart.Overlay);
// Select positive data and add it as data set with blue (6666ff) color
layer.addDataSet(new ArrayMath(data).selectGEZ(null, Chart.NoValue).result(), 0x6666ff);
// Select negative data and add it as data set with orange (ff6600) color
layer.addDataSet(new ArrayMath(data).selectLTZ(null, Chart.NoValue).result(), 0xff6600);
// Add labels to the top of the bar using 8 pt Arial Bold font. The font color is configured to
// be red (0xcc3300) below zero, and blue (0x3333ff) above zero.
layer.setAggregateLabelStyle("Arial Bold", 8, layer.yZoneColor(0, 0xcc3300, 0x3333ff));
// Set the labels on the x axis and use Arial Bold as the label font
c.xAxis().setLabels(labels).setFontStyle("Arial Bold");
// Draw the y axis on the right of the plot area
c.setYAxisOnRight(true);
// Use Arial Bold as the y axis label font
c.yAxis().setLabelStyle("Arial Bold");
// Add a title to the y axis
c.yAxis().setTitle("Percentage");
// Add a light blue (0xccccff) zone for positive part of the plot area
c.yAxis().addZone(0, 9999, 0xccccff);
// Add a pink (0xffffcc) zone for negative part of the plot area
c.yAxis().addZone(-9999, 0, 0xffcccc);
// Output the chart
WebChartViewer1.Image = c.makeWebImage(Chart.SVG);
// Include tool tip for the chart
WebChartViewer1.ImageMap = c.getHTMLImageMap("", "", "title='{xLabel}: {value}%'");
}
</script>
<html>
<head>
<script type="text/javascript" src="cdjcv.js"></script>
</head>
<body>
<chart:WebChartViewer id="WebChartViewer1" runat="server" />
</body>
</html>
[ASP.NET Web Forms - VB Version] NetWebCharts\VBNetASP\posnegbar.aspx
(Click here on how to convert this code to code-behind style.)<%@ Page Language="VB" Debug="true" %>
<%@ Import Namespace="ChartDirector" %>
<%@ Register TagPrefix="chart" Namespace="ChartDirector" Assembly="netchartdir" %>
<!DOCTYPE html>
<script runat="server">
'
' Page Load event handler
'
Protected Sub Page_Load(ByVal sender As System.Object, ByVal e As System.EventArgs)
' The data for the bar chart
Dim data() As Double = {-6.3, 2.3, 0.7, -3.4, 2.2, -2.9, -0.1, -0.1, 3.3, 6.2, 4.3, 1.6}
' The labels for the bar chart
Dim labels() As String = {"Jan", "Feb", "Mar", "Apr", "May", "Jun", "Jul", "Aug", "Sep", _
"Oct", "Nov", "Dec"}
' Create a XYChart object of size 500 x 320 pixels
Dim c As XYChart = New XYChart(500, 320)
' Add a title to the chart using Arial Bold Italic font
c.addTitle("Productivity Change - Year 2005", "Arial Bold Italic")
' Set the plotarea at (50, 30) and of size 400 x 250 pixels
c.setPlotArea(50, 30, 400, 250)
' Add a bar layer to the chart using the Overlay data combine method
Dim layer As BarLayer = c.addBarLayer2(Chart.Overlay)
' Select positive data and add it as data set with blue (6666ff) color
layer.addDataSet(New ArrayMath(data).selectGEZ(Nothing, Chart.NoValue).result(), &H6666ff)
' Select negative data and add it as data set with orange (ff6600) color
layer.addDataSet(New ArrayMath(data).selectLTZ(Nothing, Chart.NoValue).result(), &Hff6600)
' Add labels to the top of the bar using 8 pt Arial Bold font. The font color is configured to
' be red (0xcc3300) below zero, and blue (0x3333ff) above zero.
layer.setAggregateLabelStyle("Arial Bold", 8, layer.yZoneColor(0, &Hcc3300, &H3333ff))
' Set the labels on the x axis and use Arial Bold as the label font
c.xAxis().setLabels(labels).setFontStyle("Arial Bold")
' Draw the y axis on the right of the plot area
c.setYAxisOnRight(True)
' Use Arial Bold as the y axis label font
c.yAxis().setLabelStyle("Arial Bold")
' Add a title to the y axis
c.yAxis().setTitle("Percentage")
' Add a light blue (0xccccff) zone for positive part of the plot area
c.yAxis().addZone(0, 9999, &Hccccff)
' Add a pink (0xffffcc) zone for negative part of the plot area
c.yAxis().addZone(-9999, 0, &Hffcccc)
' Output the chart
WebChartViewer1.Image = c.makeWebImage(Chart.SVG)
' Include tool tip for the chart
WebChartViewer1.ImageMap = c.getHTMLImageMap("", "", "title='{xLabel}: {value}%'")
End Sub
</script>
<html>
<head>
<script type="text/javascript" src="cdjcv.js"></script>
</head>
<body>
<chart:WebChartViewer id="WebChartViewer1" runat="server" />
</body>
</html>
[ASP.NET MVC - Controller] NetMvcCharts\Controllers\PosnegbarController.cs
using System;
using System.Web.Mvc;
using ChartDirector;

namespace NetMvcCharts.Controllers
{
    public class PosnegbarController : Controller
    {
        //
        // Default Action
        //
        public ActionResult Index()
        {
            ViewBag.Title = "Positive Negative Bars";
            createChart(ViewBag.Viewer = new RazorChartViewer(HttpContext, "chart1"));
            return View("~/Views/Shared/ChartView.cshtml");
        }

        //
        // Create chart
        //
        private void createChart(RazorChartViewer viewer)
        {
            // The data for the bar chart
            double[] data = {-6.3, 2.3, 0.7, -3.4, 2.2, -2.9, -0.1, -0.1, 3.3, 6.2, 4.3, 1.6};

            // The labels for the bar chart
            string[] labels = {"Jan", "Feb", "Mar", "Apr", "May", "Jun", "Jul", "Aug", "Sep", "Oct",
                "Nov", "Dec"};

            // Create a XYChart object of size 500 x 320 pixels
            XYChart c = new XYChart(500, 320);

            // Add a title to the chart using Arial Bold Italic font
            c.addTitle("Productivity Change - Year 2005", "Arial Bold Italic");

            // Set the plotarea at (50, 30) and of size 400 x 250 pixels
            c.setPlotArea(50, 30, 400, 250);

            // Add a bar layer to the chart using the Overlay data combine method
            BarLayer layer = c.addBarLayer2(Chart.Overlay);

            // Select positive data and add it as data set with blue (6666ff) color
            layer.addDataSet(new ArrayMath(data).selectGEZ(null, Chart.NoValue).result(), 0x6666ff);

            // Select negative data and add it as data set with orange (ff6600) color
            layer.addDataSet(new ArrayMath(data).selectLTZ(null, Chart.NoValue).result(), 0xff6600);

            // Add labels to the top of the bar using 8 pt Arial Bold font. The font color is configured
            // to be red (0xcc3300) below zero, and blue (0x3333ff) above zero.
            layer.setAggregateLabelStyle("Arial Bold", 8, layer.yZoneColor(0, 0xcc3300, 0x3333ff));

            // Set the labels on the x axis and use Arial Bold as the label font
            c.xAxis().setLabels(labels).setFontStyle("Arial Bold");

            // Draw the y axis on the right of the plot area
            c.setYAxisOnRight(true);

            // Use Arial Bold as the y axis label font
            c.yAxis().setLabelStyle("Arial Bold");

            // Add a title to the y axis
            c.yAxis().setTitle("Percentage");

            // Add a light blue (0xccccff) zone for positive part of the plot area
            c.yAxis().addZone(0, 9999, 0xccccff);

            // Add a pink (0xffffcc) zone for negative part of the plot area
            c.yAxis().addZone(-9999, 0, 0xffcccc);

            // Output the chart
            viewer.Image = c.makeWebImage(Chart.SVG);

            // Include tool tip for the chart
            viewer.ImageMap = c.getHTMLImageMap("", "", "title='{xLabel}: {value}%'");
        }
    }
}
[ASP.NET MVC - View] NetMvcCharts\Views\Shared\ChartView.cshtml
@{ Layout = null; }

<!DOCTYPE html>

<html>
<head>
    <meta name="viewport" content="width=device-width" />
    <title>@ViewBag.Title</title>
    <style>
        @ViewBag.Style
    </style>
    @Scripts.Render("~/Scripts/cdjcv.js")
</head>
<body style="margin:5px 0px 0px 5px">
    <div style="font:bold 18pt verdana;">
        @ViewBag.Title
    </div>
    <hr style="border:solid 1px #000080; background:#000080" />
    <div>
        @{
            if (ViewBag.Viewer is Array)
            {
                // Display multiple charts
                for (int i = 0; i < ViewBag.Viewer.Length; ++i)
                {
                    @:@Html.Raw(ViewBag.Viewer[i].RenderHTML())
                }
            }
            else
            {
                // Display one chart only
                @:@Html.Raw(ViewBag.Viewer.RenderHTML())
            }
        }
    </div>
</body>
</html>
© 2023 Advanced Software Engineering Limited. All rights reserved.