[ASP.NET Web Forms - C# version] NetWebCharts\CSharpASP\realtimesnapshot.aspx
(Click here on how to convert this code to code-behind style.)<%@ Page Language="C#" Debug="true" %>
<%@ Import Namespace="ChartDirector" %>
<%@ Register TagPrefix="chart" Namespace="ChartDirector" Assembly="netchartdir" %>
<script runat="server">
//
// Draw the chart
//
private void drawChart(WebChartViewer viewer)
{
//
// Data to draw the chart. In this demo, the data buffer will be filled by a random data
// generator. In real life, the data is probably stored in a buffer (eg. a database table, a
// text file, or some global memory) and updated by other means.
//
// We use a data buffer to emulate the last 240 samples.
int sampleSize = 240;
double[] dataSeries1 = new double[sampleSize];
double[] dataSeries2 = new double[sampleSize];
double[] dataSeries3 = new double[sampleSize];
DateTime[] timeStamps = new DateTime[sampleSize];
// Our pseudo random number generator
DateTime firstDate = DateTime.Now.AddSeconds(-timeStamps.Length);
for(int i = 0; i < timeStamps.Length; ++i) {
timeStamps[i] = firstDate.AddSeconds(i);
double p = timeStamps[i].Ticks / 10000000;
dataSeries1[i] = Math.Cos(p * 2.1) * 10 + 1 / (Math.Cos(p) * Math.Cos(p) + 0.01) + 20;
dataSeries2[i] = 100 * Math.Sin(p / 27.7) * Math.Sin(p / 10.1) + 150;
dataSeries3[i] = 100 * Math.Cos(p / 6.7) * Math.Cos(p / 11.9) + 150;
}
// Create an XYChart object 600 x 320 pixels in size
XYChart c = new XYChart(600, 320);
// Set the plotarea at (55, 60) and of size 520 x 235 pixels with transparent background and
// border. Enable both horizontal and vertical grids by setting their colors to grey (cccccc).
// Set clipping mode to clip the data lines to the plot area.
c.setPlotArea(55, 60, 520, 235, -1, -1, Chart.Transparent, 0xcccccc, 0xcccccc);
c.setClipping();
// Add a title to the chart using dark grey (0x333333) 20pt Arial Bold font
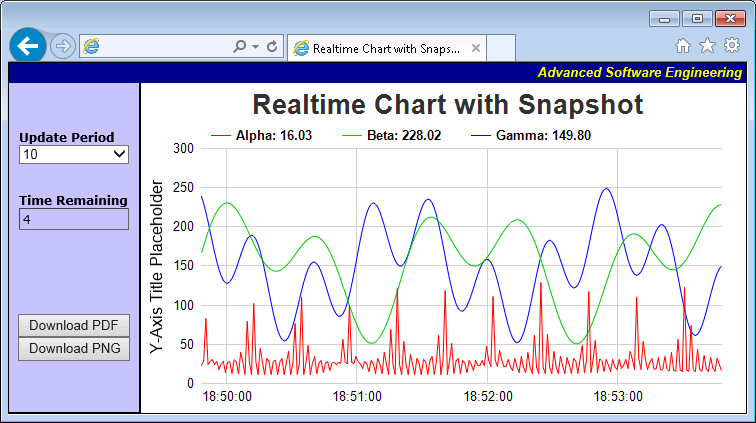
c.addTitle("Real-Time Chart with Snapshot", "Arial Bold", 20, 0x333333);
// Add a legend box at the top of the plot area using horizontal layout. Use 10pt Arial Bold
// font, transparent background and border, and line style legend icon.
LegendBox b = c.addLegend(55, 30, false, "Arial Bold", 10);
b.setBackground(Chart.Transparent, Chart.Transparent);
b.setLineStyleKey();
// Set the x and y axis stems to transparent and the label font to 10pt Arial
c.xAxis().setColors(Chart.Transparent);
c.yAxis().setColors(Chart.Transparent);
c.xAxis().setLabelStyle("Arial", 10);
c.yAxis().setLabelStyle("Arial", 10);
// Add y-axis title using 12pt Arial font
c.yAxis().setTitle("Y-Axis Title Placeholder", "Arial", 12);
// For the automatic x and y axis labels, set the minimum spacing to 75 and 30 pixels.
c.xAxis().setTickDensity(75);
c.yAxis().setTickDensity(30);
// Set the x-axis label format
c.xAxis().setLabelFormat("{value|hh:nn:ss}");
// Create a line layer to plot the lines
LineLayer layer = c.addLineLayer2();
// The x-coordinates are the timeStamps.
layer.setXData(timeStamps);
// The 3 data series are used to draw 3 lines. Here we put the latest data values as part of the
// data set name, so you can see them updated in the legend box.
layer.addDataSet(dataSeries1, 0xff0000, c.formatValue(dataSeries1[dataSeries1.Length - 1],
"Alpha: {value|2}"));
layer.addDataSet(dataSeries2, 0x00cc00, c.formatValue(dataSeries2[dataSeries2.Length - 1],
"Beta: {value|2}"));
layer.addDataSet(dataSeries3, 0x0000ff, c.formatValue(dataSeries3[dataSeries3.Length - 1],
"Gamma: {value|2}"));
// Determine the output format
if (Request["download"] == "pdf") {
viewer.Image = c.makeWebImage(Chart.PDF);
} else if (Request["download"] == "png") {
viewer.Image = c.makeWebImage(Chart.PNG);
} else {
viewer.Image = c.makeWebImage(Chart.SVG);
}
}
//
// Page Load event handler
//
protected void Page_Load(object sender, EventArgs e)
{
// Draw chart using the most update data
drawChart(WebChartViewer1);
// If is download request, output the chart as an attachment
if (!string.IsNullOrEmpty(Request["download"])) {
WebChartViewer1.StreamChart("demo_" + DateTime.Now.ToString("yyyyMMddHHmmss") + "." +
Request["download"], true);
}
// If is streaming request, output the chart immediately and terminate the page
if (WebChartViewer.IsStreamRequest(Page)) {
WebChartViewer1.StreamChart();
}
}
</script>
<!DOCTYPE html>
<html>
<head>
<title>Real-Time Chart with Snapshot</title>
<script type="text/javascript" src="cdjcv.js"></script>
</head>
<body style="margin:0px">
<table cellspacing="0" cellpadding="0" style="border:black 1px solid;">
<tr>
<td align="right" colspan="2" style="background:#000088; color:#ffff00; padding:0px 4px 2px 0px;">
<a style="color:#FFFF00; font:italic bold 10pt Arial; text-decoration:none" href="http://www.advsofteng.com/">
Advanced Software Engineering
</a>
</td>
</tr>
<tr valign="top">
<td style="width:130px; background:#c0c0ff; border-right:black 1px solid; border-bottom:black 1px solid;">
<br />
<br />
<div style="font:12px Verdana; padding:10px;">
<b>Update Period</b><br />
<select id="UpdatePeriod" style="width:110px">
<option value="5">5</option>
<option value="10" selected="selected">10</option>
<option value="20">20</option>
<option value="30">30</option>
<option value="60">60</option>
</select>
<br /><br /><br />
<b>Time Remaining</b><br />
<div style="width:108px; border:#888888 1px inset;">
<div style="margin:3px" id="TimeRemaining">0</div>
</div>
</div>
<br />
<br />
<br />
<br />
<div style="text-align:center">
<input type="button" value="Download PDF" onclick="download('pdf')" style="width:112px; font:10pt Arial;" /><br />
<input type="button" value="Download PNG" onclick="download('png')" style="width:112px; font:10pt Arial; margin-top:8px;" />
</div>
</td>
<td style="border-left:black 1px solid; padding:5px 0px 0px 5px;" >
<!-- ****** Here is the chart image ****** -->
<chart:WebChartViewer id="WebChartViewer1" runat="server" />
</td>
</tr>
</table>
<script type="text/javascript">
//
// Executes once every second to update the countdown display. Updates the chart when the countdown reaches 0.
//
function timerTick()
{
// Get the update period and the time left
var updatePeriod = parseInt(document.getElementById("UpdatePeriod").value);
var timeLeft = Math.min(parseInt(document.getElementById("TimeRemaining").innerHTML), updatePeriod) - 1;
if (timeLeft == 0)
// Can update the chart now
JsChartViewer.get('<%=WebChartViewer1.ClientID%>').streamUpdate();
else if (timeLeft < 0)
// Reset the update period
timeLeft += updatePeriod;
// Update the countdown display
document.getElementById("TimeRemaining").innerHTML = timeLeft;
}
window.setInterval("timerTick()", 1000);
//
// Send a request to the server with the query parameter "download=xxx". The server should handle this
// as a download request.
//
function download(format)
{
location.href += ((location.href.indexOf('?') == -1) ? '?' : '&') + "download=" + format;
}
</script>
</body>
</html>
[ASP.NET Web Forms - VB Version] NetWebCharts\VBNetASP\realtimesnapshot.aspx
(Click here on how to convert this code to code-behind style.)<%@ Page Language="VB" Debug="true" %>
<%@ Import Namespace="ChartDirector" %>
<%@ Register TagPrefix="chart" Namespace="ChartDirector" Assembly="netchartdir" %>
<script runat="server">
'
' Draw the chart
'
Private Sub drawChart(viewer As WebChartViewer)
'
' Data to draw the chart. In this demo, the data buffer will be filled by a random data
' generator. In real life, the data is probably stored in a buffer (eg. a database table, a text
' file, or some global memory) and updated by other means.
'
' We use a data buffer to emulate the last 240 samples.
Dim sampleSize As Integer = 240
Dim dataSeries1(sampleSize - 1) As Double
Dim dataSeries2(sampleSize - 1) As Double
Dim dataSeries3(sampleSize - 1) As Double
Dim timeStamps(sampleSize - 1) As Date
' Our pseudo random number generator
Dim firstDate As Date = DateTime.Now.AddSeconds(-timeStamps.Length)
For i As Integer = 0 To UBound(timeStamps)
timeStamps(i) = firstDate.AddSeconds(i)
Dim p As Double = timeStamps(i).Ticks / 10000000
dataSeries1(i) = Math.Cos(p * 2.1) * 10 + 1 / (Math.Cos(p) * Math.Cos(p) + 0.01) + 20
dataSeries2(i) = 100 * Math.Sin(p / 27.7) * Math.Sin(p / 10.1) + 150
dataSeries3(i) = 100 * Math.Cos(p / 6.7) * Math.Cos(p / 11.9) + 150
Next
' Create an XYChart object 600 x 320 pixels in size
Dim c As XYChart = New XYChart(600, 320)
' Set the plotarea at (55, 60) and of size 520 x 235 pixels with transparent background and
' border. Enable both horizontal and vertical grids by setting their colors to grey (cccccc).
' Set clipping mode to clip the data lines to the plot area.
c.setPlotArea(55, 60, 520, 235, -1, -1, Chart.Transparent, &Hcccccc, &Hcccccc)
c.setClipping()
' Add a title to the chart using dark grey (0x333333) 20pt Arial Bold font
c.addTitle("Real-Time Chart with Snapshot", "Arial Bold", 20, &H333333)
' Add a legend box at the top of the plot area using horizontal layout. Use 10pt Arial Bold
' font, transparent background and border, and line style legend icon.
Dim b As LegendBox = c.addLegend(55, 30, False, "Arial Bold", 10)
b.setBackground(Chart.Transparent, Chart.Transparent)
b.setLineStyleKey()
' Set the x and y axis stems to transparent and the label font to 10pt Arial
c.xAxis().setColors(Chart.Transparent)
c.yAxis().setColors(Chart.Transparent)
c.xAxis().setLabelStyle("Arial", 10)
c.yAxis().setLabelStyle("Arial", 10)
' Add y-axis title using 12pt Arial font
c.yAxis().setTitle("Y-Axis Title Placeholder", "Arial", 12)
' For the automatic x and y axis labels, set the minimum spacing to 75 and 30 pixels.
c.xAxis().setTickDensity(75)
c.yAxis().setTickDensity(30)
' Set the x-axis label format
c.xAxis().setLabelFormat("{value|hh:nn:ss}")
' Create a line layer to plot the lines
Dim layer As LineLayer = c.addLineLayer2()
' The x-coordinates are the timeStamps.
layer.setXData(timeStamps)
' The 3 data series are used to draw 3 lines. Here we put the latest data values as part of the
' data set name, so you can see them updated in the legend box.
layer.addDataSet(dataSeries1, &Hff0000, c.formatValue(dataSeries1(UBound(dataSeries1)), _
"Alpha: {value|2}"))
layer.addDataSet(dataSeries2, &H00cc00, c.formatValue(dataSeries2(UBound(dataSeries2)), _
"Beta: {value|2}"))
layer.addDataSet(dataSeries3, &H0000ff, c.formatValue(dataSeries3(UBound(dataSeries3)), _
"Gamma: {value|2}"))
' Determine the output format
If Request("download") = "pdf" Then
viewer.Image = c.makeWebImage(Chart.PDF)
ElseIf Request("download") = "png" Then
viewer.Image = c.makeWebImage(Chart.PNG)
Else
viewer.Image = c.makeWebImage(Chart.SVG)
End If
End Sub
'
' Page Load event handler
'
Private Sub Page_Load(sender As System.Object, e As System.EventArgs)
' Draw chart using the most update data
drawChart(WebChartViewer1)
' If is download request, output the chart as an attachment
If Not String.IsNullOrEmpty(Request("download")) Then
WebChartViewer1.StreamChart("demo_" & Now.ToString("yyyyMMddHHmmss") & "." & Request( _
"download"), True)
End If
' If is streaming request, output the chart immediately and terminate the page
If WebChartViewer.IsStreamRequest(Page) Then
WebChartViewer1.StreamChart()
End If
End Sub
</script>
<!DOCTYPE html>
<html>
<head>
<title>Real-Time Chart with Snapshot</title>
<script type="text/javascript" src="cdjcv.js"></script>
</head>
<body style="margin:0px">
<table cellspacing="0" cellpadding="0" style="border:black 1px solid;">
<tr>
<td align="right" colspan="2" style="background:#000088; color:#ffff00; padding:0px 4px 2px 0px;">
<a style="color:#FFFF00; font:italic bold 10pt Arial; text-decoration:none" href="http://www.advsofteng.com/">
Advanced Software Engineering
</a>
</td>
</tr>
<tr valign="top">
<td style="width:130px; background:#c0c0ff; border-right:black 1px solid; border-bottom:black 1px solid;">
<br />
<br />
<div style="font:12px Verdana; padding:10px;">
<b>Update Period</b><br />
<select id="UpdatePeriod" style="width:110px">
<option value="5">5</option>
<option value="10" selected="selected">10</option>
<option value="20">20</option>
<option value="30">30</option>
<option value="60">60</option>
</select>
<br /><br /><br />
<b>Time Remaining</b><br />
<div style="width:108px; border:#888888 1px inset;">
<div style="margin:3px" id="TimeRemaining">0</div>
</div>
</div>
<br />
<br />
<br />
<br />
<div style="text-align:center">
<input type="button" value="Download PDF" onclick="download('pdf')" style="width:112px; font:10pt Arial;" /><br />
<input type="button" value="Download PNG" onclick="download('png')" style="width:112px; font:10pt Arial; margin-top:8px;" />
</div>
</td>
<td style="border-left:black 1px solid; padding:5px 0px 0px 5px;" >
<!-- ****** Here is the chart image ****** -->
<chart:WebChartViewer id="WebChartViewer1" runat="server" />
</td>
</tr>
</table>
<script type="text/javascript">
//
// Executes once every second to update the countdown display. Updates the chart when the countdown reaches 0.
//
function timerTick()
{
// Get the update period and the time left
var updatePeriod = parseInt(document.getElementById("UpdatePeriod").value);
var timeLeft = Math.min(parseInt(document.getElementById("TimeRemaining").innerHTML), updatePeriod) - 1;
if (timeLeft == 0)
// Can update the chart now
JsChartViewer.get('<%=WebChartViewer1.ClientID%>').streamUpdate();
else if (timeLeft < 0)
// Reset the update period
timeLeft += updatePeriod;
// Update the countdown display
document.getElementById("TimeRemaining").innerHTML = timeLeft;
}
window.setInterval("timerTick()", 1000);
//
// Send a request to the server with the query parameter "download=xxx". The server should handle this
// as a download request.
//
function download(format)
{
location.href += ((location.href.indexOf('?') == -1) ? '?' : '&') + "download=" + format;
}
</script>
</body>
</html>
[ASP.NET MVC - Controller] NetMvcCharts\Controllers\RealtimesnapshotController.cs
using System;
using System.Web.Mvc;
using ChartDirector;

namespace NetMvcCharts.Controllers
{
    public class RealtimesnapshotController : Controller
    {
        //
        // Draw the chart
        //
        private void drawChart(RazorChartViewer viewer)
        {
            //
            // Data to draw the chart. In this demo, the data buffer will be filled by a random data
            // generator. In real life, the data is probably stored in a buffer (eg. a database table, a
            // text file, or some global memory) and updated by other means.
            //

            // We use a data buffer to emulate the last 240 samples.
            int sampleSize = 240;
            double[] dataSeries1 = new double[sampleSize];
            double[] dataSeries2 = new double[sampleSize];
            double[] dataSeries3 = new double[sampleSize];
            DateTime[] timeStamps = new DateTime[sampleSize];

            // Our pseudo random number generator
            DateTime firstDate = DateTime.Now.AddSeconds(-timeStamps.Length);
            for(int i = 0; i < timeStamps.Length; ++i) {
                timeStamps[i] = firstDate.AddSeconds(i);
                double p = timeStamps[i].Ticks / 10000000;
                dataSeries1[i] = Math.Cos(p * 2.1) * 10 + 1 / (Math.Cos(p) * Math.Cos(p) + 0.01) + 20;
                dataSeries2[i] = 100 * Math.Sin(p / 27.7) * Math.Sin(p / 10.1) + 150;
                dataSeries3[i] = 100 * Math.Cos(p / 6.7) * Math.Cos(p / 11.9) + 150;
            }

            // Create an XYChart object 600 x 320 pixels in size
            XYChart c = new XYChart(600, 320);

            // Set the plotarea at (55, 60) and of size 520 x 235 pixels with transparent background and
            // border. Enable both horizontal and vertical grids by setting their colors to grey
            // (cccccc). Set clipping mode to clip the data lines to the plot area.
            c.setPlotArea(55, 60, 520, 235, -1, -1, Chart.Transparent, 0xcccccc, 0xcccccc);
            c.setClipping();

            // Add a title to the chart using dark grey (0x333333) 20pt Arial Bold font
            c.addTitle("Real-Time Chart with Snapshot", "Arial Bold", 20, 0x333333);

            // Add a legend box at the top of the plot area using horizontal layout. Use 10pt Arial Bold
            // font, transparent background and border, and line style legend icon.
            LegendBox b = c.addLegend(55, 30, false, "Arial Bold", 10);
            b.setBackground(Chart.Transparent, Chart.Transparent);
            b.setLineStyleKey();

            // Set the x and y axis stems to transparent and the label font to 10pt Arial
            c.xAxis().setColors(Chart.Transparent);
            c.yAxis().setColors(Chart.Transparent);
            c.xAxis().setLabelStyle("Arial", 10);
            c.yAxis().setLabelStyle("Arial", 10);

            // Add y-axis title using 12pt Arial font
            c.yAxis().setTitle("Y-Axis Title Placeholder", "Arial", 12);

            // For the automatic x and y axis labels, set the minimum spacing to 75 and 30 pixels.
            c.xAxis().setTickDensity(75);
            c.yAxis().setTickDensity(30);

            // Set the x-axis label format
            c.xAxis().setLabelFormat("{value|hh:nn:ss}");

            // Create a line layer to plot the lines
            LineLayer layer = c.addLineLayer2();

            // The x-coordinates are the timeStamps.
            layer.setXData(timeStamps);

            // The 3 data series are used to draw 3 lines. Here we put the latest data values as part of
            // the data set name, so you can see them updated in the legend box.
            layer.addDataSet(dataSeries1, 0xff0000, c.formatValue(dataSeries1[dataSeries1.Length - 1],
                "Alpha: {value|2}"));
            layer.addDataSet(dataSeries2, 0x00cc00, c.formatValue(dataSeries2[dataSeries2.Length - 1],
                "Beta: {value|2}"));
            layer.addDataSet(dataSeries3, 0x0000ff, c.formatValue(dataSeries3[dataSeries3.Length - 1],
                "Gamma: {value|2}"));

            // Determine the output format
            if (Request["download"] == "pdf") {
                viewer.Image = c.makeWebImage(Chart.PDF);
            } else if (Request["download"] == "png") {
                viewer.Image = c.makeWebImage(Chart.PNG);
            } else {
                viewer.Image = c.makeWebImage(Chart.SVG);
            }
        }

        public ActionResult Index()
        {
            RazorChartViewer viewer = ViewBag.Viewer = new RazorChartViewer(HttpContext, "chart1");

            // Draw chart using the most update data
            drawChart(viewer);

            // If is download request, output the chart as an attachment
            if (!string.IsNullOrEmpty(Request["download"])) {
                return File(viewer.StreamChart(), Response.ContentType, "demo_" +
                    DateTime.Now.ToString("yyyyMMddHHmmss") + "." + Request["download"]);
            }

            // If is streaming request, output the chart only
            if (RazorChartViewer.IsStreamRequest(Request)) {
                return File(viewer.StreamChart(), Response.ContentType);
            }

            return View();
        }
    }
}
[ASP.NET MVC - View] NetMvcCharts\Views\Realtimesnapshot\Index.cshtml
@{ Layout = null; }

<!DOCTYPE html>
<html>
<head>
    <title>Real-Time Chart with Snapshot</title>
    @Scripts.Render("~/Scripts/cdjcv.js")
</head>
<body style="margin:0px">
<table cellspacing="0" cellpadding="0" style="border:black 1px solid;">
    <tr>
        <td align="right" colspan="2" style="background:#000088; color:#ffff00; padding:0px 4px 2px 0px;">
            <a style="color:#FFFF00; font:italic bold 10pt Arial; text-decoration:none" href="http://www.advsofteng.com/">
                Advanced Software Engineering
            </a>
        </td>
    </tr>
    <tr valign="top">
        <td style="width:130px; background:#c0c0ff; border-right:black 1px solid; border-bottom:black 1px solid;">
            <br />
            <br />
            <div style="font:12px Verdana; padding:10px;">
                <b>Update Period</b><br />
                <select id="UpdatePeriod" style="width:110px">
                    <option value="5">5</option>
                    <option value="10" selected="selected">10</option>
                    <option value="20">20</option>
                    <option value="30">30</option>
                    <option value="60">60</option>
                </select>
                <br /><br /><br />
                <b>Time Remaining</b><br />
                <div style="width:108px; border:#888888 1px inset;">
                    <div style="margin:3px" id="TimeRemaining">0</div>
                </div>
            </div>
            <br />
            <br />
            <br />
            <br />
            <div style="text-align:center">
                <input type="button" value="Download PDF" onclick="download('pdf')" style="width:112px; font:10pt Arial;" /><br />
                <input type="button" value="Download PNG" onclick="download('png')" style="width:112px; font:10pt Arial; margin-top:8px;" />
            </div>
        </td>
        <td style="border-left:black 1px solid; padding:5px 0px 0px 5px;" >
            <!-- ****** Here is the chart image ****** -->
            @Html.Raw(ViewBag.Viewer.RenderHTML())
        </td>
    </tr>
</table>
<script type="text/javascript">

//
// Executes once every second to update the countdown display. Updates the chart when the countdown reaches 0.
//
function timerTick()
{
    // Get the update period and the time left
    var updatePeriod = parseInt(document.getElementById("UpdatePeriod").value);
    var timeLeft = Math.min(parseInt(document.getElementById("TimeRemaining").innerHTML), updatePeriod) - 1;

    if (timeLeft == 0)
        // Can update the chart now
        JsChartViewer.get('@ViewBag.Viewer.ID').streamUpdate();
    else if (timeLeft < 0)
        // Reset the update period
        timeLeft += updatePeriod;

    // Update the countdown display
    document.getElementById("TimeRemaining").innerHTML = timeLeft;
}
window.setInterval("timerTick()", 1000);

//
// Send a request to the server with the query parameter "download=xxx". The server should handle this
// as a download request.
//
function download(format)
{
    location.href += ((location.href.indexOf('?') == -1) ? '?' : '&') + "download=" + format;
}

</script>
</body>
</html>
© 2023 Advanced Software Engineering Limited. All rights reserved.