[Windows Forms - C# version] NetWinCharts\CSharpWinCharts\scattersurface.cs
using System;
using ChartDirector;
namespace CSharpChartExplorer
{
public class scattersurface : DemoModule
{
//Name of demo module
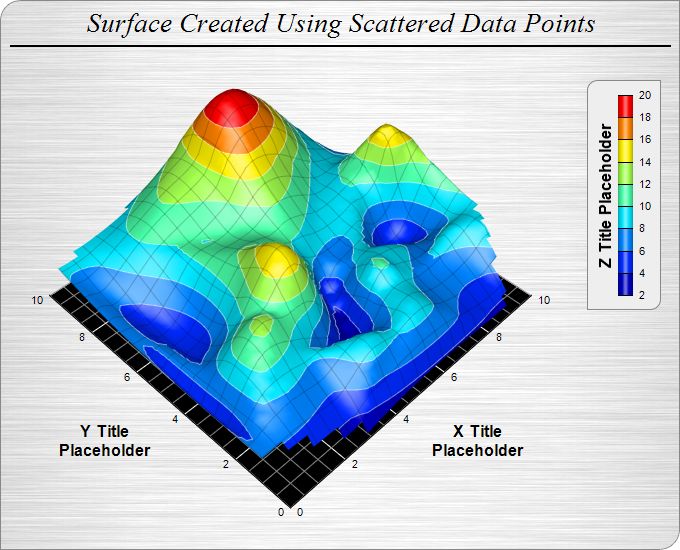
public string getName() { return "Scattered Data Surface Chart"; }
//Number of charts produced in this demo module
public int getNoOfCharts() { return 1; }
//Main code for creating chart.
//Note: the argument chartIndex is unused because this demo only has 1 chart.
public void createChart(WinChartViewer viewer, int chartIndex)
{
// The (x, y, z) coordinates of the scattered data
double[] dataX = {0.5, 1.9, 4.9, 1.0, 8.9, 9.8, 5.9, 2.9, 6.8, 9.0, 0.0, 8.9, 1.9, 4.8,
2.4, 3.4, 7.9, 7.5, 4.8, 7.5, 9.5, 0.4, 8.9, 0.9, 5.4, 9.4, 2.9, 8.9, 0.9, 8.9,
10.0, 1.0, 6.8, 3.8, 9.0, 5.3, 6.4, 4.9, 4.5, 2.0, 5.4, 0.0, 10.0, 3.9, 5.4, 5.9,
5.8, 0.3, 4.4, 8.3};
double[] dataY = {3.3, 3.0, 0.7, 1.0, 9.3, 4.5, 8.4, 0.1, 0.8, 0.1, 9.3, 1.8, 4.3, 1.3,
2.3, 5.4, 6.9, 9.0, 9.8, 7.5, 1.8, 1.4, 4.5, 7.8, 3.8, 4.0, 2.9, 2.4, 3.9, 2.9, 2.3,
9.3, 2.0, 3.4, 4.8, 2.3, 3.4, 2.3, 1.5, 7.8, 4.5, 0.9, 6.3, 2.4, 6.9, 2.8, 1.3, 2.9,
6.4, 6.3};
double[] dataZ = {6.6, 12.5, 7.4, 6.2, 9.6, 13.6, 19.9, 2.2, 6.9, 3.4, 8.7, 8.4, 7.8,
8.0, 9.4, 11.9, 9.6, 15.7, 12.0, 13.3, 9.6, 6.4, 9.0, 6.9, 4.6, 9.7, 10.6, 9.2, 7.0,
6.9, 9.7, 8.6, 8.0, 13.6, 13.2, 5.9, 9.0, 3.2, 8.3, 9.7, 8.2, 6.1, 8.7, 5.6, 14.9,
9.8, 9.3, 5.1, 10.8, 9.8};
// Create a SurfaceChart object of size 680 x 550 pixels. Set background to brushed
// silver and border to grey (888888). Set the top-left and bottom-right corners to
// rounded corners with 20 pixels radius.
SurfaceChart c = new SurfaceChart(680, 550, Chart.brushedSilverColor(), 0x888888);
c.setRoundedFrame(0xffffff, 20, 0, 20, 0);
// Add a title to the chart using 20 points Times New Roman Italic font. Set top/bottom
// margin to 8 pixels.
ChartDirector.TextBox title = c.addTitle("Surface Created Using Scattered Data Points",
"Times New Roman Italic", 20);
title.setMargin2(0, 0, 8, 8);
// Add a 2 pixel wide black (000000) separator line under the title
c.addLine(10, title.getHeight(), c.getWidth() - 10, title.getHeight(), 0x000000, 2);
// Set the center of the plot region at (290, 235), and set width x depth x height to
// 360 x 360 x 180 pixels
c.setPlotRegion(290, 235, 360, 360, 180);
// Set the elevation and rotation angles to 45 and -45 degrees
c.setViewAngle(45, -45);
// Set the perspective level to 30
c.setPerspective(30);
// Set the data to use to plot the chart
c.setData(dataX, dataY, dataZ);
// Add a color axis (the legend) in which the top right corner is anchored at (660, 80).
// Set the length to 200 pixels and the labels on the right side.
ColorAxis cAxis = c.setColorAxis(660, 80, Chart.TopRight, 200, Chart.Right);
// Set the color axis title with 12 points Arial Bold font
cAxis.setTitle("Z Title Placeholder", "Arial Bold", 12);
// Add a bounding box with light grey (eeeeee) background and grey (888888) border. Set
// the top-left and bottom-right corners to rounded corners of 10 pixels radius.
cAxis.setBoundingBox(0xeeeeee, 0x888888);
cAxis.setRoundedCorners(10, 0, 10, 0);
// Set surface grid lines to semi-transparent black (cc000000)
c.setSurfaceAxisGrid(unchecked((int)0xcc000000));
// Set contour lines to semi-transparent white (80ffffff)
c.setContourColor(unchecked((int)0x80ffffff));
// Set the walls to black in color
c.setWallColor(0x000000);
// Set the xyz major wall grid lines to white (ffffff), and minor wall grid lines to
// grey (888888)
c.setWallGrid(0xffffff, 0xffffff, 0xffffff, 0x888888, 0x888888, 0x888888);
// Set the wall thickness to 0
c.setWallThickness(0, 0, 0);
// Show only the xy wall, and hide the yz and zx walls.
c.setWallVisibility(true, false, false);
// Set the x, y and z axis titles using 12 points Arial Bold font
c.xAxis().setTitle("X Title\nPlaceholder", "Arial Bold", 12);
c.yAxis().setTitle("Y Title\nPlaceholder", "Arial Bold", 12);
// Output the chart
viewer.Chart = c;
//include tool tip for the chart
viewer.ImageMap = c.getHTMLImageMap("clickable", "",
"title='<*cdml*><*font=bold*>X: {x|2}<*br*>Y: {y|2}<*br*>Z: {z|2}'");
}
}
}
[Windows Forms - VB Version] NetWinCharts\VBNetWinCharts\scattersurface.vb
Imports System
Imports Microsoft.VisualBasic
Imports ChartDirector

Public Class scattersurface
    Implements DemoModule

    'Name of demo module
    Public Function getName() As String Implements DemoModule.getName
        Return "Scattered Data Surface Chart"
    End Function

    'Number of charts produced in this demo module
    Public Function getNoOfCharts() As Integer Implements DemoModule.getNoOfCharts
        Return 1
    End Function

    'Main code for creating chart.
    'Note: the argument chartIndex is unused because this demo only has 1 chart.
    Public Sub createChart(viewer As WinChartViewer, chartIndex As Integer) _
        Implements DemoModule.createChart

        ' The (x, y, z) coordinates of the scattered data
        Dim dataX() As Double = {0.5, 1.9, 4.9, 1.0, 8.9, 9.8, 5.9, 2.9, 6.8, 9.0, 0.0, 8.9, 1.9, _
            4.8, 2.4, 3.4, 7.9, 7.5, 4.8, 7.5, 9.5, 0.4, 8.9, 0.9, 5.4, 9.4, 2.9, 8.9, 0.9, 8.9, _
            10.0, 1.0, 6.8, 3.8, 9.0, 5.3, 6.4, 4.9, 4.5, 2.0, 5.4, 0.0, 10.0, 3.9, 5.4, 5.9, 5.8, _
            0.3, 4.4, 8.3}
        Dim dataY() As Double = {3.3, 3.0, 0.7, 1.0, 9.3, 4.5, 8.4, 0.1, 0.8, 0.1, 9.3, 1.8, 4.3, _
            1.3, 2.3, 5.4, 6.9, 9.0, 9.8, 7.5, 1.8, 1.4, 4.5, 7.8, 3.8, 4.0, 2.9, 2.4, 3.9, 2.9, _
            2.3, 9.3, 2.0, 3.4, 4.8, 2.3, 3.4, 2.3, 1.5, 7.8, 4.5, 0.9, 6.3, 2.4, 6.9, 2.8, 1.3, _
            2.9, 6.4, 6.3}
        Dim dataZ() As Double = {6.6, 12.5, 7.4, 6.2, 9.6, 13.6, 19.9, 2.2, 6.9, 3.4, 8.7, 8.4, _
            7.8, 8.0, 9.4, 11.9, 9.6, 15.7, 12.0, 13.3, 9.6, 6.4, 9.0, 6.9, 4.6, 9.7, 10.6, 9.2, _
            7.0, 6.9, 9.7, 8.6, 8.0, 13.6, 13.2, 5.9, 9.0, 3.2, 8.3, 9.7, 8.2, 6.1, 8.7, 5.6, _
            14.9, 9.8, 9.3, 5.1, 10.8, 9.8}

        ' Create a SurfaceChart object of size 680 x 550 pixels. Set background to brushed silver
        ' and border to grey (888888). Set the top-left and bottom-right corners to rounded corners
        ' with 20 pixels radius.
        Dim c As SurfaceChart = New SurfaceChart(680, 550, Chart.brushedSilverColor(), &H888888)
        c.setRoundedFrame(&Hffffff, 20, 0, 20, 0)

        ' Add a title to the chart using 20 points Times New Roman Italic font. Set top/bottom
        ' margin to 8 pixels.
        Dim title As ChartDirector.TextBox = c.addTitle( _
            "Surface Created Using Scattered Data Points", "Times New Roman Italic", 20)
        title.setMargin2(0, 0, 8, 8)

        ' Add a 2 pixel wide black (000000) separator line under the title
        c.addLine(10, title.getHeight(), c.getWidth() - 10, title.getHeight(), &H000000, 2)

        ' Set the center of the plot region at (290, 235), and set width x depth x height to 360 x
        ' 360 x 180 pixels
        c.setPlotRegion(290, 235, 360, 360, 180)

        ' Set the elevation and rotation angles to 45 and -45 degrees
        c.setViewAngle(45, -45)

        ' Set the perspective level to 30
        c.setPerspective(30)

        ' Set the data to use to plot the chart
        c.setData(dataX, dataY, dataZ)

        ' Add a color axis (the legend) in which the top right corner is anchored at (660, 80). Set
        ' the length to 200 pixels and the labels on the right side.
        Dim cAxis As ColorAxis = c.setColorAxis(660, 80, Chart.TopRight, 200, Chart.Right)

        ' Set the color axis title with 12 points Arial Bold font
        cAxis.setTitle("Z Title Placeholder", "Arial Bold", 12)

        ' Add a bounding box with light grey (eeeeee) background and grey (888888) border. Set the
        ' top-left and bottom-right corners to rounded corners of  10 pixels radius.
        cAxis.setBoundingBox(&Heeeeee, &H888888)
        cAxis.setRoundedCorners(10, 0, 10, 0)

        ' Set surface grid lines to semi-transparent black (cc000000)
        c.setSurfaceAxisGrid(&Hcc000000)

        ' Set contour lines to semi-transparent white (80ffffff)
        c.setContourColor(&H80ffffff)

        ' Set the walls to black in color
        c.setWallColor(&H000000)

        ' Set the xyz major wall grid lines to white (ffffff), and minor wall grid lines to grey
        ' (888888)
        c.setWallGrid(&Hffffff, &Hffffff, &Hffffff, &H888888, &H888888, &H888888)

        ' Set the wall thickness to 0
        c.setWallThickness(0, 0, 0)

        ' Show only the xy wall, and hide the yz and zx walls.
        c.setWallVisibility(True, False, False)

        ' Set the x, y and z axis titles using 12 points Arial Bold font
        c.xAxis().setTitle("X Title<*br*>Placeholder", "Arial Bold", 12)
        c.yAxis().setTitle("Y Title<*br*>Placeholder", "Arial Bold", 12)

        ' Output the chart
        viewer.Chart = c

        'include tool tip for the chart
        viewer.ImageMap = c.getHTMLImageMap("clickable", "", _
            "title='<*cdml*><*font=bold*>X: {x|2}<*br*>Y: {y|2}<*br*>Z: {z|2}'")

    End Sub

End Class
[WPF - C#] NetWPFCharts\CSharpWPFCharts\scattersurface.cs
using System;
using ChartDirector;

namespace CSharpWPFCharts
{
    public class scattersurface : DemoModule
    {
        //Name of demo module
        public string getName() { return "Scattered Data Surface Chart"; }

        //Number of charts produced in this demo module
        public int getNoOfCharts() { return 1; }

        //Main code for creating chart.
        //Note: the argument chartIndex is unused because this demo only has 1 chart.
        public void createChart(WPFChartViewer viewer, int chartIndex)
        {
            // The (x, y, z) coordinates of the scattered data
            double[] dataX = {0.5, 1.9, 4.9, 1.0, 8.9, 9.8, 5.9, 2.9, 6.8, 9.0, 0.0, 8.9, 1.9, 4.8,
                2.4, 3.4, 7.9, 7.5, 4.8, 7.5, 9.5, 0.4, 8.9, 0.9, 5.4, 9.4, 2.9, 8.9, 0.9, 8.9,
                10.0, 1.0, 6.8, 3.8, 9.0, 5.3, 6.4, 4.9, 4.5, 2.0, 5.4, 0.0, 10.0, 3.9, 5.4, 5.9,
                5.8, 0.3, 4.4, 8.3};
            double[] dataY = {3.3, 3.0, 0.7, 1.0, 9.3, 4.5, 8.4, 0.1, 0.8, 0.1, 9.3, 1.8, 4.3, 1.3,
                2.3, 5.4, 6.9, 9.0, 9.8, 7.5, 1.8, 1.4, 4.5, 7.8, 3.8, 4.0, 2.9, 2.4, 3.9, 2.9, 2.3,
                9.3, 2.0, 3.4, 4.8, 2.3, 3.4, 2.3, 1.5, 7.8, 4.5, 0.9, 6.3, 2.4, 6.9, 2.8, 1.3, 2.9,
                6.4, 6.3};
            double[] dataZ = {6.6, 12.5, 7.4, 6.2, 9.6, 13.6, 19.9, 2.2, 6.9, 3.4, 8.7, 8.4, 7.8,
                8.0, 9.4, 11.9, 9.6, 15.7, 12.0, 13.3, 9.6, 6.4, 9.0, 6.9, 4.6, 9.7, 10.6, 9.2, 7.0,
                6.9, 9.7, 8.6, 8.0, 13.6, 13.2, 5.9, 9.0, 3.2, 8.3, 9.7, 8.2, 6.1, 8.7, 5.6, 14.9,
                9.8, 9.3, 5.1, 10.8, 9.8};

            // Create a SurfaceChart object of size 680 x 550 pixels. Set background to brushed
            // silver and border to grey (888888). Set the top-left and bottom-right corners to
            // rounded corners with 20 pixels radius.
            SurfaceChart c = new SurfaceChart(680, 550, Chart.brushedSilverColor(), 0x888888);
            c.setRoundedFrame(0xffffff, 20, 0, 20, 0);

            // Add a title to the chart using 20 points Times New Roman Italic font. Set top/bottom
            // margin to 8 pixels.
            ChartDirector.TextBox title = c.addTitle("Surface Created Using Scattered Data Points",
                "Times New Roman Italic", 20);
            title.setMargin2(0, 0, 8, 8);

            // Add a 2 pixel wide black (000000) separator line under the title
            c.addLine(10, title.getHeight(), c.getWidth() - 10, title.getHeight(), 0x000000, 2);

            // Set the center of the plot region at (290, 235), and set width x depth x height to
            // 360 x 360 x 180 pixels
            c.setPlotRegion(290, 235, 360, 360, 180);

            // Set the elevation and rotation angles to 45 and -45 degrees
            c.setViewAngle(45, -45);

            // Set the perspective level to 30
            c.setPerspective(30);

            // Set the data to use to plot the chart
            c.setData(dataX, dataY, dataZ);

            // Add a color axis (the legend) in which the top right corner is anchored at (660, 80).
            // Set the length to 200 pixels and the labels on the right side.
            ColorAxis cAxis = c.setColorAxis(660, 80, Chart.TopRight, 200, Chart.Right);

            // Set the color axis title with 12 points Arial Bold font
            cAxis.setTitle("Z Title Placeholder", "Arial Bold", 12);

            // Add a bounding box with light grey (eeeeee) background and grey (888888) border. Set
            // the top-left and bottom-right corners to rounded corners of  10 pixels radius.
            cAxis.setBoundingBox(0xeeeeee, 0x888888);
            cAxis.setRoundedCorners(10, 0, 10, 0);

            // Set surface grid lines to semi-transparent black (cc000000)
            c.setSurfaceAxisGrid(unchecked((int)0xcc000000));

            // Set contour lines to semi-transparent white (80ffffff)
            c.setContourColor(unchecked((int)0x80ffffff));

            // Set the walls to black in color
            c.setWallColor(0x000000);

            // Set the xyz major wall grid lines to white (ffffff), and minor wall grid lines to
            // grey (888888)
            c.setWallGrid(0xffffff, 0xffffff, 0xffffff, 0x888888, 0x888888, 0x888888);

            // Set the wall thickness to 0
            c.setWallThickness(0, 0, 0);

            // Show only the xy wall, and hide the yz and zx walls.
            c.setWallVisibility(true, false, false);

            // Set the x, y and z axis titles using 12 points Arial Bold font
            c.xAxis().setTitle("X Title\nPlaceholder", "Arial Bold", 12);
            c.yAxis().setTitle("Y Title\nPlaceholder", "Arial Bold", 12);

            // Output the chart
            viewer.Chart = c;

            //include tool tip for the chart
            viewer.ImageMap = c.getHTMLImageMap("clickable", "",
                "title='<*cdml*><*font=bold*>X: {x|2}<*br*>Y: {y|2}<*br*>Z: {z|2}'");
        }
    }
}
[ASP.NET Web Forms - C# version] NetWebCharts\CSharpASP\scattersurface.aspx
(Click here on how to convert this code to code-behind style.)<%@ Page Language="C#" Debug="true" %>
<%@ Import Namespace="ChartDirector" %>
<%@ Register TagPrefix="chart" Namespace="ChartDirector" Assembly="netchartdir" %>
<!DOCTYPE html>
<script runat="server">
//
// Page Load event handler
//
protected void Page_Load(object sender, EventArgs e)
{
// The (x, y, z) coordinates of the scattered data
double[] dataX = {0.5, 1.9, 4.9, 1.0, 8.9, 9.8, 5.9, 2.9, 6.8, 9.0, 0.0, 8.9, 1.9, 4.8, 2.4,
3.4, 7.9, 7.5, 4.8, 7.5, 9.5, 0.4, 8.9, 0.9, 5.4, 9.4, 2.9, 8.9, 0.9, 8.9, 10.0, 1.0, 6.8,
3.8, 9.0, 5.3, 6.4, 4.9, 4.5, 2.0, 5.4, 0.0, 10.0, 3.9, 5.4, 5.9, 5.8, 0.3, 4.4, 8.3};
double[] dataY = {3.3, 3.0, 0.7, 1.0, 9.3, 4.5, 8.4, 0.1, 0.8, 0.1, 9.3, 1.8, 4.3, 1.3, 2.3,
5.4, 6.9, 9.0, 9.8, 7.5, 1.8, 1.4, 4.5, 7.8, 3.8, 4.0, 2.9, 2.4, 3.9, 2.9, 2.3, 9.3, 2.0,
3.4, 4.8, 2.3, 3.4, 2.3, 1.5, 7.8, 4.5, 0.9, 6.3, 2.4, 6.9, 2.8, 1.3, 2.9, 6.4, 6.3};
double[] dataZ = {6.6, 12.5, 7.4, 6.2, 9.6, 13.6, 19.9, 2.2, 6.9, 3.4, 8.7, 8.4, 7.8, 8.0, 9.4,
11.9, 9.6, 15.7, 12.0, 13.3, 9.6, 6.4, 9.0, 6.9, 4.6, 9.7, 10.6, 9.2, 7.0, 6.9, 9.7, 8.6,
8.0, 13.6, 13.2, 5.9, 9.0, 3.2, 8.3, 9.7, 8.2, 6.1, 8.7, 5.6, 14.9, 9.8, 9.3, 5.1, 10.8, 9.8
};
// Create a SurfaceChart object of size 680 x 550 pixels. Set background to brushed silver and
// border to grey (888888). Set the top-left and bottom-right corners to rounded corners with 20
// pixels radius.
SurfaceChart c = new SurfaceChart(680, 550, Chart.brushedSilverColor(), 0x888888);
c.setRoundedFrame(0xffffff, 20, 0, 20, 0);
// Add a title to the chart using 20 points Times New Roman Italic font. Set top/bottom margin
// to 8 pixels.
ChartDirector.TextBox title = c.addTitle("Surface Created Using Scattered Data Points",
"Times New Roman Italic", 20);
title.setMargin2(0, 0, 8, 8);
// Add a 2 pixel wide black (000000) separator line under the title
c.addLine(10, title.getHeight(), c.getWidth() - 10, title.getHeight(), 0x000000, 2);
// Set the center of the plot region at (290, 235), and set width x depth x height to 360 x 360
// x 180 pixels
c.setPlotRegion(290, 235, 360, 360, 180);
// Set the elevation and rotation angles to 45 and -45 degrees
c.setViewAngle(45, -45);
// Set the perspective level to 30
c.setPerspective(30);
// Set the data to use to plot the chart
c.setData(dataX, dataY, dataZ);
// Add a color axis (the legend) in which the top right corner is anchored at (660, 80). Set the
// length to 200 pixels and the labels on the right side.
ColorAxis cAxis = c.setColorAxis(660, 80, Chart.TopRight, 200, Chart.Right);
// Set the color axis title with 12 points Arial Bold font
cAxis.setTitle("Z Title Placeholder", "Arial Bold", 12);
// Add a bounding box with light grey (eeeeee) background and grey (888888) border. Set the
// top-left and bottom-right corners to rounded corners of 10 pixels radius.
cAxis.setBoundingBox(0xeeeeee, 0x888888);
cAxis.setRoundedCorners(10, 0, 10, 0);
// Set surface grid lines to semi-transparent black (cc000000)
c.setSurfaceAxisGrid(unchecked((int)0xcc000000));
// Set contour lines to semi-transparent white (80ffffff)
c.setContourColor(unchecked((int)0x80ffffff));
// Set the walls to black in color
c.setWallColor(0x000000);
// Set the xyz major wall grid lines to white (ffffff), and minor wall grid lines to grey
// (888888)
c.setWallGrid(0xffffff, 0xffffff, 0xffffff, 0x888888, 0x888888, 0x888888);
// Set the wall thickness to 0
c.setWallThickness(0, 0, 0);
// Show only the xy wall, and hide the yz and zx walls.
c.setWallVisibility(true, false, false);
// Set the x, y and z axis titles using 12 points Arial Bold font
c.xAxis().setTitle("X Title\nPlaceholder", "Arial Bold", 12);
c.yAxis().setTitle("Y Title\nPlaceholder", "Arial Bold", 12);
// Output the chart
WebChartViewer1.Image = c.makeWebImage(Chart.SVG);
}
</script>
<html>
<head>
<script type="text/javascript" src="cdjcv.js"></script>
</head>
<body>
<chart:WebChartViewer id="WebChartViewer1" runat="server" />
</body>
</html>
[ASP.NET Web Forms - VB Version] NetWebCharts\VBNetASP\scattersurface.aspx
(Click here on how to convert this code to code-behind style.)<%@ Page Language="VB" Debug="true" %>
<%@ Import Namespace="ChartDirector" %>
<%@ Register TagPrefix="chart" Namespace="ChartDirector" Assembly="netchartdir" %>
<!DOCTYPE html>
<script runat="server">
'
' Page Load event handler
'
Protected Sub Page_Load(ByVal sender As System.Object, ByVal e As System.EventArgs)
' The (x, y, z) coordinates of the scattered data
Dim dataX() As Double = {0.5, 1.9, 4.9, 1.0, 8.9, 9.8, 5.9, 2.9, 6.8, 9.0, 0.0, 8.9, 1.9, 4.8, _
2.4, 3.4, 7.9, 7.5, 4.8, 7.5, 9.5, 0.4, 8.9, 0.9, 5.4, 9.4, 2.9, 8.9, 0.9, 8.9, 10.0, 1.0, _
6.8, 3.8, 9.0, 5.3, 6.4, 4.9, 4.5, 2.0, 5.4, 0.0, 10.0, 3.9, 5.4, 5.9, 5.8, 0.3, 4.4, 8.3}
Dim dataY() As Double = {3.3, 3.0, 0.7, 1.0, 9.3, 4.5, 8.4, 0.1, 0.8, 0.1, 9.3, 1.8, 4.3, 1.3, _
2.3, 5.4, 6.9, 9.0, 9.8, 7.5, 1.8, 1.4, 4.5, 7.8, 3.8, 4.0, 2.9, 2.4, 3.9, 2.9, 2.3, 9.3, _
2.0, 3.4, 4.8, 2.3, 3.4, 2.3, 1.5, 7.8, 4.5, 0.9, 6.3, 2.4, 6.9, 2.8, 1.3, 2.9, 6.4, 6.3}
Dim dataZ() As Double = {6.6, 12.5, 7.4, 6.2, 9.6, 13.6, 19.9, 2.2, 6.9, 3.4, 8.7, 8.4, 7.8, _
8.0, 9.4, 11.9, 9.6, 15.7, 12.0, 13.3, 9.6, 6.4, 9.0, 6.9, 4.6, 9.7, 10.6, 9.2, 7.0, 6.9, _
9.7, 8.6, 8.0, 13.6, 13.2, 5.9, 9.0, 3.2, 8.3, 9.7, 8.2, 6.1, 8.7, 5.6, 14.9, 9.8, 9.3, _
5.1, 10.8, 9.8}
' Create a SurfaceChart object of size 680 x 550 pixels. Set background to brushed silver and
' border to grey (888888). Set the top-left and bottom-right corners to rounded corners with 20
' pixels radius.
Dim c As SurfaceChart = New SurfaceChart(680, 550, Chart.brushedSilverColor(), &H888888)
c.setRoundedFrame(&Hffffff, 20, 0, 20, 0)
' Add a title to the chart using 20 points Times New Roman Italic font. Set top/bottom margin to
' 8 pixels.
Dim title As ChartDirector.TextBox = c.addTitle("Surface Created Using Scattered Data Points", _
"Times New Roman Italic", 20)
title.setMargin2(0, 0, 8, 8)
' Add a 2 pixel wide black (000000) separator line under the title
c.addLine(10, title.getHeight(), c.getWidth() - 10, title.getHeight(), &H000000, 2)
' Set the center of the plot region at (290, 235), and set width x depth x height to 360 x 360 x
' 180 pixels
c.setPlotRegion(290, 235, 360, 360, 180)
' Set the elevation and rotation angles to 45 and -45 degrees
c.setViewAngle(45, -45)
' Set the perspective level to 30
c.setPerspective(30)
' Set the data to use to plot the chart
c.setData(dataX, dataY, dataZ)
' Add a color axis (the legend) in which the top right corner is anchored at (660, 80). Set the
' length to 200 pixels and the labels on the right side.
Dim cAxis As ColorAxis = c.setColorAxis(660, 80, Chart.TopRight, 200, Chart.Right)
' Set the color axis title with 12 points Arial Bold font
cAxis.setTitle("Z Title Placeholder", "Arial Bold", 12)
' Add a bounding box with light grey (eeeeee) background and grey (888888) border. Set the
' top-left and bottom-right corners to rounded corners of 10 pixels radius.
cAxis.setBoundingBox(&Heeeeee, &H888888)
cAxis.setRoundedCorners(10, 0, 10, 0)
' Set surface grid lines to semi-transparent black (cc000000)
c.setSurfaceAxisGrid(&Hcc000000)
' Set contour lines to semi-transparent white (80ffffff)
c.setContourColor(&H80ffffff)
' Set the walls to black in color
c.setWallColor(&H000000)
' Set the xyz major wall grid lines to white (ffffff), and minor wall grid lines to grey
' (888888)
c.setWallGrid(&Hffffff, &Hffffff, &Hffffff, &H888888, &H888888, &H888888)
' Set the wall thickness to 0
c.setWallThickness(0, 0, 0)
' Show only the xy wall, and hide the yz and zx walls.
c.setWallVisibility(True, False, False)
' Set the x, y and z axis titles using 12 points Arial Bold font
c.xAxis().setTitle("X Title<*br*>Placeholder", "Arial Bold", 12)
c.yAxis().setTitle("Y Title<*br*>Placeholder", "Arial Bold", 12)
' Output the chart
WebChartViewer1.Image = c.makeWebImage(Chart.SVG)
End Sub
</script>
<html>
<head>
<script type="text/javascript" src="cdjcv.js"></script>
</head>
<body>
<chart:WebChartViewer id="WebChartViewer1" runat="server" />
</body>
</html>
[ASP.NET MVC - Controller] NetMvcCharts\Controllers\ScattersurfaceController.cs
using System;
using System.Web.Mvc;
using ChartDirector;

namespace NetMvcCharts.Controllers
{
    public class ScattersurfaceController : Controller
    {
        //
        // Default Action
        //
        public ActionResult Index()
        {
            ViewBag.Title = "Scattered Data Surface Chart";
            createChart(ViewBag.Viewer = new RazorChartViewer(HttpContext, "chart1"));
            return View("~/Views/Shared/ChartView.cshtml");
        }

        //
        // Create chart
        //
        private void createChart(RazorChartViewer viewer)
        {
            // The (x, y, z) coordinates of the scattered data
            double[] dataX = {0.5, 1.9, 4.9, 1.0, 8.9, 9.8, 5.9, 2.9, 6.8, 9.0, 0.0, 8.9, 1.9, 4.8, 2.4,
                3.4, 7.9, 7.5, 4.8, 7.5, 9.5, 0.4, 8.9, 0.9, 5.4, 9.4, 2.9, 8.9, 0.9, 8.9, 10.0, 1.0,
                6.8, 3.8, 9.0, 5.3, 6.4, 4.9, 4.5, 2.0, 5.4, 0.0, 10.0, 3.9, 5.4, 5.9, 5.8, 0.3, 4.4, 8.3
                };
            double[] dataY = {3.3, 3.0, 0.7, 1.0, 9.3, 4.5, 8.4, 0.1, 0.8, 0.1, 9.3, 1.8, 4.3, 1.3, 2.3,
                5.4, 6.9, 9.0, 9.8, 7.5, 1.8, 1.4, 4.5, 7.8, 3.8, 4.0, 2.9, 2.4, 3.9, 2.9, 2.3, 9.3, 2.0,
                3.4, 4.8, 2.3, 3.4, 2.3, 1.5, 7.8, 4.5, 0.9, 6.3, 2.4, 6.9, 2.8, 1.3, 2.9, 6.4, 6.3};
            double[] dataZ = {6.6, 12.5, 7.4, 6.2, 9.6, 13.6, 19.9, 2.2, 6.9, 3.4, 8.7, 8.4, 7.8, 8.0,
                9.4, 11.9, 9.6, 15.7, 12.0, 13.3, 9.6, 6.4, 9.0, 6.9, 4.6, 9.7, 10.6, 9.2, 7.0, 6.9, 9.7,
                8.6, 8.0, 13.6, 13.2, 5.9, 9.0, 3.2, 8.3, 9.7, 8.2, 6.1, 8.7, 5.6, 14.9, 9.8, 9.3, 5.1,
                10.8, 9.8};

            // Create a SurfaceChart object of size 680 x 550 pixels. Set background to brushed silver
            // and border to grey (888888). Set the top-left and bottom-right corners to rounded corners
            // with 20 pixels radius.
            SurfaceChart c = new SurfaceChart(680, 550, Chart.brushedSilverColor(), 0x888888);
            c.setRoundedFrame(0xffffff, 20, 0, 20, 0);

            // Add a title to the chart using 20 points Times New Roman Italic font. Set top/bottom
            // margin to 8 pixels.
            ChartDirector.TextBox title = c.addTitle("Surface Created Using Scattered Data Points",
                "Times New Roman Italic", 20);
            title.setMargin2(0, 0, 8, 8);

            // Add a 2 pixel wide black (000000) separator line under the title
            c.addLine(10, title.getHeight(), c.getWidth() - 10, title.getHeight(), 0x000000, 2);

            // Set the center of the plot region at (290, 235), and set width x depth x height to 360 x
            // 360 x 180 pixels
            c.setPlotRegion(290, 235, 360, 360, 180);

            // Set the elevation and rotation angles to 45 and -45 degrees
            c.setViewAngle(45, -45);

            // Set the perspective level to 30
            c.setPerspective(30);

            // Set the data to use to plot the chart
            c.setData(dataX, dataY, dataZ);

            // Add a color axis (the legend) in which the top right corner is anchored at (660, 80). Set
            // the length to 200 pixels and the labels on the right side.
            ColorAxis cAxis = c.setColorAxis(660, 80, Chart.TopRight, 200, Chart.Right);

            // Set the color axis title with 12 points Arial Bold font
            cAxis.setTitle("Z Title Placeholder", "Arial Bold", 12);

            // Add a bounding box with light grey (eeeeee) background and grey (888888) border. Set the
            // top-left and bottom-right corners to rounded corners of  10 pixels radius.
            cAxis.setBoundingBox(0xeeeeee, 0x888888);
            cAxis.setRoundedCorners(10, 0, 10, 0);

            // Set surface grid lines to semi-transparent black (cc000000)
            c.setSurfaceAxisGrid(unchecked((int)0xcc000000));

            // Set contour lines to semi-transparent white (80ffffff)
            c.setContourColor(unchecked((int)0x80ffffff));

            // Set the walls to black in color
            c.setWallColor(0x000000);

            // Set the xyz major wall grid lines to white (ffffff), and minor wall grid lines to grey
            // (888888)
            c.setWallGrid(0xffffff, 0xffffff, 0xffffff, 0x888888, 0x888888, 0x888888);

            // Set the wall thickness to 0
            c.setWallThickness(0, 0, 0);

            // Show only the xy wall, and hide the yz and zx walls.
            c.setWallVisibility(true, false, false);

            // Set the x, y and z axis titles using 12 points Arial Bold font
            c.xAxis().setTitle("X Title\nPlaceholder", "Arial Bold", 12);
            c.yAxis().setTitle("Y Title\nPlaceholder", "Arial Bold", 12);

            // Output the chart
            viewer.Image = c.makeWebImage(Chart.SVG);
        }
    }
}
[ASP.NET MVC - View] NetMvcCharts\Views\Shared\ChartView.cshtml
@{ Layout = null; }

<!DOCTYPE html>

<html>
<head>
    <meta name="viewport" content="width=device-width" />
    <title>@ViewBag.Title</title>
    <style>
        @ViewBag.Style
    </style>
    @Scripts.Render("~/Scripts/cdjcv.js")
</head>
<body style="margin:5px 0px 0px 5px">
    <div style="font:bold 18pt verdana;">
        @ViewBag.Title
    </div>
    <hr style="border:solid 1px #000080; background:#000080" />
    <div>
        @{
            if (ViewBag.Viewer is Array)
            {
                // Display multiple charts
                for (int i = 0; i < ViewBag.Viewer.Length; ++i)
                {
                    @:@Html.Raw(ViewBag.Viewer[i].RenderHTML())
                }
            }
            else
            {
                // Display one chart only
                @:@Html.Raw(ViewBag.Viewer.RenderHTML())
            }
        }
    </div>
</body>
</html>
© 2023 Advanced Software Engineering Limited. All rights reserved.