ChartDirector 7.1 (.NET Edition)
Simple Clickable Charts
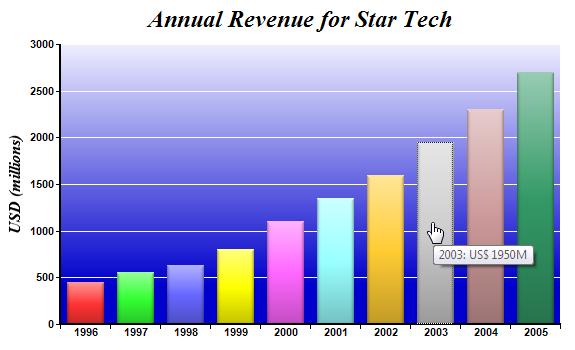
In this example, we will create a bar chart that displays the annual revenue of a company for the last 10 years. When a bar is clicked, the browser will load a line chart showing the monthly revenue for the selected year. When the line chart is clicked, the browser will load a pie chart showing the breakdown of the revenue for the selected month. When the pie chart is clicked, it will show the sector details in a web page.
The capability is often called "drill-down", because the user can get more details about an item by clicking on its representation on the chart.
Clickable Bar Chart
 [ASP.NET Web Forms - C# version]
 NetWebCharts\CSharpASP\clickbar.aspx
(Click here on how to convert this code to code-behind style.)<%@ Page Language="C#" Debug="true" %>
<%@ Import Namespace="ChartDirector" %>
<%@ Register TagPrefix="chart" Namespace="ChartDirector" Assembly="netchartdir" %>
<!DOCTYPE html>
<script runat="server">
//
// Page Load event handler
//
protected void Page_Load(object sender, EventArgs e)
{
// The data for the bar chart
double[] data = {450, 560, 630, 800, 1100, 1350, 1600, 1950, 2300, 2700};
// The labels for the bar chart
string[] labels = {"1996", "1997", "1998", "1999", "2000", "2001", "2002", "2003", "2004",
"2005"};
// Create a XYChart object of size 600 x 360 pixels
XYChart c = new XYChart(600, 360);
// Add a title to the chart using 18pt Times Bold Italic font
c.addTitle("Annual Revenue for Star Tech", "Times New Roman Bold Italic", 18);
// Set the plotarea at (60, 40) and of size 500 x 280 pixels. Use a vertical gradient color from
// light blue (eeeeff) to deep blue (0000cc) as background. Set border and grid lines to white
// (ffffff).
c.setPlotArea(60, 40, 500, 280, c.linearGradientColor(60, 40, 60, 280, 0xeeeeff, 0x0000cc), -1,
0xffffff, 0xffffff);
// Add a multi-color bar chart layer using the supplied data. Use soft lighting effect with
// light direction from top.
c.addBarLayer3(data).setBorderColor(Chart.Transparent, Chart.softLighting(Chart.Top));
// Set x axis labels using the given labels
c.xAxis().setLabels(labels);
// Draw the ticks between label positions (instead of at label positions)
c.xAxis().setTickOffset(0.5);
// When auto-scaling, use tick spacing of 40 pixels as a guideline
c.yAxis().setTickDensity(40);
// Add a title to the y axis with 12pt Times Bold Italic font
c.yAxis().setTitle("USD (millions)", "Times New Roman Bold Italic", 12);
// Set axis label style to 8pt Arial Bold
c.xAxis().setLabelStyle("Arial Bold", 8);
c.yAxis().setLabelStyle("Arial Bold", 8);
// Set axis line width to 2 pixels
c.xAxis().setWidth(2);
c.yAxis().setWidth(2);
// Output the chart
WebChartViewer1.Image = c.makeWebImage(Chart.SVG);
// Create an image map for the chart
WebChartViewer1.ImageMap = c.getHTMLImageMap("clickline.aspx", "",
"title='{xLabel}: US$ {value|0}M'");
}
</script>
<html>
<head>
<title>Simple Clickable Bar Chart</title>
<script type="text/javascript" src="cdjcv.js"></script>
</head>
<body style="margin:5px 0px 0px 5px">
<div style="font:bold 18pt verdana">
Simple Clickable Bar Chart
</div>
<hr style="border:solid 1px #000080; background:#000080" />
<div style="font:10pt verdana; margin-bottom:1.5em">
<a href='viewsource.aspx?file=<%=Request["SCRIPT_NAME"]%>'>View Source Code</a>
</div>
<chart:WebChartViewer id="WebChartViewer1" runat="server" />
</body>
</html>
[ASP.NET Web Forms - VB Version] NetWebCharts\VBNetASP\clickbar.aspx
(Click here on how to convert this code to code-behind style.)<%@ Page Language="VB" Debug="true" %>
<%@ Import Namespace="ChartDirector" %>
<%@ Register TagPrefix="chart" Namespace="ChartDirector" Assembly="netchartdir" %>
<!DOCTYPE html>
<script runat="server">
'
' Page Load event handler
'
Protected Sub Page_Load(ByVal sender As System.Object, ByVal e As System.EventArgs)
' The data for the bar chart
Dim data() As Double = {450, 560, 630, 800, 1100, 1350, 1600, 1950, 2300, 2700}
' The labels for the bar chart
Dim labels() As String = {"1996", "1997", "1998", "1999", "2000", "2001", "2002", "2003", _
"2004", "2005"}
' Create a XYChart object of size 600 x 360 pixels
Dim c As XYChart = New XYChart(600, 360)
' Add a title to the chart using 18pt Times Bold Italic font
c.addTitle("Annual Revenue for Star Tech", "Times New Roman Bold Italic", 18)
' Set the plotarea at (60, 40) and of size 500 x 280 pixels. Use a vertical gradient color from
' light blue (eeeeff) to deep blue (0000cc) as background. Set border and grid lines to white
' (ffffff).
c.setPlotArea(60, 40, 500, 280, c.linearGradientColor(60, 40, 60, 280, &Heeeeff, &H0000cc), _
-1, &Hffffff, &Hffffff)
' Add a multi-color bar chart layer using the supplied data. Use soft lighting effect with light
' direction from top.
c.addBarLayer3(data).setBorderColor(Chart.Transparent, Chart.softLighting(Chart.Top))
' Set x axis labels using the given labels
c.xAxis().setLabels(labels)
' Draw the ticks between label positions (instead of at label positions)
c.xAxis().setTickOffset(0.5)
' When auto-scaling, use tick spacing of 40 pixels as a guideline
c.yAxis().setTickDensity(40)
' Add a title to the y axis with 12pt Times Bold Italic font
c.yAxis().setTitle("USD (millions)", "Times New Roman Bold Italic", 12)
' Set axis label style to 8pt Arial Bold
c.xAxis().setLabelStyle("Arial Bold", 8)
c.yAxis().setLabelStyle("Arial Bold", 8)
' Set axis line width to 2 pixels
c.xAxis().setWidth(2)
c.yAxis().setWidth(2)
' Output the chart
WebChartViewer1.Image = c.makeWebImage(Chart.SVG)
' Create an image map for the chart
WebChartViewer1.ImageMap = c.getHTMLImageMap("clickline.aspx", "", _
"title='{xLabel}: US$ {value|0}M'")
End Sub
</script>
<html>
<head>
<title>Simple Clickable Bar Chart</title>
<script type="text/javascript" src="cdjcv.js"></script>
</head>
<body style="margin:5px 0px 0px 5px">
<div style="font:bold 18pt verdana">
Simple Clickable Bar Chart
</div>
<hr style="border:solid 1px #000080; background:#000080" />
<div style="font:10pt verdana; margin-bottom:1.5em">
<a href='viewsource.aspx?file=<%=Request("SCRIPT_NAME")%>'>View Source Code</a>
</div>
<chart:WebChartViewer id="WebChartViewer1" runat="server" />
</body>
</html>
[ASP.NET MVC - Controller] NetMvcCharts\Controllers\ClickbarController.cs
using System;
using System.Web.Mvc;
using ChartDirector;

namespace NetMvcCharts.Controllers
{
    public class ClickbarController : Controller
    {
        //
        // Default Action
        //
        public ActionResult Index()
        {
            ViewBag.Title = "Simple Clickable Bar Chart";
            createChart(ViewBag.Viewer = new RazorChartViewer(HttpContext, "chart1"));
            return View("~/Views/Shared/ChartView.cshtml");
        }

        //
        // Create chart
        //
        private void createChart(RazorChartViewer viewer)
        {
            // The data for the bar chart
            double[] data = {450, 560, 630, 800, 1100, 1350, 1600, 1950, 2300, 2700};

            // The labels for the bar chart
            string[] labels = {"1996", "1997", "1998", "1999", "2000", "2001", "2002", "2003", "2004",
                "2005"};

            // Create a XYChart object of size 600 x 360 pixels
            XYChart c = new XYChart(600, 360);

            // Add a title to the chart using 18pt Times Bold Italic font
            c.addTitle("Annual Revenue for Star Tech", "Times New Roman Bold Italic", 18);

            // Set the plotarea at (60, 40) and of size 500 x 280 pixels. Use a vertical gradient color
            // from light blue (eeeeff) to deep blue (0000cc) as background. Set border and grid lines to
            // white (ffffff).
            c.setPlotArea(60, 40, 500, 280, c.linearGradientColor(60, 40, 60, 280, 0xeeeeff, 0x0000cc),
                -1, 0xffffff, 0xffffff);

            // Add a multi-color bar chart layer using the supplied data. Use soft lighting effect with
            // light direction from top.
            c.addBarLayer3(data).setBorderColor(Chart.Transparent, Chart.softLighting(Chart.Top));

            // Set x axis labels using the given labels
            c.xAxis().setLabels(labels);

            // Draw the ticks between label positions (instead of at label positions)
            c.xAxis().setTickOffset(0.5);

            // When auto-scaling, use tick spacing of 40 pixels as a guideline
            c.yAxis().setTickDensity(40);

            // Add a title to the y axis with 12pt Times Bold Italic font
            c.yAxis().setTitle("USD (millions)", "Times New Roman Bold Italic", 12);

            // Set axis label style to 8pt Arial Bold
            c.xAxis().setLabelStyle("Arial Bold", 8);
            c.yAxis().setLabelStyle("Arial Bold", 8);

            // Set axis line width to 2 pixels
            c.xAxis().setWidth(2);
            c.yAxis().setWidth(2);

            // Output the chart
            viewer.Image = c.makeWebImage(Chart.SVG);

            // Create an image map for the chart
            viewer.ImageMap = c.getHTMLImageMap(Url.Action("", "Clickline"), "",
                "title='{xLabel}: US$ {value|0}M'");
        }
    }
}
[ASP.NET MVC - View] NetMvcCharts\Views\Shared\ChartView.cshtml
@{ Layout = null; }

<!DOCTYPE html>

<html>
<head>
    <meta name="viewport" content="width=device-width" />
    <title>@ViewBag.Title</title>
    <style>
        @ViewBag.Style
    </style>
    @Scripts.Render("~/Scripts/cdjcv.js")
</head>
<body style="margin:5px 0px 0px 5px">
    <div style="font:bold 18pt verdana;">
        @ViewBag.Title
    </div>
    <hr style="border:solid 1px #000080; background:#000080" />
    <div>
        @{
            if (ViewBag.Viewer is Array)
            {
                // Display multiple charts
                for (int i = 0; i < ViewBag.Viewer.Length; ++i)
                {
                    @:@Html.Raw(ViewBag.Viewer[i].RenderHTML())
                }
            }
            else
            {
                // Display one chart only
                @:@Html.Raw(ViewBag.Viewer.RenderHTML())
            }
        }
    </div>
</body>
</html>
The above code is quite similar to most of the sample codes in this documentation, so it will not be discussed in detail. The main difference is the code for creating the image map.
[ASP.NET Web Forms]WebChartViewer1.ImageMap = c.getHTMLImageMap("clickline.aspx", "", _
"title='{xLabel}: US$ {value|0}M'");
[ASP.NET MVC (Razor)]viewer.ImageMap = c.getHTMLImageMap(Url.Action("", "clickline"), "",
"title='{xLabel}: US$ {value|0}M'");
In the line above, the url parameter is set to "clickline.aspx" (ASP.NET Web Forms) or the "clickline" controller (ASP.NET MVC). The query parameter is left empty. When a bar is clicked, the browser will navigate to the url with the default query parameter (see
BaseChart.getHTMLImageMap). The query parameters are different for each bar and can be used to determine which bar has been clicked.
Clickable Line Chart
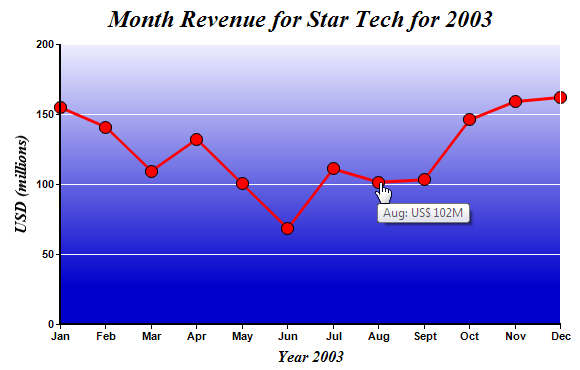
In the previous Clickable Bar Chart sample code, when a bar is clicked, "clickline.aspx" (ASP.NET Web Forms) or the "clickline" controller (ASP.NET MVC) will be invoked.
The code for the handler is listed below. It determines which year the user has clicked from query parameters. It then creates a clickable line chart for that year using "clickpie.aspx" (ASP.NET Web Forms) or the "clickpie" controller (ASP.NET MVC) as the click handler. As the code is similar to the Clickable Bar Chart, it will not be explained further.
[ASP.NET Web Forms - C# version] NetWebCharts\CSharpASP\clickline.aspx
(Click here on how to convert this code to code-behind style.)<%@ Page Language="C#" Debug="true" %>
<%@ Import Namespace="ChartDirector" %>
<%@ Register TagPrefix="chart" Namespace="ChartDirector" Assembly="netchartdir" %>
<!DOCTYPE html>
<script runat="server">
//
// Page Load event handler
//
protected void Page_Load(object sender, EventArgs e)
{
// Get the selected year.
string selectedYear = Request["xLabel"];
//
// In real life, the data may come from a database based on selectedYear. In this example, we
// just use a random number generator.
//
int seed = 50 + (int.Parse(selectedYear) - 1996) * 15;
RanTable rantable = new RanTable(seed, 1, 12);
rantable.setCol2(0, seed, -seed * 0.25, seed * 0.33, seed * 0.1, seed * 3);
double[] data = rantable.getCol(0);
//
// Now we obtain the data into arrays, we can start to draw the chart using ChartDirector
//
// Create a XYChart object of size 600 x 320 pixels
XYChart c = new XYChart(600, 360);
// Add a title to the chart using 18pt Times Bold Italic font
c.addTitle("Month Revenue for Star Tech for " + selectedYear, "Times New Roman Bold Italic", 18)
;
// Set the plotarea at (60, 40) and of size 500 x 280 pixels. Use a vertical gradient color from
// light blue (eeeeff) to deep blue (0000cc) as background. Set border and grid lines to white
// (ffffff).
c.setPlotArea(60, 40, 500, 280, c.linearGradientColor(60, 40, 60, 280, 0xeeeeff, 0x0000cc), -1,
0xffffff, 0xffffff);
// Add a red line (ff0000) chart layer using the data
ChartDirector.DataSet dataSet = c.addLineLayer().addDataSet(data, 0xff0000, "Revenue");
// Set the line width to 3 pixels
dataSet.setLineWidth(3);
// Use a 13 point circle symbol to plot the data points
dataSet.setDataSymbol(Chart.CircleSymbol, 13);
// Set the labels on the x axis. In this example, the labels must be Jan - Dec.
string[] labels = {"Jan", "Feb", "Mar", "Apr", "May", "Jun", "Jul", "Aug", "Sept", "Oct", "Nov",
"Dec"};
c.xAxis().setLabels(labels);
// When auto-scaling, use tick spacing of 40 pixels as a guideline
c.yAxis().setTickDensity(40);
// Add a title to the x axis to reflect the selected year
c.xAxis().setTitle("Year " + selectedYear, "Times New Roman Bold Italic", 12);
// Add a title to the y axis
c.yAxis().setTitle("USD (millions)", "Times New Roman Bold Italic", 12);
// Set axis label style to 8pt Arial Bold
c.xAxis().setLabelStyle("Arial Bold", 8);
c.yAxis().setLabelStyle("Arial Bold", 8);
// Set axis line width to 2 pixels
c.xAxis().setWidth(2);
c.yAxis().setWidth(2);
// Output the chart
WebChartViewer1.Image = c.makeWebImage(Chart.SVG);
// Create an image map for the chart
WebChartViewer1.ImageMap = c.getHTMLImageMap("clickpie.aspx?year=" + selectedYear, "",
"title='{xLabel}: US$ {value|0}M'");
}
</script>
<html>
<head>
<title>Simple Clickable Line Chart</title>
<script type="text/javascript" src="cdjcv.js"></script>
</head>
<body style="margin:5px 0px 0px 5px">
<div style="font:bold 18pt verdana">
Simple Clickable Line Chart
</div>
<hr style="border:solid 1px #000080; background:#000080" />
<div style="font:10pt verdana; margin-bottom:1.5em">
<a href='viewsource.aspx?file=<%=Request["SCRIPT_NAME"]%>'>View Source Code</a>
</div>
<chart:WebChartViewer id="WebChartViewer1" runat="server" />
</body>
</html>
[ASP.NET Web Forms - VB Version] NetWebCharts\VBNetASP\clickline.aspx
(Click here on how to convert this code to code-behind style.)<%@ Page Language="VB" Debug="true" %>
<%@ Import Namespace="ChartDirector" %>
<%@ Register TagPrefix="chart" Namespace="ChartDirector" Assembly="netchartdir" %>
<!DOCTYPE html>
<script runat="server">
'
' Page Load event handler
'
Protected Sub Page_Load(ByVal sender As System.Object, ByVal e As System.EventArgs)
' Get the selected year.
Dim selectedYear As String = Request("xLabel")
'
' In real life, the data may come from a database based on selectedYear. In this example, we
' just use a random number generator.
'
Dim seed As Integer = 50 + (CInt(selectedYear) - 1996) * 15
Dim rantable As RanTable = New RanTable(seed, 1, 12)
rantable.setCol2(0, seed, -seed * 0.25, seed * 0.33, seed * 0.1, seed * 3)
Dim data() As Double = rantable.getCol(0)
'
' Now we obtain the data into arrays, we can start to draw the chart using ChartDirector
'
' Create a XYChart object of size 600 x 320 pixels
Dim c As XYChart = New XYChart(600, 360)
' Add a title to the chart using 18pt Times Bold Italic font
c.addTitle("Month Revenue for Star Tech for " & selectedYear, "Times New Roman Bold Italic", _
18)
' Set the plotarea at (60, 40) and of size 500 x 280 pixels. Use a vertical gradient color from
' light blue (eeeeff) to deep blue (0000cc) as background. Set border and grid lines to white
' (ffffff).
c.setPlotArea(60, 40, 500, 280, c.linearGradientColor(60, 40, 60, 280, &Heeeeff, &H0000cc), _
-1, &Hffffff, &Hffffff)
' Add a red line (ff0000) chart layer using the data
Dim dataSet As ChartDirector.DataSet = c.addLineLayer().addDataSet(data, &Hff0000, "Revenue")
' Set the line width to 3 pixels
dataSet.setLineWidth(3)
' Use a 13 point circle symbol to plot the data points
dataSet.setDataSymbol(Chart.CircleSymbol, 13)
' Set the labels on the x axis. In this example, the labels must be Jan - Dec.
Dim labels() As String = {"Jan", "Feb", "Mar", "Apr", "May", "Jun", "Jul", "Aug", "Sept", _
"Oct", "Nov", "Dec"}
c.xAxis().setLabels(labels)
' When auto-scaling, use tick spacing of 40 pixels as a guideline
c.yAxis().setTickDensity(40)
' Add a title to the x axis to reflect the selected year
c.xAxis().setTitle("Year " & selectedYear, "Times New Roman Bold Italic", 12)
' Add a title to the y axis
c.yAxis().setTitle("USD (millions)", "Times New Roman Bold Italic", 12)
' Set axis label style to 8pt Arial Bold
c.xAxis().setLabelStyle("Arial Bold", 8)
c.yAxis().setLabelStyle("Arial Bold", 8)
' Set axis line width to 2 pixels
c.xAxis().setWidth(2)
c.yAxis().setWidth(2)
' Output the chart
WebChartViewer1.Image = c.makeWebImage(Chart.SVG)
' Create an image map for the chart
WebChartViewer1.ImageMap = c.getHTMLImageMap("clickpie.aspx?year=" & selectedYear, "", _
"title='{xLabel}: US$ {value|0}M'")
End Sub
</script>
<html>
<head>
<title>Simple Clickable Line Chart</title>
<script type="text/javascript" src="cdjcv.js"></script>
</head>
<body style="margin:5px 0px 0px 5px">
<div style="font:bold 18pt verdana">
Simple Clickable Line Chart
</div>
<hr style="border:solid 1px #000080; background:#000080" />
<div style="font:10pt verdana; margin-bottom:1.5em">
<a href='viewsource.aspx?file=<%=Request("SCRIPT_NAME")%>'>View Source Code</a>
</div>
<chart:WebChartViewer id="WebChartViewer1" runat="server" />
</body>
</html>
[ASP.NET MVC - Controller] NetMvcCharts\Controllers\ClicklineController.cs
using System;
using System.Web.Mvc;
using ChartDirector;

namespace NetMvcCharts.Controllers
{
    public class ClicklineController : Controller
    {
        //
        // Default Action
        //
        public ActionResult Index()
        {
            ViewBag.Title = "Simple Clickable Line Chart";
            createChart(ViewBag.Viewer = new RazorChartViewer(HttpContext, "chart1"));
            return View("~/Views/Shared/ChartView.cshtml");
        }

        //
        // Create chart
        //
        private void createChart(RazorChartViewer viewer)
        {
            // Get the selected year.
            string selectedYear = Request["xLabel"];

            //
            // In real life, the data may come from a database based on selectedYear. In this example, we
            // just use a random number generator.
            //
            int seed = 50 + (int.Parse(selectedYear) - 1996) * 15;
            RanTable rantable = new RanTable(seed, 1, 12);
            rantable.setCol2(0, seed, -seed * 0.25, seed * 0.33, seed * 0.1, seed * 3);

            double[] data = rantable.getCol(0);

            //
            // Now we obtain the data into arrays, we can start to draw the chart using ChartDirector
            //

            // Create a XYChart object of size 600 x 320 pixels
            XYChart c = new XYChart(600, 360);

            // Add a title to the chart using 18pt Times Bold Italic font
            c.addTitle("Month Revenue for Star Tech for " + selectedYear, "Times New Roman Bold Italic",
                18);

            // Set the plotarea at (60, 40) and of size 500 x 280 pixels. Use a vertical gradient color
            // from light blue (eeeeff) to deep blue (0000cc) as background. Set border and grid lines to
            // white (ffffff).
            c.setPlotArea(60, 40, 500, 280, c.linearGradientColor(60, 40, 60, 280, 0xeeeeff, 0x0000cc),
                -1, 0xffffff, 0xffffff);

            // Add a red line (ff0000) chart layer using the data
            ChartDirector.DataSet dataSet = c.addLineLayer().addDataSet(data, 0xff0000, "Revenue");

            // Set the line width to 3 pixels
            dataSet.setLineWidth(3);

            // Use a 13 point circle symbol to plot the data points
            dataSet.setDataSymbol(Chart.CircleSymbol, 13);

            // Set the labels on the x axis. In this example, the labels must be Jan - Dec.
            string[] labels = {"Jan", "Feb", "Mar", "Apr", "May", "Jun", "Jul", "Aug", "Sept", "Oct",
                "Nov", "Dec"};
            c.xAxis().setLabels(labels);

            // When auto-scaling, use tick spacing of 40 pixels as a guideline
            c.yAxis().setTickDensity(40);

            // Add a title to the x axis to reflect the selected year
            c.xAxis().setTitle("Year " + selectedYear, "Times New Roman Bold Italic", 12);

            // Add a title to the y axis
            c.yAxis().setTitle("USD (millions)", "Times New Roman Bold Italic", 12);

            // Set axis label style to 8pt Arial Bold
            c.xAxis().setLabelStyle("Arial Bold", 8);
            c.yAxis().setLabelStyle("Arial Bold", 8);

            // Set axis line width to 2 pixels
            c.xAxis().setWidth(2);
            c.yAxis().setWidth(2);

            // Output the chart
            viewer.Image = c.makeWebImage(Chart.SVG);

            // Create an image map for the chart
            viewer.ImageMap = c.getHTMLImageMap(
                Url.Action("", "Clickpie", new { year = selectedYear }), "",
                "title='{xLabel}: US$ {value|0}M'");
        }
    }
}
[ASP.NET MVC - View] NetMvcCharts\Views\Shared\ChartView.cshtml
@{ Layout = null; }

<!DOCTYPE html>

<html>
<head>
    <meta name="viewport" content="width=device-width" />
    <title>@ViewBag.Title</title>
    <style>
        @ViewBag.Style
    </style>
    @Scripts.Render("~/Scripts/cdjcv.js")
</head>
<body style="margin:5px 0px 0px 5px">
    <div style="font:bold 18pt verdana;">
        @ViewBag.Title
    </div>
    <hr style="border:solid 1px #000080; background:#000080" />
    <div>
        @{
            if (ViewBag.Viewer is Array)
            {
                // Display multiple charts
                for (int i = 0; i < ViewBag.Viewer.Length; ++i)
                {
                    @:@Html.Raw(ViewBag.Viewer[i].RenderHTML())
                }
            }
            else
            {
                // Display one chart only
                @:@Html.Raw(ViewBag.Viewer.RenderHTML())
            }
        }
    </div>
</body>
</html>
Clickable Pie Chart
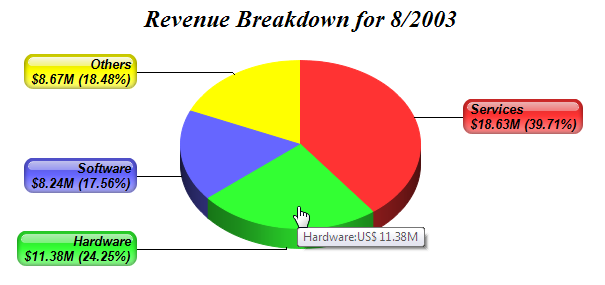
In the previous Clickable Line Chart sample code, when a line is clicked, "clickpie.aspx" (ASP.NET Web Forms) or the "clickpie" controller (ASP.NET MVC) will be invoked.
The code for the handler is listed below. It determines which year and month the user has clicked from query parameters. It then creates a clickable pie chart for that year and month, using "piestub.aspx" (ASP.NET Web Forms) or the "piestub" controller (ASP.NET MVC) as the click handler. As the code is very similar to the Clickable Bar Chart, it will not be explained further.
[ASP.NET Web Forms - C# version] NetWebCharts\CSharpASP\clickpie.aspx
(Click here on how to convert this code to code-behind style.)<%@ Page Language="C#" Debug="true" %>
<%@ Import Namespace="ChartDirector" %>
<%@ Register TagPrefix="chart" Namespace="ChartDirector" Assembly="netchartdir" %>
<!DOCTYPE html>
<script runat="server">
//
// Page Load event handler
//
protected void Page_Load(object sender, EventArgs e)
{
// Get the selected year and month
int selectedYear = int.Parse(Request["year"]);
int selectedMonth = int.Parse(Request["x"]) + 1;
//
// In real life, the data may come from a database based on selectedYear. In this example, we
// just use a random number generator.
//
int seed = (selectedYear - 1992) * (100 + 3 * selectedMonth);
RanTable rantable = new RanTable(seed, 1, 4);
rantable.setCol(0, seed * 0.003, seed * 0.017);
double[] data = rantable.getCol(0);
// The labels for the pie chart
string[] labels = {"Services", "Hardware", "Software", "Others"};
// Create a PieChart object of size 600 x 240 pixels
PieChart c = new PieChart(600, 280);
// Set the center of the pie at (300, 140) and the radius to 120 pixels
c.setPieSize(300, 140, 120);
// Add a title to the pie chart using 18pt Times Bold Italic font
c.addTitle("Revenue Breakdown for " + selectedMonth + "/" + selectedYear,
"Times New Roman Bold Italic", 18);
// Draw the pie in 3D with 20 pixels 3D depth
c.set3D(20);
// Set label format to display sector label, value and percentage in two lines
c.setLabelFormat("{label}<*br*>${value|2}M ({percent}%)");
// Set label style to 10pt Arial Bold Italic font. Set background color to the same as the
// sector color, with reduced-glare glass effect and rounded corners.
ChartDirector.TextBox t = c.setLabelStyle("Arial Bold Italic", 10);
t.setBackground(Chart.SameAsMainColor, Chart.Transparent, Chart.glassEffect(Chart.ReducedGlare))
;
t.setRoundedCorners();
// Use side label layout method
c.setLabelLayout(Chart.SideLayout);
// Set the pie data and the pie labels
c.setData(data, labels);
// Output the chart
WebChartViewer1.Image = c.makeWebImage(Chart.SVG);
// Create an image map for the chart
WebChartViewer1.ImageMap = c.getHTMLImageMap("piestub.aspx", "",
"title='{label}:US$ {value|2}M'");
}
</script>
<html>
<head>
<title>Simple Clickable Pie Chart</title>
<script type="text/javascript" src="cdjcv.js"></script>
</head>
<body style="margin:5px 0px 0px 5px">
<div style="font:bold 18pt verdana">
Simple Clickable Pie Chart
</div>
<hr style="border:solid 1px #000080; background:#000080" />
<div style="font:10pt verdana; margin-bottom:1.5em">
<a href='viewsource.aspx?file=<%=Request["SCRIPT_NAME"]%>'>View Source Code</a>
</div>
<chart:WebChartViewer id="WebChartViewer1" runat="server" />
</body>
</html>
[ASP.NET Web Forms - VB Version] NetWebCharts\VBNetASP\clickpie.aspx
(Click here on how to convert this code to code-behind style.)<%@ Page Language="VB" Debug="true" %>
<%@ Import Namespace="ChartDirector" %>
<%@ Register TagPrefix="chart" Namespace="ChartDirector" Assembly="netchartdir" %>
<!DOCTYPE html>
<script runat="server">
'
' Page Load event handler
'
Protected Sub Page_Load(ByVal sender As System.Object, ByVal e As System.EventArgs)
' Get the selected year and month
Dim selectedYear As Integer = CInt(Request("year"))
Dim selectedMonth As Integer = CInt(Request("x")) + 1
'
' In real life, the data may come from a database based on selectedYear. In this example, we
' just use a random number generator.
'
Dim seed As Integer = (selectedYear - 1992) * (100 + 3 * selectedMonth)
Dim rantable As RanTable = New RanTable(seed, 1, 4)
rantable.setCol(0, seed * 0.003, seed * 0.017)
Dim data() As Double = rantable.getCol(0)
' The labels for the pie chart
Dim labels() As String = {"Services", "Hardware", "Software", "Others"}
' Create a PieChart object of size 600 x 240 pixels
Dim c As PieChart = New PieChart(600, 280)
' Set the center of the pie at (300, 140) and the radius to 120 pixels
c.setPieSize(300, 140, 120)
' Add a title to the pie chart using 18pt Times Bold Italic font
c.addTitle("Revenue Breakdown for " & selectedMonth & "/" & selectedYear, _
"Times New Roman Bold Italic", 18)
' Draw the pie in 3D with 20 pixels 3D depth
c.set3D(20)
' Set label format to display sector label, value and percentage in two lines
c.setLabelFormat("{label}<*br*>${value|2}M ({percent}%)")
' Set label style to 10pt Arial Bold Italic font. Set background color to the same as the sector
' color, with reduced-glare glass effect and rounded corners.
Dim t As ChartDirector.TextBox = c.setLabelStyle("Arial Bold Italic", 10)
t.setBackground(Chart.SameAsMainColor, Chart.Transparent, Chart.glassEffect(Chart.ReducedGlare))
t.setRoundedCorners()
' Use side label layout method
c.setLabelLayout(Chart.SideLayout)
' Set the pie data and the pie labels
c.setData(data, labels)
' Output the chart
WebChartViewer1.Image = c.makeWebImage(Chart.SVG)
' Create an image map for the chart
WebChartViewer1.ImageMap = c.getHTMLImageMap("piestub.aspx", "", _
"title='{label}:US$ {value|2}M'")
End Sub
</script>
<html>
<head>
<title>Simple Clickable Pie Chart</title>
<script type="text/javascript" src="cdjcv.js"></script>
</head>
<body style="margin:5px 0px 0px 5px">
<div style="font:bold 18pt verdana">
Simple Clickable Pie Chart
</div>
<hr style="border:solid 1px #000080; background:#000080" />
<div style="font:10pt verdana; margin-bottom:1.5em">
<a href='viewsource.aspx?file=<%=Request("SCRIPT_NAME")%>'>View Source Code</a>
</div>
<chart:WebChartViewer id="WebChartViewer1" runat="server" />
</body>
</html>
[ASP.NET MVC - Controller] NetMvcCharts\Controllers\ClickpieController.cs
using System;
using System.Web.Mvc;
using ChartDirector;

namespace NetMvcCharts.Controllers
{
    public class ClickpieController : Controller
    {
        //
        // Default Action
        //
        public ActionResult Index()
        {
            ViewBag.Title = "Simple Clickable Pie Chart";
            createChart(ViewBag.Viewer = new RazorChartViewer(HttpContext, "chart1"));
            return View("~/Views/Shared/ChartView.cshtml");
        }

        //
        // Create chart
        //
        private void createChart(RazorChartViewer viewer)
        {
            // Get the selected year and month
            int selectedYear = int.Parse(Request["year"]);
            int selectedMonth = int.Parse(Request["x"]) + 1;

            //
            // In real life, the data may come from a database based on selectedYear. In this example, we
            // just use a random number generator.
            //
            int seed = (selectedYear - 1992) * (100 + 3 * selectedMonth);
            RanTable rantable = new RanTable(seed, 1, 4);
            rantable.setCol(0, seed * 0.003, seed * 0.017);

            double[] data = rantable.getCol(0);

            // The labels for the pie chart
            string[] labels = {"Services", "Hardware", "Software", "Others"};

            // Create a PieChart object of size 600 x 240 pixels
            PieChart c = new PieChart(600, 280);

            // Set the center of the pie at (300, 140) and the radius to 120 pixels
            c.setPieSize(300, 140, 120);

            // Add a title to the pie chart using 18pt Times Bold Italic font
            c.addTitle("Revenue Breakdown for " + selectedMonth + "/" + selectedYear,
                "Times New Roman Bold Italic", 18);

            // Draw the pie in 3D with 20 pixels 3D depth
            c.set3D(20);

            // Set label format to display sector label, value and percentage in two lines
            c.setLabelFormat("{label}<*br*>${value|2}M ({percent}%)");

            // Set label style to 10pt Arial Bold Italic font. Set background color to the same as the
            // sector color, with reduced-glare glass effect and rounded corners.
            ChartDirector.TextBox t = c.setLabelStyle("Arial Bold Italic", 10);
            t.setBackground(Chart.SameAsMainColor, Chart.Transparent, Chart.glassEffect(
                Chart.ReducedGlare));
            t.setRoundedCorners();

            // Use side label layout method
            c.setLabelLayout(Chart.SideLayout);

            // Set the pie data and the pie labels
            c.setData(data, labels);

            // Output the chart
            viewer.Image = c.makeWebImage(Chart.SVG);

            // Create an image map for the chart
            viewer.ImageMap = c.getHTMLImageMap(Url.Action("", "Piestub"), "",
                "title='{label}:US$ {value|2}M'");
        }
    }
}
[ASP.NET MVC - View] NetMvcCharts\Views\Shared\ChartView.cshtml
@{ Layout = null; }

<!DOCTYPE html>

<html>
<head>
    <meta name="viewport" content="width=device-width" />
    <title>@ViewBag.Title</title>
    <style>
        @ViewBag.Style
    </style>
    @Scripts.Render("~/Scripts/cdjcv.js")
</head>
<body style="margin:5px 0px 0px 5px">
    <div style="font:bold 18pt verdana;">
        @ViewBag.Title
    </div>
    <hr style="border:solid 1px #000080; background:#000080" />
    <div>
        @{
            if (ViewBag.Viewer is Array)
            {
                // Display multiple charts
                for (int i = 0; i < ViewBag.Viewer.Length; ++i)
                {
                    @:@Html.Raw(ViewBag.Viewer[i].RenderHTML())
                }
            }
            else
            {
                // Display one chart only
                @:@Html.Raw(ViewBag.Viewer.RenderHTML())
            }
        }
    </div>
</body>
</html>
Clickable Pie Chart Handler
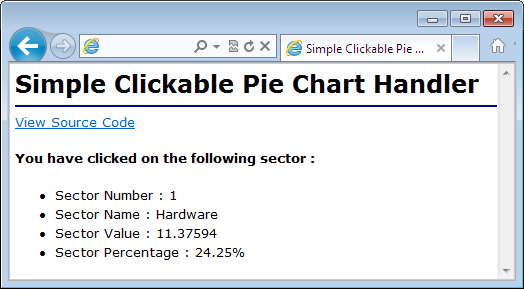
In the previous Clickable Pie Chart sample code, when a sector is clicked, "piestub.aspx" (ASP.NET Web Forms) or the "piestub" controller (ASP.NET MVC) will be invoked. Its code is listed below. In this example, it simply displays some data about the sector.
[ASP.NET Web Forms - C# version] NetWebCharts\CSharpASP\piestub.aspx
(Click here on how to convert this code to code-behind style.)<%@ Language="C#" Debug="true" %>
<!DOCTYPE html>
<html>
<head>
<title>Simple Clickable Pie Chart Handler</title>
</head>
<body style="margin:5px 0px 0px 5px">
<div style="font:bold 18pt verdana;">
Simple Clickable Pie Chart Handler
</div>
<hr style="border:solid 1px #000080" />
<div style="font:10pt verdana; margin-bottom:20px">
<a href="viewsource.aspx?file=<%=Request["SCRIPT_NAME"]%>">View Source Code</a>
</div>
<div style="font:10pt verdana;">
<b>You have clicked on the following sector :</b><br />
<ul>
<li>Sector Number : <%=Request["sector"]%></li>
<li>Sector Name : <%=Request["label"]%></li>
<li>Sector Value : <%=Request["value"]%></li>
<li>Sector Percentage : <%=Request["percent"]%>%</li>
</ul>
</div>
</body>
</html>
[ASP.NET Web Forms - VB Version] NetWebCharts\VBNetASP\piestub.aspx
(Click here on how to convert this code to code-behind style.)<%@ Language="VB" Debug="true" %>
<!DOCTYPE html>
<html>
<head>
<title>Simple Clickable Pie Chart Handler</title>
</head>
<body style="margin:5px 0px 0px 5px">
<div style="font:bold 18pt verdana;">
Simple Clickable Pie Chart Handler
</div>
<hr style="border:solid 1px #000080" />
<div style="font:10pt verdana; margin-bottom:20px">
<a href="viewsource.aspx?file=<%=Request("SCRIPT_NAME")%>">View Source Code</a>
</div>
<div style="font:10pt verdana;">
<b>You have clicked on the following sector :</b><br />
<ul>
<li>Sector Number : <%=Request("sector")%></li>
<li>Sector Name : <%=Request("label")%></li>
<li>Sector Value : <%=Request("value")%></li>
<li>Sector Percentage : <%=Request("percent")%>%</li>
</ul>
</div>
</body>
</html>
[ASP.NET MVC - Controller] NetMvcCharts\Controllers\PiestubController.cs
using System.Web.Mvc;

namespace NetMvcCharts.Controllers
{
    public class PiestubController : Controller
    {
        public ActionResult Index()
        {
            return View();
        }
    }
}
[ASP.NET MVC - View] NetMvcCharts\Views\Piestub\Index.cshtml
@{ Layout = null; }

<!DOCTYPE html>
<html>
<head>
    <title>Simple Clickable Pie Chart Handler</title>
</head>
<body style="margin:5px 0px 0px 5px">
<div style="font:bold 18pt verdana;">
    Simple Clickable Pie Chart Handler
</div>
<hr style="border:solid 1px #000080" />
<div style="font:10pt verdana;">
<b>You have clicked on the following sector :</b><br />
<ul>
    <li>Sector Number : @Request["sector"]</li>
    <li>Sector Name : @Request["label"]</li>
    <li>Sector Value : @Request["value"]</li>
    <li>Sector Percentage : @Request["percent"]%</li>
</ul>
</div>
</body>
</html>
© 2023 Advanced Software Engineering Limited. All rights reserved.