[Windows Forms - C# version] NetWinCharts\CSharpWinCharts\softmultibar.cs
using System;
using ChartDirector;
namespace CSharpChartExplorer
{
public class softmultibar : DemoModule
{
//Name of demo module
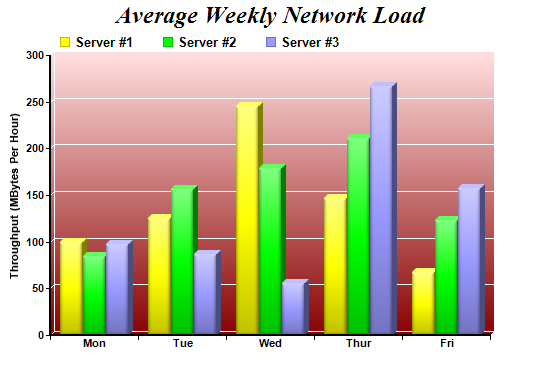
public string getName() { return "Soft Multi-Bar Chart"; }
//Number of charts produced in this demo module
public int getNoOfCharts() { return 1; }
//Main code for creating chart.
//Note: the argument chartIndex is unused because this demo only has 1 chart.
public void createChart(WinChartViewer viewer, int chartIndex)
{
// The data for the bar chart
double[] data0 = {100, 125, 245, 147, 67};
double[] data1 = {85, 156, 179, 211, 123};
double[] data2 = {97, 87, 56, 267, 157};
string[] labels = {"Mon", "Tue", "Wed", "Thur", "Fri"};
// Create a XYChart object of size 540 x 375 pixels
XYChart c = new XYChart(540, 375);
// Add a title to the chart using 18pt Times Bold Italic font
c.addTitle("Average Weekly Network Load", "Times New Roman Bold Italic", 18);
// Set the plotarea at (50, 55) and of 440 x 280 pixels in size. Use a vertical gradient
// color from light red (ffdddd) to dark red (880000) as background. Set border and grid
// lines to white (ffffff).
c.setPlotArea(50, 55, 440, 280, c.linearGradientColor(0, 55, 0, 335, 0xffdddd, 0x880000
), -1, 0xffffff, 0xffffff);
// Add a legend box at (50, 25) using horizontal layout. Use 10pt Arial Bold as font,
// with transparent background.
c.addLegend(50, 25, false, "Arial Bold", 10).setBackground(Chart.Transparent);
// Set the x axis labels
c.xAxis().setLabels(labels);
// Draw the ticks between label positions (instead of at label positions)
c.xAxis().setTickOffset(0.5);
// Set axis label style to 8pt Arial Bold
c.xAxis().setLabelStyle("Arial Bold", 8);
c.yAxis().setLabelStyle("Arial Bold", 8);
// Set axis line width to 2 pixels
c.xAxis().setWidth(2);
c.yAxis().setWidth(2);
// Add axis title
c.yAxis().setTitle("Throughput (MBytes Per Hour)");
// Add a multi-bar layer with 3 data sets and 4 pixels 3D depth
BarLayer layer = c.addBarLayer2(Chart.Side, 4);
layer.addDataSet(data0, 0xffff00, "Server #1");
layer.addDataSet(data1, 0x00ff00, "Server #2");
layer.addDataSet(data2, 0x9999ff, "Server #3");
// Set bar border to transparent. Use soft lighting effect with light direction from
// top.
layer.setBorderColor(Chart.Transparent, Chart.softLighting(Chart.Top));
// Configure the bars within a group to touch each others (no gap)
layer.setBarGap(0.2, Chart.TouchBar);
// Output the chart
viewer.Chart = c;
//include tool tip for the chart
viewer.ImageMap = c.getHTMLImageMap("clickable", "",
"title='{dataSetName} on {xLabel}: {value} MBytes/hour'");
}
}
}
[Windows Forms - VB Version] NetWinCharts\VBNetWinCharts\softmultibar.vb
Imports System
Imports Microsoft.VisualBasic
Imports ChartDirector

Public Class softmultibar
    Implements DemoModule

    'Name of demo module
    Public Function getName() As String Implements DemoModule.getName
        Return "Soft Multi-Bar Chart"
    End Function

    'Number of charts produced in this demo module
    Public Function getNoOfCharts() As Integer Implements DemoModule.getNoOfCharts
        Return 1
    End Function

    'Main code for creating chart.
    'Note: the argument chartIndex is unused because this demo only has 1 chart.
    Public Sub createChart(viewer As WinChartViewer, chartIndex As Integer) _
        Implements DemoModule.createChart

        ' The data for the bar chart
        Dim data0() As Double = {100, 125, 245, 147, 67}
        Dim data1() As Double = {85, 156, 179, 211, 123}
        Dim data2() As Double = {97, 87, 56, 267, 157}
        Dim labels() As String = {"Mon", "Tue", "Wed", "Thur", "Fri"}

        ' Create a XYChart object of size 540 x 375 pixels
        Dim c As XYChart = New XYChart(540, 375)

        ' Add a title to the chart using 18pt Times Bold Italic font
        c.addTitle("Average Weekly Network Load", "Times New Roman Bold Italic", 18)

        ' Set the plotarea at (50, 55) and of 440 x 280 pixels in size. Use a vertical gradient
        ' color from light red (ffdddd) to dark red (880000) as background. Set border and grid
        ' lines to white (ffffff).
        c.setPlotArea(50, 55, 440, 280, c.linearGradientColor(0, 55, 0, 335, &Hffdddd, &H880000), _
            -1, &Hffffff, &Hffffff)

        ' Add a legend box at (50, 25) using horizontal layout. Use 10pt Arial Bold as font, with
        ' transparent background.
        c.addLegend(50, 25, False, "Arial Bold", 10).setBackground(Chart.Transparent)

        ' Set the x axis labels
        c.xAxis().setLabels(labels)

        ' Draw the ticks between label positions (instead of at label positions)
        c.xAxis().setTickOffset(0.5)

        ' Set axis label style to 8pt Arial Bold
        c.xAxis().setLabelStyle("Arial Bold", 8)
        c.yAxis().setLabelStyle("Arial Bold", 8)

        ' Set axis line width to 2 pixels
        c.xAxis().setWidth(2)
        c.yAxis().setWidth(2)

        ' Add axis title
        c.yAxis().setTitle("Throughput (MBytes Per Hour)")

        ' Add a multi-bar layer with 3 data sets and 4 pixels 3D depth
        Dim layer As BarLayer = c.addBarLayer2(Chart.Side, 4)
        layer.addDataSet(data0, &Hffff00, "Server #1")
        layer.addDataSet(data1, &H00ff00, "Server #2")
        layer.addDataSet(data2, &H9999ff, "Server #3")

        ' Set bar border to transparent. Use soft lighting effect with light direction from top.
        layer.setBorderColor(Chart.Transparent, Chart.softLighting(Chart.Top))

        ' Configure the bars within a group to touch each others (no gap)
        layer.setBarGap(0.2, Chart.TouchBar)

        ' Output the chart
        viewer.Chart = c

        'include tool tip for the chart
        viewer.ImageMap = c.getHTMLImageMap("clickable", "", _
            "title='{dataSetName} on {xLabel}: {value} MBytes/hour'")

    End Sub

End Class
[WPF - C#] NetWPFCharts\CSharpWPFCharts\softmultibar.cs
using System;
using ChartDirector;

namespace CSharpWPFCharts
{
    public class softmultibar : DemoModule
    {
        //Name of demo module
        public string getName() { return "Soft Multi-Bar Chart"; }

        //Number of charts produced in this demo module
        public int getNoOfCharts() { return 1; }

        //Main code for creating chart.
        //Note: the argument chartIndex is unused because this demo only has 1 chart.
        public void createChart(WPFChartViewer viewer, int chartIndex)
        {
            // The data for the bar chart
            double[] data0 = {100, 125, 245, 147, 67};
            double[] data1 = {85, 156, 179, 211, 123};
            double[] data2 = {97, 87, 56, 267, 157};
            string[] labels = {"Mon", "Tue", "Wed", "Thur", "Fri"};

            // Create a XYChart object of size 540 x 375 pixels
            XYChart c = new XYChart(540, 375);

            // Add a title to the chart using 18pt Times Bold Italic font
            c.addTitle("Average Weekly Network Load", "Times New Roman Bold Italic", 18);

            // Set the plotarea at (50, 55) and of 440 x 280 pixels in size. Use a vertical gradient
            // color from light red (ffdddd) to dark red (880000) as background. Set border and grid
            // lines to white (ffffff).
            c.setPlotArea(50, 55, 440, 280, c.linearGradientColor(0, 55, 0, 335, 0xffdddd, 0x880000
                ), -1, 0xffffff, 0xffffff);

            // Add a legend box at (50, 25) using horizontal layout. Use 10pt Arial Bold as font,
            // with transparent background.
            c.addLegend(50, 25, false, "Arial Bold", 10).setBackground(Chart.Transparent);

            // Set the x axis labels
            c.xAxis().setLabels(labels);

            // Draw the ticks between label positions (instead of at label positions)
            c.xAxis().setTickOffset(0.5);

            // Set axis label style to 8pt Arial Bold
            c.xAxis().setLabelStyle("Arial Bold", 8);
            c.yAxis().setLabelStyle("Arial Bold", 8);

            // Set axis line width to 2 pixels
            c.xAxis().setWidth(2);
            c.yAxis().setWidth(2);

            // Add axis title
            c.yAxis().setTitle("Throughput (MBytes Per Hour)");

            // Add a multi-bar layer with 3 data sets and 4 pixels 3D depth
            BarLayer layer = c.addBarLayer2(Chart.Side, 4);
            layer.addDataSet(data0, 0xffff00, "Server #1");
            layer.addDataSet(data1, 0x00ff00, "Server #2");
            layer.addDataSet(data2, 0x9999ff, "Server #3");

            // Set bar border to transparent. Use soft lighting effect with light direction from
            // top.
            layer.setBorderColor(Chart.Transparent, Chart.softLighting(Chart.Top));

            // Configure the bars within a group to touch each others (no gap)
            layer.setBarGap(0.2, Chart.TouchBar);

            // Output the chart
            viewer.Chart = c;

            //include tool tip for the chart
            viewer.ImageMap = c.getHTMLImageMap("clickable", "",
                "title='{dataSetName} on {xLabel}: {value} MBytes/hour'");
        }
    }
}
[ASP.NET Web Forms - C# version] NetWebCharts\CSharpASP\softmultibar.aspx
(Click here on how to convert this code to code-behind style.)<%@ Page Language="C#" Debug="true" %>
<%@ Import Namespace="ChartDirector" %>
<%@ Register TagPrefix="chart" Namespace="ChartDirector" Assembly="netchartdir" %>
<!DOCTYPE html>
<script runat="server">
//
// Page Load event handler
//
protected void Page_Load(object sender, EventArgs e)
{
// The data for the bar chart
double[] data0 = {100, 125, 245, 147, 67};
double[] data1 = {85, 156, 179, 211, 123};
double[] data2 = {97, 87, 56, 267, 157};
string[] labels = {"Mon", "Tue", "Wed", "Thur", "Fri"};
// Create a XYChart object of size 540 x 375 pixels
XYChart c = new XYChart(540, 375);
// Add a title to the chart using 18pt Times Bold Italic font
c.addTitle("Average Weekly Network Load", "Times New Roman Bold Italic", 18);
// Set the plotarea at (50, 55) and of 440 x 280 pixels in size. Use a vertical gradient color
// from light red (ffdddd) to dark red (880000) as background. Set border and grid lines to
// white (ffffff).
c.setPlotArea(50, 55, 440, 280, c.linearGradientColor(0, 55, 0, 335, 0xffdddd, 0x880000), -1,
0xffffff, 0xffffff);
// Add a legend box at (50, 25) using horizontal layout. Use 10pt Arial Bold as font, with
// transparent background.
c.addLegend(50, 25, false, "Arial Bold", 10).setBackground(Chart.Transparent);
// Set the x axis labels
c.xAxis().setLabels(labels);
// Draw the ticks between label positions (instead of at label positions)
c.xAxis().setTickOffset(0.5);
// Set axis label style to 8pt Arial Bold
c.xAxis().setLabelStyle("Arial Bold", 8);
c.yAxis().setLabelStyle("Arial Bold", 8);
// Set axis line width to 2 pixels
c.xAxis().setWidth(2);
c.yAxis().setWidth(2);
// Add axis title
c.yAxis().setTitle("Throughput (MBytes Per Hour)");
// Add a multi-bar layer with 3 data sets and 4 pixels 3D depth
BarLayer layer = c.addBarLayer2(Chart.Side, 4);
layer.addDataSet(data0, 0xffff00, "Server #1");
layer.addDataSet(data1, 0x00ff00, "Server #2");
layer.addDataSet(data2, 0x9999ff, "Server #3");
// Set bar border to transparent. Use soft lighting effect with light direction from top.
layer.setBorderColor(Chart.Transparent, Chart.softLighting(Chart.Top));
// Configure the bars within a group to touch each others (no gap)
layer.setBarGap(0.2, Chart.TouchBar);
// Output the chart
WebChartViewer1.Image = c.makeWebImage(Chart.SVG);
// Include tool tip for the chart
WebChartViewer1.ImageMap = c.getHTMLImageMap("", "",
"title='{dataSetName} on {xLabel}: {value} MBytes/hour'");
}
</script>
<html>
<head>
<script type="text/javascript" src="cdjcv.js"></script>
</head>
<body>
<chart:WebChartViewer id="WebChartViewer1" runat="server" />
</body>
</html>
[ASP.NET Web Forms - VB Version] NetWebCharts\VBNetASP\softmultibar.aspx
(Click here on how to convert this code to code-behind style.)<%@ Page Language="VB" Debug="true" %>
<%@ Import Namespace="ChartDirector" %>
<%@ Register TagPrefix="chart" Namespace="ChartDirector" Assembly="netchartdir" %>
<!DOCTYPE html>
<script runat="server">
'
' Page Load event handler
'
Protected Sub Page_Load(ByVal sender As System.Object, ByVal e As System.EventArgs)
' The data for the bar chart
Dim data0() As Double = {100, 125, 245, 147, 67}
Dim data1() As Double = {85, 156, 179, 211, 123}
Dim data2() As Double = {97, 87, 56, 267, 157}
Dim labels() As String = {"Mon", "Tue", "Wed", "Thur", "Fri"}
' Create a XYChart object of size 540 x 375 pixels
Dim c As XYChart = New XYChart(540, 375)
' Add a title to the chart using 18pt Times Bold Italic font
c.addTitle("Average Weekly Network Load", "Times New Roman Bold Italic", 18)
' Set the plotarea at (50, 55) and of 440 x 280 pixels in size. Use a vertical gradient color
' from light red (ffdddd) to dark red (880000) as background. Set border and grid lines to white
' (ffffff).
c.setPlotArea(50, 55, 440, 280, c.linearGradientColor(0, 55, 0, 335, &Hffdddd, &H880000), -1, _
&Hffffff, &Hffffff)
' Add a legend box at (50, 25) using horizontal layout. Use 10pt Arial Bold as font, with
' transparent background.
c.addLegend(50, 25, False, "Arial Bold", 10).setBackground(Chart.Transparent)
' Set the x axis labels
c.xAxis().setLabels(labels)
' Draw the ticks between label positions (instead of at label positions)
c.xAxis().setTickOffset(0.5)
' Set axis label style to 8pt Arial Bold
c.xAxis().setLabelStyle("Arial Bold", 8)
c.yAxis().setLabelStyle("Arial Bold", 8)
' Set axis line width to 2 pixels
c.xAxis().setWidth(2)
c.yAxis().setWidth(2)
' Add axis title
c.yAxis().setTitle("Throughput (MBytes Per Hour)")
' Add a multi-bar layer with 3 data sets and 4 pixels 3D depth
Dim layer As BarLayer = c.addBarLayer2(Chart.Side, 4)
layer.addDataSet(data0, &Hffff00, "Server #1")
layer.addDataSet(data1, &H00ff00, "Server #2")
layer.addDataSet(data2, &H9999ff, "Server #3")
' Set bar border to transparent. Use soft lighting effect with light direction from top.
layer.setBorderColor(Chart.Transparent, Chart.softLighting(Chart.Top))
' Configure the bars within a group to touch each others (no gap)
layer.setBarGap(0.2, Chart.TouchBar)
' Output the chart
WebChartViewer1.Image = c.makeWebImage(Chart.SVG)
' Include tool tip for the chart
WebChartViewer1.ImageMap = c.getHTMLImageMap("", "", _
"title='{dataSetName} on {xLabel}: {value} MBytes/hour'")
End Sub
</script>
<html>
<head>
<script type="text/javascript" src="cdjcv.js"></script>
</head>
<body>
<chart:WebChartViewer id="WebChartViewer1" runat="server" />
</body>
</html>
[ASP.NET MVC - Controller] NetMvcCharts\Controllers\SoftmultibarController.cs
using System;
using System.Web.Mvc;
using ChartDirector;

namespace NetMvcCharts.Controllers
{
    public class SoftmultibarController : Controller
    {
        //
        // Default Action
        //
        public ActionResult Index()
        {
            ViewBag.Title = "Soft Multi-Bar Chart";
            createChart(ViewBag.Viewer = new RazorChartViewer(HttpContext, "chart1"));
            return View("~/Views/Shared/ChartView.cshtml");
        }

        //
        // Create chart
        //
        private void createChart(RazorChartViewer viewer)
        {
            // The data for the bar chart
            double[] data0 = {100, 125, 245, 147, 67};
            double[] data1 = {85, 156, 179, 211, 123};
            double[] data2 = {97, 87, 56, 267, 157};
            string[] labels = {"Mon", "Tue", "Wed", "Thur", "Fri"};

            // Create a XYChart object of size 540 x 375 pixels
            XYChart c = new XYChart(540, 375);

            // Add a title to the chart using 18pt Times Bold Italic font
            c.addTitle("Average Weekly Network Load", "Times New Roman Bold Italic", 18);

            // Set the plotarea at (50, 55) and of 440 x 280 pixels in size. Use a vertical gradient
            // color from light red (ffdddd) to dark red (880000) as background. Set border and grid
            // lines to white (ffffff).
            c.setPlotArea(50, 55, 440, 280, c.linearGradientColor(0, 55, 0, 335, 0xffdddd, 0x880000), -1,
                0xffffff, 0xffffff);

            // Add a legend box at (50, 25) using horizontal layout. Use 10pt Arial Bold as font, with
            // transparent background.
            c.addLegend(50, 25, false, "Arial Bold", 10).setBackground(Chart.Transparent);

            // Set the x axis labels
            c.xAxis().setLabels(labels);

            // Draw the ticks between label positions (instead of at label positions)
            c.xAxis().setTickOffset(0.5);

            // Set axis label style to 8pt Arial Bold
            c.xAxis().setLabelStyle("Arial Bold", 8);
            c.yAxis().setLabelStyle("Arial Bold", 8);

            // Set axis line width to 2 pixels
            c.xAxis().setWidth(2);
            c.yAxis().setWidth(2);

            // Add axis title
            c.yAxis().setTitle("Throughput (MBytes Per Hour)");

            // Add a multi-bar layer with 3 data sets and 4 pixels 3D depth
            BarLayer layer = c.addBarLayer2(Chart.Side, 4);
            layer.addDataSet(data0, 0xffff00, "Server #1");
            layer.addDataSet(data1, 0x00ff00, "Server #2");
            layer.addDataSet(data2, 0x9999ff, "Server #3");

            // Set bar border to transparent. Use soft lighting effect with light direction from top.
            layer.setBorderColor(Chart.Transparent, Chart.softLighting(Chart.Top));

            // Configure the bars within a group to touch each others (no gap)
            layer.setBarGap(0.2, Chart.TouchBar);

            // Output the chart
            viewer.Image = c.makeWebImage(Chart.SVG);

            // Include tool tip for the chart
            viewer.ImageMap = c.getHTMLImageMap("", "",
                "title='{dataSetName} on {xLabel}: {value} MBytes/hour'");
        }
    }
}
[ASP.NET MVC - View] NetMvcCharts\Views\Shared\ChartView.cshtml
@{ Layout = null; }

<!DOCTYPE html>

<html>
<head>
    <meta name="viewport" content="width=device-width" />
    <title>@ViewBag.Title</title>
    <style>
        @ViewBag.Style
    </style>
    @Scripts.Render("~/Scripts/cdjcv.js")
</head>
<body style="margin:5px 0px 0px 5px">
    <div style="font:bold 18pt verdana;">
        @ViewBag.Title
    </div>
    <hr style="border:solid 1px #000080; background:#000080" />
    <div>
        @{
            if (ViewBag.Viewer is Array)
            {
                // Display multiple charts
                for (int i = 0; i < ViewBag.Viewer.Length; ++i)
                {
                    @:@Html.Raw(ViewBag.Viewer[i].RenderHTML())
                }
            }
            else
            {
                // Display one chart only
                @:@Html.Raw(ViewBag.Viewer.RenderHTML())
            }
        }
    </div>
</body>
</html>
© 2023 Advanced Software Engineering Limited. All rights reserved.