[Windows Forms - C# version] NetWinCharts\CSharpWinCharts\surfaceaxis.cs
using System;
using ChartDirector;
namespace CSharpChartExplorer
{
public class surfaceaxis : DemoModule
{
//Name of demo module
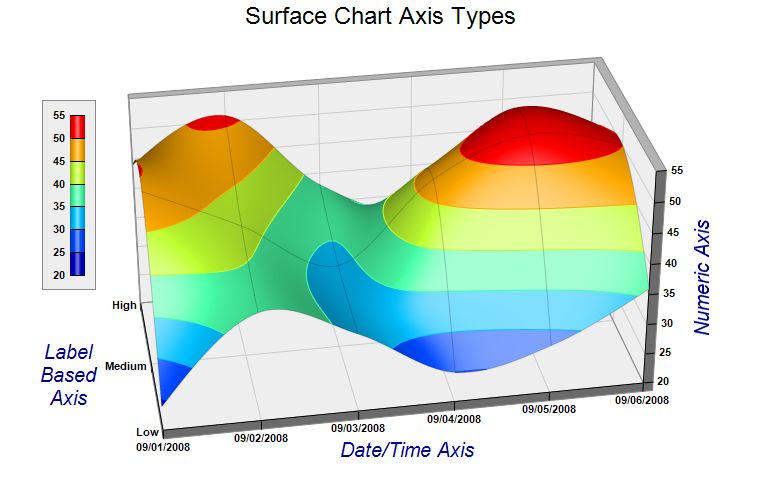
public string getName() { return "Surface Chart Axis Types"; }
//Number of charts produced in this demo module
public int getNoOfCharts() { return 1; }
//Main code for creating chart.
//Note: the argument chartIndex is unused because this demo only has 1 chart.
public void createChart(WinChartViewer viewer, int chartIndex)
{
// The x and y coordinates of the grid
DateTime[] dataX = {new DateTime(2008, 9, 1), new DateTime(2008, 9, 2), new DateTime(
2008, 9, 3), new DateTime(2008, 9, 4), new DateTime(2008, 9, 5), new DateTime(2008,
9, 6)};
string[] dataY = {"Low", "Medium", "High"};
// The data series
double[] lowData = {24, 38, 33, 25, 28, 36};
double[] mediumData = {49, 42, 34, 47, 53, 50};
double[] highData = {44, 51, 38, 33, 47, 42};
// Create a SurfaceChart object of size 760 x 500 pixels
SurfaceChart c = new SurfaceChart(760, 500);
// Add a title to the chart using 18 points Arial font
c.addTitle("Surface Chart Axis Types", "Arial", 18);
// Set the center of the plot region at (385, 240), and set width x depth x height to
// 480 x 240 x 240 pixels
c.setPlotRegion(385, 240, 480, 240, 240);
// Set the elevation and rotation angles to 30 and -10 degrees
c.setViewAngle(30, -10);
// Set the data to use to plot the chart. As the y-data are text strings (enumerated),
// we will use an empty array for the y-coordinates. For the z data series, they are
// just the concatenation of the individual data series.
c.setData(Chart.CTime(dataX), null, new ArrayMath(lowData).insert(mediumData).insert(
highData).result());
// Set the y-axis labels
c.yAxis().setLabels(dataY);
// Set x-axis tick density to 75 pixels. ChartDirector auto-scaling will use this as the
// guideline when putting ticks on the x-axis.
c.xAxis().setTickDensity(75);
// Spline interpolate data to a 80 x 40 grid for a smooth surface
c.setInterpolation(80, 40);
// Set surface grid lines to semi-transparent black (cc000000).
c.setSurfaceAxisGrid(unchecked((int)0xcc000000));
// Set contour lines to the same color as the fill color at the contour level
c.setContourColor(Chart.SameAsMainColor);
// Add a color axis (the legend) in which the top right corner is anchored at (95, 100).
// Set the length to 160 pixels and the labels on the left side.
ColorAxis cAxis = c.setColorAxis(95, 100, Chart.TopRight, 160, Chart.Left);
// Add a bounding box with light grey (eeeeee) background and grey (888888) border.
cAxis.setBoundingBox(0xeeeeee, 0x888888);
// Set label style to Arial bold for all axes
c.xAxis().setLabelStyle("Arial Bold");
c.yAxis().setLabelStyle("Arial Bold");
c.zAxis().setLabelStyle("Arial Bold");
c.colorAxis().setLabelStyle("Arial Bold");
// Set the x, y and z axis titles using deep blue (000088) 15 points Arial font
c.xAxis().setTitle("Date/Time Axis", "Arial Italic", 15, 0x000088);
c.yAxis().setTitle("Label\nBased\nAxis", "Arial Italic", 15, 0x000088);
c.zAxis().setTitle("Numeric Axis", "Arial Italic", 15, 0x000088);
// Output the chart
viewer.Chart = c;
}
}
}
[Windows Forms - VB Version] NetWinCharts\VBNetWinCharts\surfaceaxis.vb
Imports System
Imports Microsoft.VisualBasic
Imports ChartDirector

Public Class surfaceaxis
    Implements DemoModule

    'Name of demo module
    Public Function getName() As String Implements DemoModule.getName
        Return "Surface Chart Axis Types"
    End Function

    'Number of charts produced in this demo module
    Public Function getNoOfCharts() As Integer Implements DemoModule.getNoOfCharts
        Return 1
    End Function

    'Main code for creating chart.
    'Note: the argument chartIndex is unused because this demo only has 1 chart.
    Public Sub createChart(viewer As WinChartViewer, chartIndex As Integer) _
        Implements DemoModule.createChart

        ' The x and y coordinates of the grid
        Dim dataX() As Date = {DateSerial(2008, 9, 1), DateSerial(2008, 9, 2), DateSerial(2008, 9, _
            3), DateSerial(2008, 9, 4), DateSerial(2008, 9, 5), DateSerial(2008, 9, 6)}
        Dim dataY() As String = {"Low", "Medium", "High"}

        ' The data series
        Dim lowData() As Double = {24, 38, 33, 25, 28, 36}
        Dim mediumData() As Double = {49, 42, 34, 47, 53, 50}
        Dim highData() As Double = {44, 51, 38, 33, 47, 42}

        ' Create a SurfaceChart object of size 760 x 500 pixels
        Dim c As SurfaceChart = New SurfaceChart(760, 500)

        ' Add a title to the chart using 18 points Arial font
        c.addTitle("Surface Chart Axis Types", "Arial", 18)

        ' Set the center of the plot region at (385, 240), and set width x depth x height to 480 x
        ' 240 x 240 pixels
        c.setPlotRegion(385, 240, 480, 240, 240)

        ' Set the elevation and rotation angles to 30 and -10 degrees
        c.setViewAngle(30, -10)

        ' Set the data to use to plot the chart. As the y-data are text strings (enumerated), we
        ' will use an empty array for the y-coordinates. For the z data series, they are just the
        ' concatenation of the individual data series.
        c.setData(Chart.CTime(dataX), Nothing, New ArrayMath(lowData).insert(mediumData).insert( _
            highData).result())

        ' Set the y-axis labels
        c.yAxis().setLabels(dataY)

        ' Set x-axis tick density to 75 pixels. ChartDirector auto-scaling will use this as the
        ' guideline when putting ticks on the x-axis.
        c.xAxis().setTickDensity(75)

        ' Spline interpolate data to a 80 x 40 grid for a smooth surface
        c.setInterpolation(80, 40)

        ' Set surface grid lines to semi-transparent black (cc000000).
        c.setSurfaceAxisGrid(&Hcc000000)

        ' Set contour lines to the same color as the fill color at the contour level
        c.setContourColor(Chart.SameAsMainColor)

        ' Add a color axis (the legend) in which the top right corner is anchored at (95, 100). Set
        ' the length to 160 pixels and the labels on the left side.
        Dim cAxis As ColorAxis = c.setColorAxis(95, 100, Chart.TopRight, 160, Chart.Left)

        ' Add a bounding box with light grey (eeeeee) background and grey (888888) border.
        cAxis.setBoundingBox(&Heeeeee, &H888888)

        ' Set label style to Arial bold for all axes
        c.xAxis().setLabelStyle("Arial Bold")
        c.yAxis().setLabelStyle("Arial Bold")
        c.zAxis().setLabelStyle("Arial Bold")
        c.colorAxis().setLabelStyle("Arial Bold")

        ' Set the x, y and z axis titles using deep blue (000088) 15 points Arial font
        c.xAxis().setTitle("Date/Time Axis", "Arial Italic", 15, &H000088)
        c.yAxis().setTitle("Label<*br*>Based<*br*>Axis", "Arial Italic", 15, &H000088)
        c.zAxis().setTitle("Numeric Axis", "Arial Italic", 15, &H000088)

        ' Output the chart
        viewer.Chart = c

    End Sub

End Class
[WPF - C#] NetWPFCharts\CSharpWPFCharts\surfaceaxis.cs
using System;
using ChartDirector;

namespace CSharpWPFCharts
{
    public class surfaceaxis : DemoModule
    {
        //Name of demo module
        public string getName() { return "Surface Chart Axis Types"; }

        //Number of charts produced in this demo module
        public int getNoOfCharts() { return 1; }

        //Main code for creating chart.
        //Note: the argument chartIndex is unused because this demo only has 1 chart.
        public void createChart(WPFChartViewer viewer, int chartIndex)
        {
            // The x and y coordinates of the grid
            DateTime[] dataX = {new DateTime(2008, 9, 1), new DateTime(2008, 9, 2), new DateTime(
                2008, 9, 3), new DateTime(2008, 9, 4), new DateTime(2008, 9, 5), new DateTime(2008,
                9, 6)};
            string[] dataY = {"Low", "Medium", "High"};

            // The data series
            double[] lowData = {24, 38, 33, 25, 28, 36};
            double[] mediumData = {49, 42, 34, 47, 53, 50};
            double[] highData = {44, 51, 38, 33, 47, 42};

            // Create a SurfaceChart object of size 760 x 500 pixels
            SurfaceChart c = new SurfaceChart(760, 500);

            // Add a title to the chart using 18 points Arial font
            c.addTitle("Surface Chart Axis Types", "Arial", 18);

            // Set the center of the plot region at (385, 240), and set width x depth x height to
            // 480 x 240 x 240 pixels
            c.setPlotRegion(385, 240, 480, 240, 240);

            // Set the elevation and rotation angles to 30 and -10 degrees
            c.setViewAngle(30, -10);

            // Set the data to use to plot the chart. As the y-data are text strings (enumerated),
            // we will use an empty array for the y-coordinates. For the z data series, they are
            // just the concatenation of the individual data series.
            c.setData(Chart.CTime(dataX), null, new ArrayMath(lowData).insert(mediumData).insert(
                highData).result());

            // Set the y-axis labels
            c.yAxis().setLabels(dataY);

            // Set x-axis tick density to 75 pixels. ChartDirector auto-scaling will use this as the
            // guideline when putting ticks on the x-axis.
            c.xAxis().setTickDensity(75);

            // Spline interpolate data to a 80 x 40 grid for a smooth surface
            c.setInterpolation(80, 40);

            // Set surface grid lines to semi-transparent black (cc000000).
            c.setSurfaceAxisGrid(unchecked((int)0xcc000000));

            // Set contour lines to the same color as the fill color at the contour level
            c.setContourColor(Chart.SameAsMainColor);

            // Add a color axis (the legend) in which the top right corner is anchored at (95, 100).
            // Set the length to 160 pixels and the labels on the left side.
            ColorAxis cAxis = c.setColorAxis(95, 100, Chart.TopRight, 160, Chart.Left);

            // Add a bounding box with light grey (eeeeee) background and grey (888888) border.
            cAxis.setBoundingBox(0xeeeeee, 0x888888);

            // Set label style to Arial bold for all axes
            c.xAxis().setLabelStyle("Arial Bold");
            c.yAxis().setLabelStyle("Arial Bold");
            c.zAxis().setLabelStyle("Arial Bold");
            c.colorAxis().setLabelStyle("Arial Bold");

            // Set the x, y and z axis titles using deep blue (000088) 15 points Arial font
            c.xAxis().setTitle("Date/Time Axis", "Arial Italic", 15, 0x000088);
            c.yAxis().setTitle("Label\nBased\nAxis", "Arial Italic", 15, 0x000088);
            c.zAxis().setTitle("Numeric Axis", "Arial Italic", 15, 0x000088);

            // Output the chart
            viewer.Chart = c;
        }
    }
}
[ASP.NET Web Forms - C# version] NetWebCharts\CSharpASP\surfaceaxis.aspx
(Click here on how to convert this code to code-behind style.)<%@ Page Language="C#" Debug="true" %>
<%@ Import Namespace="ChartDirector" %>
<%@ Register TagPrefix="chart" Namespace="ChartDirector" Assembly="netchartdir" %>
<!DOCTYPE html>
<script runat="server">
//
// Page Load event handler
//
protected void Page_Load(object sender, EventArgs e)
{
// The x and y coordinates of the grid
DateTime[] dataX = {new DateTime(2008, 9, 1), new DateTime(2008, 9, 2), new DateTime(2008, 9, 3
), new DateTime(2008, 9, 4), new DateTime(2008, 9, 5), new DateTime(2008, 9, 6)};
string[] dataY = {"Low", "Medium", "High"};
// The data series
double[] lowData = {24, 38, 33, 25, 28, 36};
double[] mediumData = {49, 42, 34, 47, 53, 50};
double[] highData = {44, 51, 38, 33, 47, 42};
// Create a SurfaceChart object of size 760 x 500 pixels
SurfaceChart c = new SurfaceChart(760, 500);
// Add a title to the chart using 18 points Arial font
c.addTitle("Surface Chart Axis Types", "Arial", 18);
// Set the center of the plot region at (385, 240), and set width x depth x height to 480 x 240
// x 240 pixels
c.setPlotRegion(385, 240, 480, 240, 240);
// Set the elevation and rotation angles to 30 and -10 degrees
c.setViewAngle(30, -10);
// Set the data to use to plot the chart. As the y-data are text strings (enumerated), we will
// use an empty array for the y-coordinates. For the z data series, they are just the
// concatenation of the individual data series.
c.setData(Chart.CTime(dataX), null, new ArrayMath(lowData).insert(mediumData).insert(highData
).result());
// Set the y-axis labels
c.yAxis().setLabels(dataY);
// Set x-axis tick density to 75 pixels. ChartDirector auto-scaling will use this as the
// guideline when putting ticks on the x-axis.
c.xAxis().setTickDensity(75);
// Spline interpolate data to a 80 x 40 grid for a smooth surface
c.setInterpolation(80, 40);
// Set surface grid lines to semi-transparent black (cc000000).
c.setSurfaceAxisGrid(unchecked((int)0xcc000000));
// Set contour lines to the same color as the fill color at the contour level
c.setContourColor(Chart.SameAsMainColor);
// Add a color axis (the legend) in which the top right corner is anchored at (95, 100). Set the
// length to 160 pixels and the labels on the left side.
ColorAxis cAxis = c.setColorAxis(95, 100, Chart.TopRight, 160, Chart.Left);
// Add a bounding box with light grey (eeeeee) background and grey (888888) border.
cAxis.setBoundingBox(0xeeeeee, 0x888888);
// Set label style to Arial bold for all axes
c.xAxis().setLabelStyle("Arial Bold");
c.yAxis().setLabelStyle("Arial Bold");
c.zAxis().setLabelStyle("Arial Bold");
c.colorAxis().setLabelStyle("Arial Bold");
// Set the x, y and z axis titles using deep blue (000088) 15 points Arial font
c.xAxis().setTitle("Date/Time Axis", "Arial Italic", 15, 0x000088);
c.yAxis().setTitle("Label\nBased\nAxis", "Arial Italic", 15, 0x000088);
c.zAxis().setTitle("Numeric Axis", "Arial Italic", 15, 0x000088);
// Output the chart
WebChartViewer1.Image = c.makeWebImage(Chart.SVG);
}
</script>
<html>
<head>
<script type="text/javascript" src="cdjcv.js"></script>
</head>
<body>
<chart:WebChartViewer id="WebChartViewer1" runat="server" />
</body>
</html>
[ASP.NET Web Forms - VB Version] NetWebCharts\VBNetASP\surfaceaxis.aspx
(Click here on how to convert this code to code-behind style.)<%@ Page Language="VB" Debug="true" %>
<%@ Import Namespace="ChartDirector" %>
<%@ Register TagPrefix="chart" Namespace="ChartDirector" Assembly="netchartdir" %>
<!DOCTYPE html>
<script runat="server">
'
' Page Load event handler
'
Protected Sub Page_Load(ByVal sender As System.Object, ByVal e As System.EventArgs)
' The x and y coordinates of the grid
Dim dataX() As Date = {DateSerial(2008, 9, 1), DateSerial(2008, 9, 2), DateSerial(2008, 9, 3), _
DateSerial(2008, 9, 4), DateSerial(2008, 9, 5), DateSerial(2008, 9, 6)}
Dim dataY() As String = {"Low", "Medium", "High"}
' The data series
Dim lowData() As Double = {24, 38, 33, 25, 28, 36}
Dim mediumData() As Double = {49, 42, 34, 47, 53, 50}
Dim highData() As Double = {44, 51, 38, 33, 47, 42}
' Create a SurfaceChart object of size 760 x 500 pixels
Dim c As SurfaceChart = New SurfaceChart(760, 500)
' Add a title to the chart using 18 points Arial font
c.addTitle("Surface Chart Axis Types", "Arial", 18)
' Set the center of the plot region at (385, 240), and set width x depth x height to 480 x 240 x
' 240 pixels
c.setPlotRegion(385, 240, 480, 240, 240)
' Set the elevation and rotation angles to 30 and -10 degrees
c.setViewAngle(30, -10)
' Set the data to use to plot the chart. As the y-data are text strings (enumerated), we will
' use an empty array for the y-coordinates. For the z data series, they are just the
' concatenation of the individual data series.
c.setData(Chart.CTime(dataX), Nothing, New ArrayMath(lowData).insert(mediumData).insert( _
highData).result())
' Set the y-axis labels
c.yAxis().setLabels(dataY)
' Set x-axis tick density to 75 pixels. ChartDirector auto-scaling will use this as the
' guideline when putting ticks on the x-axis.
c.xAxis().setTickDensity(75)
' Spline interpolate data to a 80 x 40 grid for a smooth surface
c.setInterpolation(80, 40)
' Set surface grid lines to semi-transparent black (cc000000).
c.setSurfaceAxisGrid(&Hcc000000)
' Set contour lines to the same color as the fill color at the contour level
c.setContourColor(Chart.SameAsMainColor)
' Add a color axis (the legend) in which the top right corner is anchored at (95, 100). Set the
' length to 160 pixels and the labels on the left side.
Dim cAxis As ColorAxis = c.setColorAxis(95, 100, Chart.TopRight, 160, Chart.Left)
' Add a bounding box with light grey (eeeeee) background and grey (888888) border.
cAxis.setBoundingBox(&Heeeeee, &H888888)
' Set label style to Arial bold for all axes
c.xAxis().setLabelStyle("Arial Bold")
c.yAxis().setLabelStyle("Arial Bold")
c.zAxis().setLabelStyle("Arial Bold")
c.colorAxis().setLabelStyle("Arial Bold")
' Set the x, y and z axis titles using deep blue (000088) 15 points Arial font
c.xAxis().setTitle("Date/Time Axis", "Arial Italic", 15, &H000088)
c.yAxis().setTitle("Label<*br*>Based<*br*>Axis", "Arial Italic", 15, &H000088)
c.zAxis().setTitle("Numeric Axis", "Arial Italic", 15, &H000088)
' Output the chart
WebChartViewer1.Image = c.makeWebImage(Chart.SVG)
End Sub
</script>
<html>
<head>
<script type="text/javascript" src="cdjcv.js"></script>
</head>
<body>
<chart:WebChartViewer id="WebChartViewer1" runat="server" />
</body>
</html>
[ASP.NET MVC - Controller] NetMvcCharts\Controllers\SurfaceaxisController.cs
using System;
using System.Web.Mvc;
using ChartDirector;

namespace NetMvcCharts.Controllers
{
    public class SurfaceaxisController : Controller
    {
        //
        // Default Action
        //
        public ActionResult Index()
        {
            ViewBag.Title = "Surface Chart Axis Types";
            createChart(ViewBag.Viewer = new RazorChartViewer(HttpContext, "chart1"));
            return View("~/Views/Shared/ChartView.cshtml");
        }

        //
        // Create chart
        //
        private void createChart(RazorChartViewer viewer)
        {
            // The x and y coordinates of the grid
            DateTime[] dataX = {new DateTime(2008, 9, 1), new DateTime(2008, 9, 2), new DateTime(2008, 9,
                3), new DateTime(2008, 9, 4), new DateTime(2008, 9, 5), new DateTime(2008, 9, 6)};
            string[] dataY = {"Low", "Medium", "High"};

            // The data series
            double[] lowData = {24, 38, 33, 25, 28, 36};
            double[] mediumData = {49, 42, 34, 47, 53, 50};
            double[] highData = {44, 51, 38, 33, 47, 42};

            // Create a SurfaceChart object of size 760 x 500 pixels
            SurfaceChart c = new SurfaceChart(760, 500);

            // Add a title to the chart using 18 points Arial font
            c.addTitle("Surface Chart Axis Types", "Arial", 18);

            // Set the center of the plot region at (385, 240), and set width x depth x height to 480 x
            // 240 x 240 pixels
            c.setPlotRegion(385, 240, 480, 240, 240);

            // Set the elevation and rotation angles to 30 and -10 degrees
            c.setViewAngle(30, -10);

            // Set the data to use to plot the chart. As the y-data are text strings (enumerated), we
            // will use an empty array for the y-coordinates. For the z data series, they are just the
            // concatenation of the individual data series.
            c.setData(Chart.CTime(dataX), null, new ArrayMath(lowData).insert(mediumData).insert(highData
                ).result());

            // Set the y-axis labels
            c.yAxis().setLabels(dataY);

            // Set x-axis tick density to 75 pixels. ChartDirector auto-scaling will use this as the
            // guideline when putting ticks on the x-axis.
            c.xAxis().setTickDensity(75);

            // Spline interpolate data to a 80 x 40 grid for a smooth surface
            c.setInterpolation(80, 40);

            // Set surface grid lines to semi-transparent black (cc000000).
            c.setSurfaceAxisGrid(unchecked((int)0xcc000000));

            // Set contour lines to the same color as the fill color at the contour level
            c.setContourColor(Chart.SameAsMainColor);

            // Add a color axis (the legend) in which the top right corner is anchored at (95, 100). Set
            // the length to 160 pixels and the labels on the left side.
            ColorAxis cAxis = c.setColorAxis(95, 100, Chart.TopRight, 160, Chart.Left);

            // Add a bounding box with light grey (eeeeee) background and grey (888888) border.
            cAxis.setBoundingBox(0xeeeeee, 0x888888);

            // Set label style to Arial bold for all axes
            c.xAxis().setLabelStyle("Arial Bold");
            c.yAxis().setLabelStyle("Arial Bold");
            c.zAxis().setLabelStyle("Arial Bold");
            c.colorAxis().setLabelStyle("Arial Bold");

            // Set the x, y and z axis titles using deep blue (000088) 15 points Arial font
            c.xAxis().setTitle("Date/Time Axis", "Arial Italic", 15, 0x000088);
            c.yAxis().setTitle("Label\nBased\nAxis", "Arial Italic", 15, 0x000088);
            c.zAxis().setTitle("Numeric Axis", "Arial Italic", 15, 0x000088);

            // Output the chart
            viewer.Image = c.makeWebImage(Chart.SVG);
        }
    }
}
[ASP.NET MVC - View] NetMvcCharts\Views\Shared\ChartView.cshtml
@{ Layout = null; }

<!DOCTYPE html>

<html>
<head>
    <meta name="viewport" content="width=device-width" />
    <title>@ViewBag.Title</title>
    <style>
        @ViewBag.Style
    </style>
    @Scripts.Render("~/Scripts/cdjcv.js")
</head>
<body style="margin:5px 0px 0px 5px">
    <div style="font:bold 18pt verdana;">
        @ViewBag.Title
    </div>
    <hr style="border:solid 1px #000080; background:#000080" />
    <div>
        @{
            if (ViewBag.Viewer is Array)
            {
                // Display multiple charts
                for (int i = 0; i < ViewBag.Viewer.Length; ++i)
                {
                    @:@Html.Raw(ViewBag.Viewer[i].RenderHTML())
                }
            }
            else
            {
                // Display one chart only
                @:@Html.Raw(ViewBag.Viewer.RenderHTML())
            }
        }
    </div>
</body>
</html>
© 2023 Advanced Software Engineering Limited. All rights reserved.