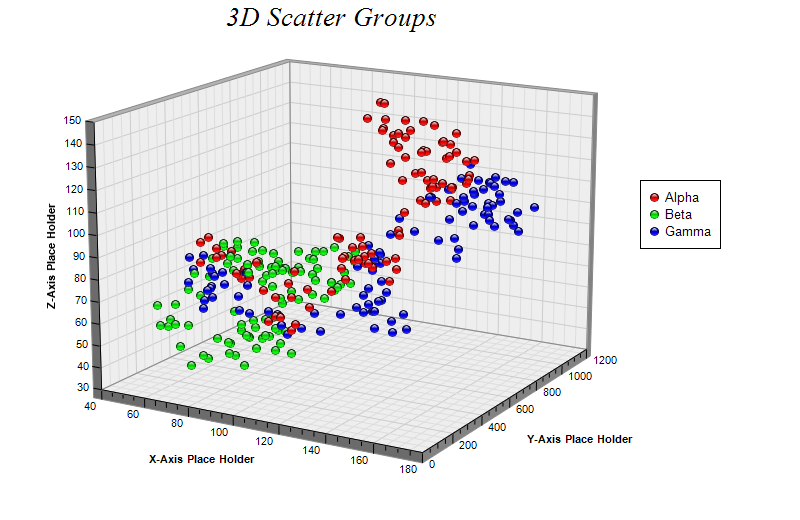
This example demonstrates multiple symbol groups by calling ThreeDScatterChart.addScatterGroup multiple times with different data and colors.
ChartDirector 7.1 (.NET Edition)
3D Scatter Groups
Source Code Listing
using System;
using ChartDirector;

namespace CSharpChartExplorer
{
    public class threedscattergroups : DemoModule
    {
        //Name of demo module
        public string getName() { return "3D Scatter Groups"; }

        //Number of charts produced in this demo module
        public int getNoOfCharts() { return 1; }

        //Main code for creating chart.
        //Note: the argument chartIndex is unused because this demo only has 1 chart.
        public void createChart(WinChartViewer viewer, int chartIndex)
        {
            // The random XYZ data for the first 3D scatter group
            RanSeries r0 = new RanSeries(7);
            double[] xData0 = r0.getSeries2(100, 100, -10, 10);
            double[] yData0 = r0.getSeries2(100, 0, 0, 20);
            double[] zData0 = r0.getSeries2(100, 100, -10, 10);

            // The random XYZ data for the second 3D scatter group
            RanSeries r1 = new RanSeries(4);
            double[] xData1 = r1.getSeries2(100, 100, -10, 10);
            double[] yData1 = r1.getSeries2(100, 0, 0, 20);
            double[] zData1 = r1.getSeries2(100, 100, -10, 10);

            // The random XYZ data for the third 3D scatter group
            RanSeries r2 = new RanSeries(8);
            double[] xData2 = r2.getSeries2(100, 100, -10, 10);
            double[] yData2 = r2.getSeries2(100, 0, 0, 20);
            double[] zData2 = r2.getSeries2(100, 100, -10, 10);

            // Create a ThreeDScatterChart object of size 800 x 520 pixels
            ThreeDScatterChart c = new ThreeDScatterChart(800, 520);

            // Add a title to the chart using 20 points Times New Roman Italic font
            c.addTitle("3D Scatter Groups                    ", "Times New Roman Italic", 20);

            // Set the center of the plot region at (350, 240), and set width x depth x height to
            // 360 x 360 x 270 pixels
            c.setPlotRegion(350, 240, 360, 360, 270);

            // Set the elevation and rotation angles to 15 and 30 degrees
            c.setViewAngle(15, 30);

            // Add a legend box at (640, 180)
            c.addLegend(640, 180);

            // Add 3 scatter groups to the chart with 9 pixels glass sphere symbols of red (ff0000),
            // green (00ff00) and blue (0000ff) colors
            c.addScatterGroup(xData0, yData0, zData0, "Alpha", Chart.GlassSphere2Shape, 9, 0xff0000)
                ;
            c.addScatterGroup(xData1, yData1, zData1, "Beta", Chart.GlassSphere2Shape, 9, 0x00ff00);
            c.addScatterGroup(xData2, yData2, zData2, "Gamma", Chart.GlassSphere2Shape, 9, 0x0000ff)
                ;

            // Set the x, y and z axis titles
            c.xAxis().setTitle("X-Axis Place Holder");
            c.yAxis().setTitle("Y-Axis Place Holder");
            c.zAxis().setTitle("Z-Axis Place Holder");

            // Output the chart
            viewer.Chart = c;

            //include tool tip for the chart
            viewer.ImageMap = c.getHTMLImageMap("clickable", "",
                "title='<*cdml*><*font=bold,underline=1*>{dataSetName}<*/font*><*br*>X={x|p}" +
                "<*br*>Y={y|p}<*br*>Z={z|p}'");
        }
    }
}Imports System
Imports Microsoft.VisualBasic
Imports ChartDirector
Public Class threedscattergroups
Implements DemoModule
'Name of demo module
Public Function getName() As String Implements DemoModule.getName
Return "3D Scatter Groups"
End Function
'Number of charts produced in this demo module
Public Function getNoOfCharts() As Integer Implements DemoModule.getNoOfCharts
Return 1
End Function
'Main code for creating chart.
'Note: the argument chartIndex is unused because this demo only has 1 chart.
Public Sub createChart(viewer As WinChartViewer, chartIndex As Integer) _
Implements DemoModule.createChart
' The random XYZ data for the first 3D scatter group
Dim r0 As RanSeries = New RanSeries(7)
Dim xData0() As Double = r0.getSeries2(100, 100, -10, 10)
Dim yData0() As Double = r0.getSeries2(100, 0, 0, 20)
Dim zData0() As Double = r0.getSeries2(100, 100, -10, 10)
' The random XYZ data for the second 3D scatter group
Dim r1 As RanSeries = New RanSeries(4)
Dim xData1() As Double = r1.getSeries2(100, 100, -10, 10)
Dim yData1() As Double = r1.getSeries2(100, 0, 0, 20)
Dim zData1() As Double = r1.getSeries2(100, 100, -10, 10)
' The random XYZ data for the third 3D scatter group
Dim r2 As RanSeries = New RanSeries(8)
Dim xData2() As Double = r2.getSeries2(100, 100, -10, 10)
Dim yData2() As Double = r2.getSeries2(100, 0, 0, 20)
Dim zData2() As Double = r2.getSeries2(100, 100, -10, 10)
' Create a ThreeDScatterChart object of size 800 x 520 pixels
Dim c As ThreeDScatterChart = New ThreeDScatterChart(800, 520)
' Add a title to the chart using 20 points Times New Roman Italic font
c.addTitle("3D Scatter Groups ", "Times New Roman Italic", 20)
' Set the center of the plot region at (350, 240), and set width x depth x height to 360 x
' 360 x 270 pixels
c.setPlotRegion(350, 240, 360, 360, 270)
' Set the elevation and rotation angles to 15 and 30 degrees
c.setViewAngle(15, 30)
' Add a legend box at (640, 180)
c.addLegend(640, 180)
' Add 3 scatter groups to the chart with 9 pixels glass sphere symbols of red (ff0000),
' green (00ff00) and blue (0000ff) colors
c.addScatterGroup(xData0, yData0, zData0, "Alpha", Chart.GlassSphere2Shape, 9, &Hff0000)
c.addScatterGroup(xData1, yData1, zData1, "Beta", Chart.GlassSphere2Shape, 9, &H00ff00)
c.addScatterGroup(xData2, yData2, zData2, "Gamma", Chart.GlassSphere2Shape, 9, &H0000ff)
' Set the x, y and z axis titles
c.xAxis().setTitle("X-Axis Place Holder")
c.yAxis().setTitle("Y-Axis Place Holder")
c.zAxis().setTitle("Z-Axis Place Holder")
' Output the chart
viewer.Chart = c
'include tool tip for the chart
viewer.ImageMap = c.getHTMLImageMap("clickable", "", _
"title='<*cdml*><*font=bold,underline=1*>{dataSetName}<*/font*><*br*>X={x|p}<*br*>" & _
"Y={y|p}<*br*>Z={z|p}'")
End Sub
End Classusing System;
using ChartDirector;
namespace CSharpWPFCharts
{
public class threedscattergroups : DemoModule
{
//Name of demo module
public string getName() { return "3D Scatter Groups"; }
//Number of charts produced in this demo module
public int getNoOfCharts() { return 1; }
//Main code for creating chart.
//Note: the argument chartIndex is unused because this demo only has 1 chart.
public void createChart(WPFChartViewer viewer, int chartIndex)
{
// The random XYZ data for the first 3D scatter group
RanSeries r0 = new RanSeries(7);
double[] xData0 = r0.getSeries2(100, 100, -10, 10);
double[] yData0 = r0.getSeries2(100, 0, 0, 20);
double[] zData0 = r0.getSeries2(100, 100, -10, 10);
// The random XYZ data for the second 3D scatter group
RanSeries r1 = new RanSeries(4);
double[] xData1 = r1.getSeries2(100, 100, -10, 10);
double[] yData1 = r1.getSeries2(100, 0, 0, 20);
double[] zData1 = r1.getSeries2(100, 100, -10, 10);
// The random XYZ data for the third 3D scatter group
RanSeries r2 = new RanSeries(8);
double[] xData2 = r2.getSeries2(100, 100, -10, 10);
double[] yData2 = r2.getSeries2(100, 0, 0, 20);
double[] zData2 = r2.getSeries2(100, 100, -10, 10);
// Create a ThreeDScatterChart object of size 800 x 520 pixels
ThreeDScatterChart c = new ThreeDScatterChart(800, 520);
// Add a title to the chart using 20 points Times New Roman Italic font
c.addTitle("3D Scatter Groups ", "Times New Roman Italic", 20);
// Set the center of the plot region at (350, 240), and set width x depth x height to
// 360 x 360 x 270 pixels
c.setPlotRegion(350, 240, 360, 360, 270);
// Set the elevation and rotation angles to 15 and 30 degrees
c.setViewAngle(15, 30);
// Add a legend box at (640, 180)
c.addLegend(640, 180);
// Add 3 scatter groups to the chart with 9 pixels glass sphere symbols of red (ff0000),
// green (00ff00) and blue (0000ff) colors
c.addScatterGroup(xData0, yData0, zData0, "Alpha", Chart.GlassSphere2Shape, 9, 0xff0000)
;
c.addScatterGroup(xData1, yData1, zData1, "Beta", Chart.GlassSphere2Shape, 9, 0x00ff00);
c.addScatterGroup(xData2, yData2, zData2, "Gamma", Chart.GlassSphere2Shape, 9, 0x0000ff)
;
// Set the x, y and z axis titles
c.xAxis().setTitle("X-Axis Place Holder");
c.yAxis().setTitle("Y-Axis Place Holder");
c.zAxis().setTitle("Z-Axis Place Holder");
// Output the chart
viewer.Chart = c;
//include tool tip for the chart
viewer.ImageMap = c.getHTMLImageMap("clickable", "",
"title='<*cdml*><*font=bold,underline=1*>{dataSetName}<*/font*><*br*>X={x|p}" +
"<*br*>Y={y|p}<*br*>Z={z|p}'");
}
}
}<%@ Page Language="C#" Debug="true" %>
<%@ Import Namespace="ChartDirector" %>
<%@ Register TagPrefix="chart" Namespace="ChartDirector" Assembly="netchartdir" %>
<!DOCTYPE html>
<script runat="server">
//
// Page Load event handler
//
protected void Page_Load(object sender, EventArgs e)
{
// The random XYZ data for the first 3D scatter group
RanSeries r0 = new RanSeries(7);
double[] xData0 = r0.getSeries2(100, 100, -10, 10);
double[] yData0 = r0.getSeries2(100, 0, 0, 20);
double[] zData0 = r0.getSeries2(100, 100, -10, 10);
// The random XYZ data for the second 3D scatter group
RanSeries r1 = new RanSeries(4);
double[] xData1 = r1.getSeries2(100, 100, -10, 10);
double[] yData1 = r1.getSeries2(100, 0, 0, 20);
double[] zData1 = r1.getSeries2(100, 100, -10, 10);
// The random XYZ data for the third 3D scatter group
RanSeries r2 = new RanSeries(8);
double[] xData2 = r2.getSeries2(100, 100, -10, 10);
double[] yData2 = r2.getSeries2(100, 0, 0, 20);
double[] zData2 = r2.getSeries2(100, 100, -10, 10);
// Create a ThreeDScatterChart object of size 800 x 520 pixels
ThreeDScatterChart c = new ThreeDScatterChart(800, 520);
// Add a title to the chart using 20 points Times New Roman Italic font
c.addTitle("3D Scatter Groups ", "Times New Roman Italic", 20);
// Set the center of the plot region at (350, 240), and set width x depth x height to 360 x 360
// x 270 pixels
c.setPlotRegion(350, 240, 360, 360, 270);
// Set the elevation and rotation angles to 15 and 30 degrees
c.setViewAngle(15, 30);
// Add a legend box at (640, 180)
c.addLegend(640, 180);
// Add 3 scatter groups to the chart with 9 pixels glass sphere symbols of red (ff0000), green
// (00ff00) and blue (0000ff) colors
c.addScatterGroup(xData0, yData0, zData0, "Alpha", Chart.GlassSphere2Shape, 9, 0xff0000);
c.addScatterGroup(xData1, yData1, zData1, "Beta", Chart.GlassSphere2Shape, 9, 0x00ff00);
c.addScatterGroup(xData2, yData2, zData2, "Gamma", Chart.GlassSphere2Shape, 9, 0x0000ff);
// Set the x, y and z axis titles
c.xAxis().setTitle("X-Axis Place Holder");
c.yAxis().setTitle("Y-Axis Place Holder");
c.zAxis().setTitle("Z-Axis Place Holder");
// Output the chart
WebChartViewer1.Image = c.makeWebImage(Chart.SVG);
// Include tool tip for the chart
WebChartViewer1.ImageMap = c.getHTMLImageMap("", "",
"title='<*cdml*><*b*><*u*>{dataSetName}<*/u*><*/b*><*br*>X={x|p}<*br*>Y={y|p}<*br*>Z={z|p}'"
);
}
</script>
<html>
<head>
<script type="text/javascript" src="cdjcv.js"></script>
</head>
<body>
<chart:WebChartViewer id="WebChartViewer1" runat="server" />
</body>
</html><%@ Page Language="VB" Debug="true" %>
<%@ Import Namespace="ChartDirector" %>
<%@ Register TagPrefix="chart" Namespace="ChartDirector" Assembly="netchartdir" %>
<!DOCTYPE html>
<script runat="server">
'
' Page Load event handler
'
Protected Sub Page_Load(ByVal sender As System.Object, ByVal e As System.EventArgs)
' The random XYZ data for the first 3D scatter group
Dim r0 As RanSeries = New RanSeries(7)
Dim xData0() As Double = r0.getSeries2(100, 100, -10, 10)
Dim yData0() As Double = r0.getSeries2(100, 0, 0, 20)
Dim zData0() As Double = r0.getSeries2(100, 100, -10, 10)
' The random XYZ data for the second 3D scatter group
Dim r1 As RanSeries = New RanSeries(4)
Dim xData1() As Double = r1.getSeries2(100, 100, -10, 10)
Dim yData1() As Double = r1.getSeries2(100, 0, 0, 20)
Dim zData1() As Double = r1.getSeries2(100, 100, -10, 10)
' The random XYZ data for the third 3D scatter group
Dim r2 As RanSeries = New RanSeries(8)
Dim xData2() As Double = r2.getSeries2(100, 100, -10, 10)
Dim yData2() As Double = r2.getSeries2(100, 0, 0, 20)
Dim zData2() As Double = r2.getSeries2(100, 100, -10, 10)
' Create a ThreeDScatterChart object of size 800 x 520 pixels
Dim c As ThreeDScatterChart = New ThreeDScatterChart(800, 520)
' Add a title to the chart using 20 points Times New Roman Italic font
c.addTitle("3D Scatter Groups ", "Times New Roman Italic", 20)
' Set the center of the plot region at (350, 240), and set width x depth x height to 360 x 360 x
' 270 pixels
c.setPlotRegion(350, 240, 360, 360, 270)
' Set the elevation and rotation angles to 15 and 30 degrees
c.setViewAngle(15, 30)
' Add a legend box at (640, 180)
c.addLegend(640, 180)
' Add 3 scatter groups to the chart with 9 pixels glass sphere symbols of red (ff0000), green
' (00ff00) and blue (0000ff) colors
c.addScatterGroup(xData0, yData0, zData0, "Alpha", Chart.GlassSphere2Shape, 9, &Hff0000)
c.addScatterGroup(xData1, yData1, zData1, "Beta", Chart.GlassSphere2Shape, 9, &H00ff00)
c.addScatterGroup(xData2, yData2, zData2, "Gamma", Chart.GlassSphere2Shape, 9, &H0000ff)
' Set the x, y and z axis titles
c.xAxis().setTitle("X-Axis Place Holder")
c.yAxis().setTitle("Y-Axis Place Holder")
c.zAxis().setTitle("Z-Axis Place Holder")
' Output the chart
WebChartViewer1.Image = c.makeWebImage(Chart.SVG)
' Include tool tip for the chart
WebChartViewer1.ImageMap = c.getHTMLImageMap("", "", _
"title='<*cdml*><*b*><*u*>{dataSetName}<*/u*><*/b*><*br*>X={x|p}<*br*>Y={y|p}<*br*>Z={z|p}'")
End Sub
</script>
<html>
<head>
<script type="text/javascript" src="cdjcv.js"></script>
</head>
<body>
<chart:WebChartViewer id="WebChartViewer1" runat="server" />
</body>
</html>using System;
using System.Web.Mvc;
using ChartDirector;
namespace NetMvcCharts.Controllers
{
public class ThreedscattergroupsController : Controller
{
//
// Default Action
//
public ActionResult Index()
{
ViewBag.Title = "3D Scatter Groups";
createChart(ViewBag.Viewer = new RazorChartViewer(HttpContext, "chart1"));
return View("~/Views/Shared/ChartView.cshtml");
}
//
// Create chart
//
private void createChart(RazorChartViewer viewer)
{
// The random XYZ data for the first 3D scatter group
RanSeries r0 = new RanSeries(7);
double[] xData0 = r0.getSeries2(100, 100, -10, 10);
double[] yData0 = r0.getSeries2(100, 0, 0, 20);
double[] zData0 = r0.getSeries2(100, 100, -10, 10);
// The random XYZ data for the second 3D scatter group
RanSeries r1 = new RanSeries(4);
double[] xData1 = r1.getSeries2(100, 100, -10, 10);
double[] yData1 = r1.getSeries2(100, 0, 0, 20);
double[] zData1 = r1.getSeries2(100, 100, -10, 10);
// The random XYZ data for the third 3D scatter group
RanSeries r2 = new RanSeries(8);
double[] xData2 = r2.getSeries2(100, 100, -10, 10);
double[] yData2 = r2.getSeries2(100, 0, 0, 20);
double[] zData2 = r2.getSeries2(100, 100, -10, 10);
// Create a ThreeDScatterChart object of size 800 x 520 pixels
ThreeDScatterChart c = new ThreeDScatterChart(800, 520);
// Add a title to the chart using 20 points Times New Roman Italic font
c.addTitle("3D Scatter Groups ", "Times New Roman Italic", 20);
// Set the center of the plot region at (350, 240), and set width x depth x height to 360 x
// 360 x 270 pixels
c.setPlotRegion(350, 240, 360, 360, 270);
// Set the elevation and rotation angles to 15 and 30 degrees
c.setViewAngle(15, 30);
// Add a legend box at (640, 180)
c.addLegend(640, 180);
// Add 3 scatter groups to the chart with 9 pixels glass sphere symbols of red (ff0000),
// green (00ff00) and blue (0000ff) colors
c.addScatterGroup(xData0, yData0, zData0, "Alpha", Chart.GlassSphere2Shape, 9, 0xff0000);
c.addScatterGroup(xData1, yData1, zData1, "Beta", Chart.GlassSphere2Shape, 9, 0x00ff00);
c.addScatterGroup(xData2, yData2, zData2, "Gamma", Chart.GlassSphere2Shape, 9, 0x0000ff);
// Set the x, y and z axis titles
c.xAxis().setTitle("X-Axis Place Holder");
c.yAxis().setTitle("Y-Axis Place Holder");
c.zAxis().setTitle("Z-Axis Place Holder");
// Output the chart
viewer.Image = c.makeWebImage(Chart.SVG);
// Include tool tip for the chart
viewer.ImageMap = c.getHTMLImageMap("", "",
"title='<*cdml*><*b*><*u*>{dataSetName}<*/u*><*/b*><*br*>X={x|p}<*br*>Y={y|p}<*br*>" +
"Z={z|p}'");
}
}
}@{ Layout = null; }
<!DOCTYPE html>
<html>
<head>
<meta name="viewport" content="width=device-width" />
<title>@ViewBag.Title</title>
<style>
@ViewBag.Style
</style>
@Scripts.Render("~/Scripts/cdjcv.js")
</head>
<body style="margin:5px 0px 0px 5px">
<div style="font:bold 18pt verdana;">
@ViewBag.Title
</div>
<hr style="border:solid 1px #000080; background:#000080" />
<div>
@{
if (ViewBag.Viewer is Array)
{
// Display multiple charts
for (int i = 0; i < ViewBag.Viewer.Length; ++i)
{
@:@Html.Raw(ViewBag.Viewer[i].RenderHTML())
}
}
else
{
// Display one chart only
@:@Html.Raw(ViewBag.Viewer.RenderHTML())
}
}
</div>
</body>
</html>