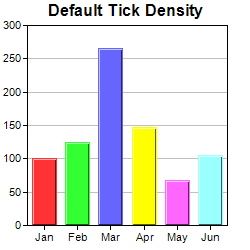
This example demonstrates how to control the axis tick density in auto-scaling.
By default, in auto-scaling, ChartDirector automatically chooses the tick spacing for the axis.
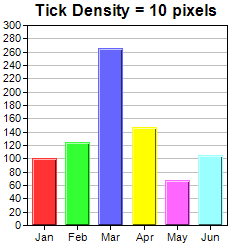
In some cases, you may want to suggest the tick spacing to use. This can be done by using
Axis.setTickDensity.
Note that the actual tick spacing chosen by ChartDirector may not be equal to the suggested tick spacing. The suggested tick spacing is only a lower bound. It is because there may be other constraints when choosing the ticks. For example, the tick positions should be "neat numbers", such as (0, 5, 10, ...), and not arbitrary numbers like (0, 4.792, 9.584, ...). Also, by default, the axis starts and ends at tick positions (configurable using
Axis.setRounding), which means the axis length must be divisible by the tick spacing. These and other constraints will affect the exact ticks being chosen.
In this example, one of the charts is drawn using the default tick spacing. The other chart is drawn using a suggested tick spacing of 10 pixels. Note that the actual tick spacing is slightly larger than 10 pixels.
[Windows Forms - C# version] NetWinCharts\CSharpWinCharts\ticks.cs
using System;
using ChartDirector;

namespace CSharpChartExplorer
{
    public class ticks : DemoModule
    {
        //Name of demo module
        public string getName() { return "Tick Density"; }

        //Number of charts produced in this demo module
        public int getNoOfCharts() { return 2; }

        //Main code for creating charts
        public void createChart(WinChartViewer viewer, int chartIndex)
        {
            // The data for the chart
            double[] data = {100, 125, 265, 147, 67, 105};
            string[] labels = {"Jan", "Feb", "Mar", "Apr", "May", "Jun"};

            // Create a XYChart object of size 250 x 250 pixels
            XYChart c = new XYChart(250, 250);

            // Set the plot area at (27, 25) and of size 200 x 200 pixels
            c.setPlotArea(27, 25, 200, 200);

            if (chartIndex == 1) {
                // High tick density, uses 10 pixels as tick spacing
                c.addTitle("Tick Density = 10 pixels");
                c.yAxis().setTickDensity(10);
            } else {
                // Normal tick density, just use the default setting
                c.addTitle("Default Tick Density");
            }

            // Set the labels on the x axis
            c.xAxis().setLabels(labels);

            // Add a color bar layer using the given data. Use a 1 pixel 3D border for the bars.
            c.addBarLayer3(data).setBorderColor(-1, 1);

            // Output the chart
            viewer.Chart = c;

            //include tool tip for the chart
            viewer.ImageMap = c.getHTMLImageMap("clickable", "",
                "title='Revenue for {xLabel}: US${value}M'");
        }
    }
}
[Windows Forms - VB Version] NetWinCharts\VBNetWinCharts\ticks.vb
Imports System
Imports Microsoft.VisualBasic
Imports ChartDirector

Public Class ticks
    Implements DemoModule

    'Name of demo module
    Public Function getName() As String Implements DemoModule.getName
        Return "Tick Density"
    End Function

    'Number of charts produced in this demo module
    Public Function getNoOfCharts() As Integer Implements DemoModule.getNoOfCharts
        Return 2
    End Function

    'Main code for creating charts
    Public Sub createChart(viewer As WinChartViewer, chartIndex As Integer) _
        Implements DemoModule.createChart

        ' The data for the chart
        Dim data() As Double = {100, 125, 265, 147, 67, 105}
        Dim labels() As String = {"Jan", "Feb", "Mar", "Apr", "May", "Jun"}

        ' Create a XYChart object of size 250 x 250 pixels
        Dim c As XYChart = New XYChart(250, 250)

        ' Set the plot area at (27, 25) and of size 200 x 200 pixels
        c.setPlotArea(27, 25, 200, 200)

        If chartIndex = 1 Then
            ' High tick density, uses 10 pixels as tick spacing
            c.addTitle("Tick Density = 10 pixels")
            c.yAxis().setTickDensity(10)
        Else
            ' Normal tick density, just use the default setting
            c.addTitle("Default Tick Density")
        End If

        ' Set the labels on the x axis
        c.xAxis().setLabels(labels)

        ' Add a color bar layer using the given data. Use a 1 pixel 3D border for the bars.
        c.addBarLayer3(data).setBorderColor(-1, 1)

        ' Output the chart
        viewer.Chart = c

        'include tool tip for the chart
        viewer.ImageMap = c.getHTMLImageMap("clickable", "", _
            "title='Revenue for {xLabel}: US${value}M'")

    End Sub

End Class
[WPF - C#] NetWPFCharts\CSharpWPFCharts\ticks.cs
using System;
using ChartDirector;

namespace CSharpWPFCharts
{
    public class ticks : DemoModule
    {
        //Name of demo module
        public string getName() { return "Tick Density"; }

        //Number of charts produced in this demo module
        public int getNoOfCharts() { return 2; }

        //Main code for creating charts
        public void createChart(WPFChartViewer viewer, int chartIndex)
        {
            // The data for the chart
            double[] data = {100, 125, 265, 147, 67, 105};
            string[] labels = {"Jan", "Feb", "Mar", "Apr", "May", "Jun"};

            // Create a XYChart object of size 250 x 250 pixels
            XYChart c = new XYChart(250, 250);

            // Set the plot area at (27, 25) and of size 200 x 200 pixels
            c.setPlotArea(27, 25, 200, 200);

            if (chartIndex == 1) {
                // High tick density, uses 10 pixels as tick spacing
                c.addTitle("Tick Density = 10 pixels");
                c.yAxis().setTickDensity(10);
            } else {
                // Normal tick density, just use the default setting
                c.addTitle("Default Tick Density");
            }

            // Set the labels on the x axis
            c.xAxis().setLabels(labels);

            // Add a color bar layer using the given data. Use a 1 pixel 3D border for the bars.
            c.addBarLayer3(data).setBorderColor(-1, 1);

            // Output the chart
            viewer.Chart = c;

            //include tool tip for the chart
            viewer.ImageMap = c.getHTMLImageMap("clickable", "",
                "title='Revenue for {xLabel}: US${value}M'");
        }
    }
}
[ASP.NET Web Forms - C# version] NetWebCharts\CSharpASP\ticks.aspx
(Click here on how to convert this code to code-behind style.)<%@ Page Language="C#" Debug="true" %>
<%@ Import Namespace="ChartDirector" %>
<%@ Register TagPrefix="chart" Namespace="ChartDirector" Assembly="netchartdir" %>
<!DOCTYPE html>
<script runat="server">
//
// Create chart
//
protected void createChart(WebChartViewer viewer, int chartIndex)
{
// The data for the chart
double[] data = {100, 125, 265, 147, 67, 105};
string[] labels = {"Jan", "Feb", "Mar", "Apr", "May", "Jun"};
// Create a XYChart object of size 250 x 250 pixels
XYChart c = new XYChart(250, 250);
// Set the plot area at (27, 25) and of size 200 x 200 pixels
c.setPlotArea(27, 25, 200, 200);
if (chartIndex == 1) {
// High tick density, uses 10 pixels as tick spacing
c.addTitle("Tick Density = 10 pixels");
c.yAxis().setTickDensity(10);
} else {
// Normal tick density, just use the default setting
c.addTitle("Default Tick Density");
}
// Set the labels on the x axis
c.xAxis().setLabels(labels);
// Add a color bar layer using the given data. Use a 1 pixel 3D border for the bars.
c.addBarLayer3(data).setBorderColor(-1, 1);
// Output the chart
viewer.Image = c.makeWebImage(Chart.SVG);
// Include tool tip for the chart
viewer.ImageMap = c.getHTMLImageMap("", "", "title='Revenue for {xLabel}: US${value}M'");
}
//
// Page Load event handler
//
protected void Page_Load(object sender, EventArgs e)
{
createChart(WebChartViewer0, 0);
createChart(WebChartViewer1, 1);
}
</script>
<html>
<head>
<script type="text/javascript" src="cdjcv.js"></script>
</head>
<body>
<chart:WebChartViewer id="WebChartViewer0" runat="server" />
<chart:WebChartViewer id="WebChartViewer1" runat="server" />
</body>
</html>
[ASP.NET Web Forms - VB Version] NetWebCharts\VBNetASP\ticks.aspx
(Click here on how to convert this code to code-behind style.)<%@ Page Language="VB" Debug="true" %>
<%@ Import Namespace="ChartDirector" %>
<%@ Register TagPrefix="chart" Namespace="ChartDirector" Assembly="netchartdir" %>
<!DOCTYPE html>
<script runat="server">
'
' Create chart
'
Protected Sub createChart(viewer As WebChartViewer, chartIndex As Integer)
' The data for the chart
Dim data() As Double = {100, 125, 265, 147, 67, 105}
Dim labels() As String = {"Jan", "Feb", "Mar", "Apr", "May", "Jun"}
' Create a XYChart object of size 250 x 250 pixels
Dim c As XYChart = New XYChart(250, 250)
' Set the plot area at (27, 25) and of size 200 x 200 pixels
c.setPlotArea(27, 25, 200, 200)
If chartIndex = 1 Then
' High tick density, uses 10 pixels as tick spacing
c.addTitle("Tick Density = 10 pixels")
c.yAxis().setTickDensity(10)
Else
' Normal tick density, just use the default setting
c.addTitle("Default Tick Density")
End If
' Set the labels on the x axis
c.xAxis().setLabels(labels)
' Add a color bar layer using the given data. Use a 1 pixel 3D border for the bars.
c.addBarLayer3(data).setBorderColor(-1, 1)
' Output the chart
viewer.Image = c.makeWebImage(Chart.SVG)
' Include tool tip for the chart
viewer.ImageMap = c.getHTMLImageMap("", "", "title='Revenue for {xLabel}: US${value}M'")
End Sub
'
' Page Load event handler
'
Protected Sub Page_Load(ByVal sender As System.Object, ByVal e As System.EventArgs)
createChart(WebChartViewer0, 0)
createChart(WebChartViewer1, 1)
End Sub
</script>
<html>
<head>
<script type="text/javascript" src="cdjcv.js"></script>
</head>
<body>
<chart:WebChartViewer id="WebChartViewer0" runat="server" />
<chart:WebChartViewer id="WebChartViewer1" runat="server" />
</body>
</html>
[ASP.NET MVC - Controller] NetMvcCharts\Controllers\TicksController.cs
using System;
using System.Web.Mvc;
using ChartDirector;

namespace NetMvcCharts.Controllers
{
    public class TicksController : Controller
    {
        //
        // Default Action
        //
        public ActionResult Index()
        {
            ViewBag.Title = "Tick Density";

            // This example contains 2 charts.
            ViewBag.Viewer = new RazorChartViewer[2];
            for (int i = 0; i < ViewBag.Viewer.Length; ++i)
                createChart(ViewBag.Viewer[i] = new RazorChartViewer(HttpContext, "chart" + i), i);

            return View("~/Views/Shared/ChartView.cshtml");
        }

        //
        // Create chart
        //
        private void createChart(RazorChartViewer viewer, int chartIndex)
        {
            // The data for the chart
            double[] data = {100, 125, 265, 147, 67, 105};
            string[] labels = {"Jan", "Feb", "Mar", "Apr", "May", "Jun"};

            // Create a XYChart object of size 250 x 250 pixels
            XYChart c = new XYChart(250, 250);

            // Set the plot area at (27, 25) and of size 200 x 200 pixels
            c.setPlotArea(27, 25, 200, 200);

            if (chartIndex == 1) {
                // High tick density, uses 10 pixels as tick spacing
                c.addTitle("Tick Density = 10 pixels");
                c.yAxis().setTickDensity(10);
            } else {
                // Normal tick density, just use the default setting
                c.addTitle("Default Tick Density");
            }

            // Set the labels on the x axis
            c.xAxis().setLabels(labels);

            // Add a color bar layer using the given data. Use a 1 pixel 3D border for the bars.
            c.addBarLayer3(data).setBorderColor(-1, 1);

            // Output the chart
            viewer.Image = c.makeWebImage(Chart.SVG);

            // Include tool tip for the chart
            viewer.ImageMap = c.getHTMLImageMap("", "", "title='Revenue for {xLabel}: US${value}M'");
        }
    }
}
[ASP.NET MVC - View] NetMvcCharts\Views\Shared\ChartView.cshtml
@{ Layout = null; }

<!DOCTYPE html>

<html>
<head>
    <meta name="viewport" content="width=device-width" />
    <title>@ViewBag.Title</title>
    <style>
        @ViewBag.Style
    </style>
    @Scripts.Render("~/Scripts/cdjcv.js")
</head>
<body style="margin:5px 0px 0px 5px">
    <div style="font:bold 18pt verdana;">
        @ViewBag.Title
    </div>
    <hr style="border:solid 1px #000080; background:#000080" />
    <div>
        @{
            if (ViewBag.Viewer is Array)
            {
                // Display multiple charts
                for (int i = 0; i < ViewBag.Viewer.Length; ++i)
                {
                    @:@Html.Raw(ViewBag.Viewer[i].RenderHTML())
                }
            }
            else
            {
                // Display one chart only
                @:@Html.Raw(ViewBag.Viewer.RenderHTML())
            }
        }
    </div>
</body>
</html>
© 2023 Advanced Software Engineering Limited. All rights reserved.