[Windows Forms - C# version] NetWinCharts\CSharpWinCharts\frmtrackfinance.cs
using System;
using System.Collections;
using System.Windows.Forms;
using ChartDirector;
using System.Text.RegularExpressions;
namespace CSharpChartExplorer
{
public partial class FrmTrackFinance : Form
{
public FrmTrackFinance()
{
InitializeComponent();
}
private void FrmTrackFinance_Load(object sender, EventArgs e)
{
// Create a finance chart demo containing 100 days of data
int noOfDays = 100;
// To compute moving averages starting from the first day, we need to get extra data points before
// the first day
int extraDays = 30;
// In this exammple, we use a random number generator utility to simulate the data. We set up the
// random table to create 6 cols x (noOfDays + extraDays) rows, using 9 as the seed.
RanTable rantable = new RanTable(9, 6, noOfDays + extraDays);
// Set the 1st col to be the timeStamp, starting from Sep 4, 2011, with each row representing one
// day, and counting week days only (jump over Sat and Sun)
rantable.setDateCol(0, new DateTime(2011, 9, 4), 86400, true);
// Set the 2nd, 3rd, 4th and 5th columns to be high, low, open and close data. The open value
// starts from 100, and the daily change is random from -5 to 5.
rantable.setHLOCCols(1, 100, -5, 5);
// Set the 6th column as the vol data from 5 to 25 million
rantable.setCol(5, 50000000, 250000000);
// Now we read the data from the table into arrays
double[] timeStamps = rantable.getCol(0);
double[] highData = rantable.getCol(1);
double[] lowData = rantable.getCol(2);
double[] openData = rantable.getCol(3);
double[] closeData = rantable.getCol(4);
double[] volData = rantable.getCol(5);
// Create a FinanceChart object of width 720 pixels
FinanceChart c = new FinanceChart(720);
// Add a title to the chart
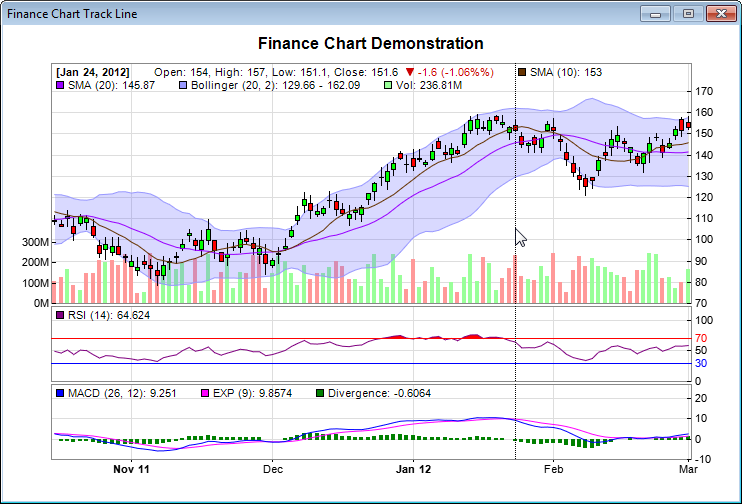
c.addTitle("Finance Chart Demonstration");
// Disable default legend box, as we are using dynamic legend
c.setLegendStyle("normal", 8, Chart.Transparent, Chart.Transparent);
// Set the data into the finance chart object
c.setData(timeStamps, highData, lowData, openData, closeData, volData, extraDays);
// Add the main chart with 240 pixels in height
c.addMainChart(240);
// Add a 10 period simple moving average to the main chart, using brown color
c.addSimpleMovingAvg(10, 0x663300);
// Add a 20 period simple moving average to the main chart, using purple color
c.addSimpleMovingAvg(20, 0x9900ff);
// Add candlestick symbols to the main chart, using green/red for up/down days
c.addCandleStick(0x00ff00, 0xff0000);
// Add 20 days bollinger band to the main chart, using light blue (9999ff) as the border and
// semi-transparent blue (c06666ff) as the fill color
c.addBollingerBand(20, 2, 0x9999ff, unchecked((int)0xc06666ff));
// Add a 75 pixels volume bars sub-chart to the bottom of the main chart, using green/red/grey for
// up/down/flat days
c.addVolBars(75, 0x99ff99, 0xff9999, 0x808080);
// Append a 14-days RSI indicator chart (75 pixels high) after the main chart. The main RSI line
// is purple (800080). Set threshold region to +/- 20 (that is, RSI = 50 +/- 25). The upper/lower
// threshold regions will be filled with red (ff0000)/blue (0000ff).
c.addRSI(75, 14, 0x800080, 20, 0xff0000, 0x0000ff);
// Append a MACD(26, 12) indicator chart (75 pixels high) after the main chart, using 9 days for
// computing divergence.
c.addMACD(75, 26, 12, 9, 0x0000ff, 0xff00ff, 0x008000);
// Include track line with legend for the latest data values
trackFinance(c, ((XYChart)c.getChart(0)).getPlotArea().getRightX());
// Assign the chart to the WinChartViewer
winChartViewer1.Chart = c;
}
//
// Draw track cursor when mouse is moving over plotarea
//
private void winChartViewer1_MouseMovePlotArea(object sender, MouseEventArgs e)
{
WinChartViewer viewer = (WinChartViewer)sender;
trackFinance((MultiChart)viewer.Chart, viewer.PlotAreaMouseX);
viewer.updateDisplay();
}
//
// Draw finance chart track line with legend
//
private void trackFinance(MultiChart m, int mouseX)
{
// Clear the current dynamic layer and get the DrawArea object to draw on it.
DrawArea d = m.initDynamicLayer();
// It is possible for a FinanceChart to be empty, so we need to check for it.
if (m.getChartCount() == 0) {
return ;
}
// Get the data x-value that is nearest to the mouse
int xValue = (int)(((XYChart)m.getChart(0)).getNearestXValue(mouseX));
// Iterate the XY charts (main price chart and indicator charts) in the FinanceChart
XYChart c = null;
for(int i = 0; i < m.getChartCount(); ++i) {
c = (XYChart)m.getChart(i);
// Variables to hold the legend entries
string ohlcLegend = "";
ArrayList legendEntries = new ArrayList();
// Iterate through all layers to find the highest data point
for(int j = 0; j < c.getLayerCount(); ++j) {
Layer layer = c.getLayerByZ(j);
int xIndex = layer.getXIndexOf(xValue);
int dataSetCount = layer.getDataSetCount();
// In a FinanceChart, only layers showing OHLC data can have 4 data sets
if (dataSetCount == 4) {
double highValue = layer.getDataSet(0).getValue(xIndex);
double lowValue = layer.getDataSet(1).getValue(xIndex);
double openValue = layer.getDataSet(2).getValue(xIndex);
double closeValue = layer.getDataSet(3).getValue(xIndex);
if (closeValue != Chart.NoValue) {
// Build the OHLC legend
ohlcLegend = "Open: " + c.formatValue(openValue, "{value|P4}") + ", High: " +
c.formatValue(highValue, "{value|P4}") + ", Low: " + c.formatValue(lowValue,
"{value|P4}") + ", Close: " + c.formatValue(closeValue, "{value|P4}");
// We also draw an upward or downward triangle for up and down days and the %
// change
double lastCloseValue = layer.getDataSet(3).getValue(xIndex - 1);
if (lastCloseValue != Chart.NoValue) {
double change = closeValue - lastCloseValue;
double percent = change * 100 / closeValue;
string symbol = ((change >= 0) ?
"<*font,color=008800*><*img=@triangle,width=8,color=008800*>" :
"<*font,color=CC0000*><*img=@invertedtriangle,width=8,color=CC0000*>");
ohlcLegend = ohlcLegend + " " + symbol + " " + c.formatValue(change,
"{value|P4}") + " (" + c.formatValue(percent, "{value|2}") + "%)<*/font*>"
;
}
// Use a <*block*> to make sure the line does not wrap within the legend entry
ohlcLegend = "<*block*>" + ohlcLegend + " <*/*>";
}
} else {
// Iterate through all the data sets in the layer
for(int k = 0; k < layer.getDataSetCount(); ++k) {
ChartDirector.DataSet dataSet = layer.getDataSetByZ(k);
string name = dataSet.getDataName();
double value = dataSet.getValue(xIndex);
if ((!string.IsNullOrEmpty(name)) && (value != Chart.NoValue)) {
// In a FinanceChart, the data set name consists of the indicator name and its
// latest value. It is like "Vol: 123M" or "RSI (14): 55.34". As we are
// generating the values dynamically, we need to extract the indictor name
// out, and also the volume unit (if any).
// The unit character, if any, is the last character and must not be a digit.
string unitChar = name.Substring(name.Length - 1);
if ((unitChar.CompareTo("0") >= 0) && (unitChar.CompareTo("9") <= 0)) {
unitChar = "";
}
// The indicator name is the part of the name up to the colon character.
int delimiterPosition = name.IndexOf(":");
if (delimiterPosition != -1) {
name = name.Substring(0, delimiterPosition);
}
// In a FinanceChart, if there are two data sets, it must be representing a
// range.
if (dataSetCount == 2) {
// We show both values in the range in a single legend entry
value = layer.getDataSet(0).getValue(xIndex);
double value2 = layer.getDataSet(1).getValue(xIndex);
name = name + ": " + c.formatValue(Math.Min(value, value2), "{value|P3}")
+ " - " + c.formatValue(Math.Max(value, value2), "{value|P3}");
} else {
// In a FinanceChart, only the layer for volume bars has 3 data sets for
// up/down/flat days
if (dataSetCount == 3) {
// The actual volume is the sum of the 3 data sets.
value = layer.getDataSet(0).getValue(xIndex) + layer.getDataSet(1
).getValue(xIndex) + layer.getDataSet(2).getValue(xIndex);
}
// Create the legend entry
name = name + ": " + c.formatValue(value, "{value|P3}") + unitChar;
}
// Build the legend entry, consist of a colored square box and the name (with
// the data value in it).
legendEntries.Add("<*block*><*img=@square,width=8,edgeColor=000000,color=" +
dataSet.getDataColor().ToString("x") + "*> " + name + "<*/*>");
}
}
}
}
// Get the plot area position relative to the entire FinanceChart
PlotArea plotArea = c.getPlotArea();
int plotAreaLeftX = plotArea.getLeftX() + c.getAbsOffsetX();
int plotAreaTopY = plotArea.getTopY() + c.getAbsOffsetY();
// The legend is formed by concatenating the legend entries.
legendEntries.Reverse();
string legendText = String.Join(" ", (string[])legendEntries.ToArray(typeof(string)));
// Add the date and the ohlcLegend (if any) at the beginning of the legend
legendText = "<*block,valign=top,maxWidth=" + (plotArea.getWidth() - 5) +
"*><*font=Arial Bold*>[" + c.xAxis().getFormattedLabel(xValue, "mmm dd, yyyy") +
"]<*/font*> " + ohlcLegend + legendText;
// Draw a vertical track line at the x-position
d.vline(plotAreaTopY, plotAreaTopY + plotArea.getHeight(), c.getXCoor(xValue) +
c.getAbsOffsetX(), d.dashLineColor(0x000000, 0x0101));
// Display the legend on the top of the plot area
TTFText t = d.text(legendText, "Arial", 8);
t.draw(plotAreaLeftX + 5, plotAreaTopY + 3, 0x000000, Chart.TopLeft);
}
}
}
}
[Windows Forms - VB Version] NetWinCharts\VBNetWinCharts\frmtrackfinance.vb
Imports ChartDirector
Imports System.Collections
Imports System.Text.RegularExpressions

Public Class FrmTrackFinance

    Private Sub FrmTrackFinance_Load(ByVal sender As Object, ByVal e As System.EventArgs) Handles MyBase.Load

        ' Create a finance chart demo containing 100 days of data
        Dim noOfDays As Integer = 100

        ' To compute moving averages starting from the first day, we need to get extra data points before the
        ' first day
        Dim extraDays As Integer = 30

        ' In this exammple, we use a random number generator utility to simulate the data. We set up the
        ' random table to create 6 cols x (noOfDays + extraDays) rows, using 9 as the seed.
        Dim rantable As RanTable = New RanTable(9, 6, noOfDays + extraDays)

        ' Set the 1st col to be the timeStamp, starting from Sep 4, 2011, with each row representing one day,
        ' and counting week days only (jump over Sat and Sun)
        rantable.setDateCol(0, DateSerial(2011, 9, 4), 86400, True)

        ' Set the 2nd, 3rd, 4th and 5th columns to be high, low, open and close data. The open value starts
        ' from 100, and the daily change is random from -5 to 5.
        rantable.setHLOCCols(1, 100, -5, 5)

        ' Set the 6th column as the vol data from 5 to 25 million
        rantable.setCol(5, 50000000, 250000000)

        ' Now we read the data from the table into arrays
        Dim timeStamps() As Double = rantable.getCol(0)
        Dim highData() As Double = rantable.getCol(1)
        Dim lowData() As Double = rantable.getCol(2)
        Dim openData() As Double = rantable.getCol(3)
        Dim closeData() As Double = rantable.getCol(4)
        Dim volData() As Double = rantable.getCol(5)

        ' Create a FinanceChart object of width 720 pixels
        Dim c As FinanceChart = New FinanceChart(720)

        ' Add a title to the chart
        c.addTitle("Finance Chart Demonstration")

        ' Disable default legend box, as we are using dynamic legend
        c.setLegendStyle("normal", 8, Chart.Transparent, Chart.Transparent)

        ' Set the data into the finance chart object
        c.setData(timeStamps, highData, lowData, openData, closeData, volData, extraDays)

        ' Add the main chart with 240 pixels in height
        c.addMainChart(240)

        ' Add a 10 period simple moving average to the main chart, using brown color
        c.addSimpleMovingAvg(10, &H663300)

        ' Add a 20 period simple moving average to the main chart, using purple color
        c.addSimpleMovingAvg(20, &H9900ff)

        ' Add candlestick symbols to the main chart, using green/red for up/down days
        c.addCandleStick(&H00ff00, &Hff0000)

        ' Add 20 days bollinger band to the main chart, using light blue (9999ff) as the border and
        ' semi-transparent blue (c06666ff) as the fill color
        c.addBollingerBand(20, 2, &H9999ff, &Hc06666ff)

        ' Add a 75 pixels volume bars sub-chart to the bottom of the main chart, using green/red/grey for
        ' up/down/flat days
        c.addVolBars(75, &H99ff99, &Hff9999, &H808080)

        ' Append a 14-days RSI indicator chart (75 pixels high) after the main chart. The main RSI line is
        ' purple (800080). Set threshold region to +/- 20 (that is, RSI = 50 +/- 25). The upper/lower
        ' threshold regions will be filled with red (ff0000)/blue (0000ff).
        c.addRSI(75, 14, &H800080, 20, &Hff0000, &H0000ff)

        ' Append a MACD(26, 12) indicator chart (75 pixels high) after the main chart, using 9 days for
        ' computing divergence.
        c.addMACD(75, 26, 12, 9, &H0000ff, &Hff00ff, &H008000)

        ' Include track line with legend for the latest data values
        trackFinance(c, CType(c.getChart(0), XYChart).getPlotArea().getRightX())

        ' Assign the chart to the WinChartViewer
        winChartViewer1.Chart = c

    End Sub

    '
    ' Draw track cursor when mouse is moving over plotarea
    '
    Private Sub winChartViewer1_MouseMovePlotArea(ByVal sender As Object, _
        ByVal e As System.Windows.Forms.MouseEventArgs) Handles winChartViewer1.MouseMovePlotArea

        Dim viewer As WinChartViewer = sender
        trackFinance(viewer.Chart, viewer.PlotAreaMouseX)
        viewer.updateDisplay()

    End Sub

    '
    ' Draw finance chart track line with legend
    '
    Private Sub trackFinance(m As MultiChart, mouseX As Integer)

        ' Clear the current dynamic layer and get the DrawArea object to draw on it.
        Dim d As DrawArea = m.initDynamicLayer()

        ' It is possible for a FinanceChart to be empty, so we need to check for it.
        If m.getChartCount() = 0 Then
            Return
        End If

        ' Get the data x-value that is nearest to the mouse
        Dim xValue As Integer = Int(CType(m.getChart(0), XYChart).getNearestXValue(mouseX))

        ' Iterate the XY charts (main price chart and indicator charts) in the FinanceChart
        Dim c As XYChart = Nothing
        For i As Integer = 0 To m.getChartCount() - 1
            c = CType(m.getChart(i), XYChart)

            ' Variables to hold the legend entries
            Dim ohlcLegend As String = ""
            Dim legendEntries As ArrayList = New ArrayList()

            ' Iterate through all layers to find the highest data point
            For j As Integer = 0 To c.getLayerCount() - 1
                Dim layer As Layer = c.getLayerByZ(j)
                Dim xIndex As Integer = layer.getXIndexOf(xValue)
                Dim dataSetCount As Integer = layer.getDataSetCount()

                ' In a FinanceChart, only layers showing OHLC data can have 4 data sets
                If dataSetCount = 4 Then
                    Dim highValue As Double = layer.getDataSet(0).getValue(xIndex)
                    Dim lowValue As Double = layer.getDataSet(1).getValue(xIndex)
                    Dim openValue As Double = layer.getDataSet(2).getValue(xIndex)
                    Dim closeValue As Double = layer.getDataSet(3).getValue(xIndex)

                    If closeValue <> Chart.NoValue Then
                        ' Build the OHLC legend
                        ohlcLegend = "Open: " & c.formatValue(openValue, "{value|P4}") & ", High: " & _
                            c.formatValue(highValue, "{value|P4}") & ", Low: " & c.formatValue(lowValue, _
                            "{value|P4}") & ", Close: " & c.formatValue(closeValue, "{value|P4}")

                        ' We also draw an upward or downward triangle for up and down days and the % change
                        Dim lastCloseValue As Double = layer.getDataSet(3).getValue(xIndex - 1)
                        If lastCloseValue <> Chart.NoValue Then
                            Dim change As Double = closeValue - lastCloseValue
                            Dim percent As Double = change * 100 / closeValue
                            Dim symbol As String = IIf(change >= 0, _
                                "<*font,color=008800*><*img=@triangle,width=8,color=008800*>", _
                                "<*font,color=CC0000*><*img=@invertedtriangle,width=8,color=CC0000*>")

                            ohlcLegend = ohlcLegend & "  " & symbol & " " & c.formatValue(change, _
                                "{value|P4}") & " (" & c.formatValue(percent, "{value|2}") & "%)<*/font*>"
                        End If

                        ' Use a <*block*> to make sure the line does not wrap within the legend entry
                        ohlcLegend = "<*block*>" & ohlcLegend & "      <*/*>"
                    End If
                Else
                    ' Iterate through all the data sets in the layer
                    For k As Integer = 0 To layer.getDataSetCount() - 1
                        Dim dataSet As ChartDirector.DataSet = layer.getDataSetByZ(k)

                        Dim name As String = dataSet.getDataName()
                        Dim value As Double = dataSet.getValue(xIndex)
                        If (Not String.IsNullOrEmpty(name)) AndAlso (value <> Chart.NoValue) Then

                            ' In a FinanceChart, the data set name consists of the indicator name and its
                            ' latest value. It is like "Vol: 123M" or "RSI (14): 55.34". As we are generating
                            ' the values dynamically, we need to extract the indictor name out, and also the
                            ' volume unit (if any).

                            ' The unit character, if any, is the last character and must not be a digit.
                            Dim unitChar As String = name.Substring(name.Length - 1)
                            If (unitChar.CompareTo("0") >= 0) AndAlso (unitChar.CompareTo("9") <= 0) Then
                                unitChar = ""
                            End If

                            ' The indicator name is the part of the name up to the colon character.
                            Dim delimiterPosition As Integer = name.IndexOf(":")
                            If delimiterPosition <> -1 Then
                                name = name.Substring(0, delimiterPosition)
                            End If

                            ' In a FinanceChart, if there are two data sets, it must be representing a range.
                            If dataSetCount = 2 Then
                                ' We show both values in the range in a single legend entry
                                value = layer.getDataSet(0).getValue(xIndex)
                                Dim value2 As Double = layer.getDataSet(1).getValue(xIndex)
                                name = name & ": " & c.formatValue(Math.Min(value, value2), "{value|P3}") & _
                                    " - " & c.formatValue(Math.Max(value, value2), "{value|P3}")
                            Else
                                ' In a FinanceChart, only the layer for volume bars has 3 data sets for
                                ' up/down/flat days
                                If dataSetCount = 3 Then
                                    ' The actual volume is the sum of the 3 data sets.
                                    value = layer.getDataSet(0).getValue(xIndex) + layer.getDataSet(1 _
                                        ).getValue(xIndex) + layer.getDataSet(2).getValue(xIndex)
                                End If

                                ' Create the legend entry
                                name = name & ": " & c.formatValue(value, "{value|P3}") & unitChar
                            End If

                            ' Build the legend entry, consist of a colored square box and the name (with the
                            ' data value in it).
                            legendEntries.Add("<*block*><*img=@square,width=8,edgeColor=000000,color=" & _
                                Hex(dataSet.getDataColor()) & "*> " & name & "<*/*>")
                        End If
                    Next
                End If
            Next

            ' Get the plot area position relative to the entire FinanceChart
            Dim plotArea As PlotArea = c.getPlotArea()
            Dim plotAreaLeftX As Integer = plotArea.getLeftX() + c.getAbsOffsetX()
            Dim plotAreaTopY As Integer = plotArea.getTopY() + c.getAbsOffsetY()

            ' The legend is formed by concatenating the legend entries.
            legendEntries.Reverse()
            Dim legendText As String = Join(CType(legendEntries.ToArray(GetType(String)), String()), _
                "      ")

            ' Add the date and the ohlcLegend (if any) at the beginning of the legend
            legendText = "<*block,valign=top,maxWidth=" & (plotArea.getWidth() - 5) & _
                "*><*font=Arial Bold*>[" & c.xAxis().getFormattedLabel(xValue, "mmm dd, yyyy") & _
                "]<*/font*>      " & ohlcLegend & legendText

            ' Draw a vertical track line at the x-position
            d.vline(plotAreaTopY, plotAreaTopY + plotArea.getHeight(), c.getXCoor(xValue) + c.getAbsOffsetX( _
                ), d.dashLineColor(&H000000, &H0101))

            ' Display the legend on the top of the plot area
            Dim t As TTFText = d.text(legendText, "Arial", 8)
            t.draw(plotAreaLeftX + 5, plotAreaTopY + 3, &H000000, Chart.TopLeft)
        Next

    End Sub

End Class
[WPF - XAML] NetWPFCharts\CSharpWPFCharts\TrackFinanceWindow.xaml
<Window x:Class="CSharpWPFCharts.TrackFinanceWindow"
        xmlns="http://schemas.microsoft.com/winfx/2006/xaml/presentation"
        xmlns:x="http://schemas.microsoft.com/winfx/2006/xaml"
        xmlns:d="http://schemas.microsoft.com/expression/blend/2008"
        xmlns:mc="http://schemas.openxmlformats.org/markup-compatibility/2006"
        xmlns:local="clr-namespace:CSharpWPFCharts"
        mc:Ignorable="d"
        xmlns:ChartDirector="clr-namespace:ChartDirector;assembly=netchartdir" UseLayoutRounding="True"
        Title="Finance Chart Track Line" SizeToContent="WidthAndHeight" ResizeMode="NoResize" Loaded="Window_Loaded">
    <Grid>
        <ChartDirector:WPFChartViewer x:Name="WPFChartViewer1" Margin="5" MouseMovePlotArea="WPFChartViewer1_MouseMovePlotArea" />
    </Grid>
</Window>
[WPF - C#] NetWPFCharts\CSharpWPFCharts\TrackFinanceWindow.xaml.cs
using System;
using System.Collections;
using System.Windows;
using System.Windows.Input;
using ChartDirector;
using System.Text.RegularExpressions;

namespace CSharpWPFCharts
{
    public partial class TrackFinanceWindow : Window
    {
        public TrackFinanceWindow()
        {
            InitializeComponent();
        }

        private void Window_Loaded(object sender, RoutedEventArgs e)
        {
            // Create a finance chart demo containing 100 days of data
            int noOfDays = 100;

            // To compute moving averages starting from the first day, we need to get extra data points before
            // the first day
            int extraDays = 30;

            // In this exammple, we use a random number generator utility to simulate the data. We set up the
            // random table to create 6 cols x (noOfDays + extraDays) rows, using 9 as the seed.
            RanTable rantable = new RanTable(9, 6, noOfDays + extraDays);

            // Set the 1st col to be the timeStamp, starting from Sep 4, 2011, with each row representing one
            // day, and counting week days only (jump over Sat and Sun)
            rantable.setDateCol(0, new DateTime(2011, 9, 4), 86400, true);

            // Set the 2nd, 3rd, 4th and 5th columns to be high, low, open and close data. The open value
            // starts from 100, and the daily change is random from -5 to 5.
            rantable.setHLOCCols(1, 100, -5, 5);

            // Set the 6th column as the vol data from 5 to 25 million
            rantable.setCol(5, 50000000, 250000000);

            // Now we read the data from the table into arrays
            double[] timeStamps = rantable.getCol(0);
            double[] highData = rantable.getCol(1);
            double[] lowData = rantable.getCol(2);
            double[] openData = rantable.getCol(3);
            double[] closeData = rantable.getCol(4);
            double[] volData = rantable.getCol(5);

            // Create a FinanceChart object of width 720 pixels
            FinanceChart c = new FinanceChart(720);

            // Add a title to the chart
            c.addTitle("Finance Chart Demonstration");

            // Disable default legend box, as we are using dynamic legend
            c.setLegendStyle("normal", 8, Chart.Transparent, Chart.Transparent);

            // Set the data into the finance chart object
            c.setData(timeStamps, highData, lowData, openData, closeData, volData, extraDays);

            // Add the main chart with 240 pixels in height
            c.addMainChart(240);

            // Add a 10 period simple moving average to the main chart, using brown color
            c.addSimpleMovingAvg(10, 0x663300);

            // Add a 20 period simple moving average to the main chart, using purple color
            c.addSimpleMovingAvg(20, 0x9900ff);

            // Add candlestick symbols to the main chart, using green/red for up/down days
            c.addCandleStick(0x00ff00, 0xff0000);

            // Add 20 days bollinger band to the main chart, using light blue (9999ff) as the border and
            // semi-transparent blue (c06666ff) as the fill color
            c.addBollingerBand(20, 2, 0x9999ff, unchecked((int)0xc06666ff));

            // Add a 75 pixels volume bars sub-chart to the bottom of the main chart, using green/red/grey for
            // up/down/flat days
            c.addVolBars(75, 0x99ff99, 0xff9999, 0x808080);

            // Append a 14-days RSI indicator chart (75 pixels high) after the main chart. The main RSI line
            // is purple (800080). Set threshold region to +/- 20 (that is, RSI = 50 +/- 25). The upper/lower
            // threshold regions will be filled with red (ff0000)/blue (0000ff).
            c.addRSI(75, 14, 0x800080, 20, 0xff0000, 0x0000ff);

            // Append a MACD(26, 12) indicator chart (75 pixels high) after the main chart, using 9 days for
            // computing divergence.
            c.addMACD(75, 26, 12, 9, 0x0000ff, 0xff00ff, 0x008000);

            // Include track line with legend for the latest data values
            trackFinance(c, ((XYChart)c.getChart(0)).getPlotArea().getRightX());

            // Assign the chart to the WPFChartViewer
            WPFChartViewer1.Chart = c;
        }

        //
        // Draw track cursor when mouse is moving over plotarea
        //
        private void WPFChartViewer1_MouseMovePlotArea(object sender, MouseEventArgs e)
        {
            WPFChartViewer viewer = (WPFChartViewer)sender;
            trackFinance((MultiChart)viewer.Chart, viewer.PlotAreaMouseX);
            viewer.updateDisplay();
        }

        //
        // Draw finance chart track line with legend
        //
        private void trackFinance(MultiChart m, int mouseX)
        {
            // Clear the current dynamic layer and get the DrawArea object to draw on it.
            DrawArea d = m.initDynamicLayer();

            // It is possible for a FinanceChart to be empty, so we need to check for it.
            if (m.getChartCount() == 0) {
                return ;
            }

            // Get the data x-value that is nearest to the mouse
            int xValue = (int)(((XYChart)m.getChart(0)).getNearestXValue(mouseX));

            // Iterate the XY charts (main price chart and indicator charts) in the FinanceChart
            XYChart c = null;
            for(int i = 0; i < m.getChartCount(); ++i) {
                c = (XYChart)m.getChart(i);

                // Variables to hold the legend entries
                string ohlcLegend = "";
                ArrayList legendEntries = new ArrayList();

                // Iterate through all layers to find the highest data point
                for(int j = 0; j < c.getLayerCount(); ++j) {
                    Layer layer = c.getLayerByZ(j);
                    int xIndex = layer.getXIndexOf(xValue);
                    int dataSetCount = layer.getDataSetCount();

                    // In a FinanceChart, only layers showing OHLC data can have 4 data sets
                    if (dataSetCount == 4) {
                        double highValue = layer.getDataSet(0).getValue(xIndex);
                        double lowValue = layer.getDataSet(1).getValue(xIndex);
                        double openValue = layer.getDataSet(2).getValue(xIndex);
                        double closeValue = layer.getDataSet(3).getValue(xIndex);

                        if (closeValue != Chart.NoValue) {
                            // Build the OHLC legend
                            ohlcLegend = "Open: " + c.formatValue(openValue, "{value|P4}") + ", High: " +
                                c.formatValue(highValue, "{value|P4}") + ", Low: " + c.formatValue(lowValue,
                                "{value|P4}") + ", Close: " + c.formatValue(closeValue, "{value|P4}");

                            // We also draw an upward or downward triangle for up and down days and the %
                            // change
                            double lastCloseValue = layer.getDataSet(3).getValue(xIndex - 1);
                            if (lastCloseValue != Chart.NoValue) {
                                double change = closeValue - lastCloseValue;
                                double percent = change * 100 / closeValue;
                                string symbol = ((change >= 0) ?
                                    "<*font,color=008800*><*img=@triangle,width=8,color=008800*>" :
                                    "<*font,color=CC0000*><*img=@invertedtriangle,width=8,color=CC0000*>");

                                ohlcLegend = ohlcLegend + "  " + symbol + " " + c.formatValue(change,
                                    "{value|P4}") + " (" + c.formatValue(percent, "{value|2}") + "%)<*/font*>"
                                    ;
                            }

                            // Use a <*block*> to make sure the line does not wrap within the legend entry
                            ohlcLegend = "<*block*>" + ohlcLegend + "      <*/*>";
                        }
                    } else {
                        // Iterate through all the data sets in the layer
                        for(int k = 0; k < layer.getDataSetCount(); ++k) {
                            ChartDirector.DataSet dataSet = layer.getDataSetByZ(k);

                            string name = dataSet.getDataName();
                            double value = dataSet.getValue(xIndex);
                            if ((!string.IsNullOrEmpty(name)) && (value != Chart.NoValue)) {

                                // In a FinanceChart, the data set name consists of the indicator name and its
                                // latest value. It is like "Vol: 123M" or "RSI (14): 55.34". As we are
                                // generating the values dynamically, we need to extract the indictor name
                                // out, and also the volume unit (if any).

                                // The unit character, if any, is the last character and must not be a digit.
                                string unitChar = name.Substring(name.Length - 1);
                                if ((unitChar.CompareTo("0") >= 0) && (unitChar.CompareTo("9") <= 0)) {
                                    unitChar = "";
                                }

                                // The indicator name is the part of the name up to the colon character.
                                int delimiterPosition = name.IndexOf(":");
                                if (delimiterPosition != -1) {
                                    name = name.Substring(0, delimiterPosition);
                                }

                                // In a FinanceChart, if there are two data sets, it must be representing a
                                // range.
                                if (dataSetCount == 2) {
                                    // We show both values in the range in a single legend entry
                                    value = layer.getDataSet(0).getValue(xIndex);
                                    double value2 = layer.getDataSet(1).getValue(xIndex);
                                    name = name + ": " + c.formatValue(Math.Min(value, value2), "{value|P3}")
                                         + " - " + c.formatValue(Math.Max(value, value2), "{value|P3}");
                                } else {
                                    // In a FinanceChart, only the layer for volume bars has 3 data sets for
                                    // up/down/flat days
                                    if (dataSetCount == 3) {
                                        // The actual volume is the sum of the 3 data sets.
                                        value = layer.getDataSet(0).getValue(xIndex) + layer.getDataSet(1
                                            ).getValue(xIndex) + layer.getDataSet(2).getValue(xIndex);
                                    }

                                    // Create the legend entry
                                    name = name + ": " + c.formatValue(value, "{value|P3}") + unitChar;
                                }

                                // Build the legend entry, consist of a colored square box and the name (with
                                // the data value in it).
                                legendEntries.Add("<*block*><*img=@square,width=8,edgeColor=000000,color=" +
                                    dataSet.getDataColor().ToString("x") + "*> " + name + "<*/*>");
                            }
                        }
                    }
                }

                // Get the plot area position relative to the entire FinanceChart
                PlotArea plotArea = c.getPlotArea();
                int plotAreaLeftX = plotArea.getLeftX() + c.getAbsOffsetX();
                int plotAreaTopY = plotArea.getTopY() + c.getAbsOffsetY();

                // The legend is formed by concatenating the legend entries.
                legendEntries.Reverse();
                string legendText = String.Join("      ", (string[])legendEntries.ToArray(typeof(string)));

                // Add the date and the ohlcLegend (if any) at the beginning of the legend
                legendText = "<*block,valign=top,maxWidth=" + (plotArea.getWidth() - 5) +
                    "*><*font=Arial Bold*>[" + c.xAxis().getFormattedLabel(xValue, "mmm dd, yyyy") +
                    "]<*/font*>      " + ohlcLegend + legendText;

                // Draw a vertical track line at the x-position
                d.vline(plotAreaTopY, plotAreaTopY + plotArea.getHeight(), c.getXCoor(xValue) +
                    c.getAbsOffsetX(), d.dashLineColor(0x000000, 0x0101));

                // Display the legend on the top of the plot area
                TTFText t = d.text(legendText, "Arial", 8);
                t.draw(plotAreaLeftX + 5, plotAreaTopY + 3, 0x000000, Chart.TopLeft);
            }
        }
    }
}
© 2023 Advanced Software Engineering Limited. All rights reserved.