[Windows Forms - C# version] NetWinCharts\CSharpWinCharts\trendline.cs
using System;
using ChartDirector;
namespace CSharpChartExplorer
{
public class trendline : DemoModule
{
//Name of demo module
public string getName() { return "Trend Line Chart"; }
//Number of charts produced in this demo module
public int getNoOfCharts() { return 1; }
//Main code for creating chart.
//Note: the argument chartIndex is unused because this demo only has 1 chart.
public void createChart(WinChartViewer viewer, int chartIndex)
{
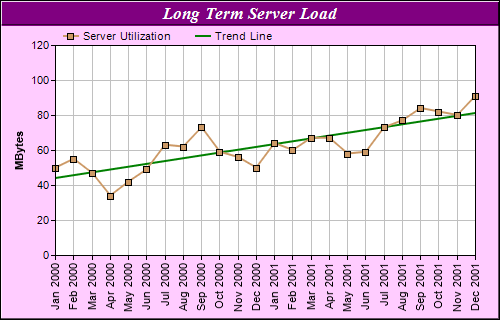
// The data for the line chart
double[] data = {50, 55, 47, 34, 42, 49, 63, 62, 73, 59, 56, 50, 64, 60, 67, 67, 58, 59,
73, 77, 84, 82, 80, 91};
// The labels for the line chart
string[] labels = {"Jan 2000", "Feb 2000", "Mar 2000", "Apr 2000", "May 2000",
"Jun 2000", "Jul 2000", "Aug 2000", "Sep 2000", "Oct 2000", "Nov 2000", "Dec 2000",
"Jan 2001", "Feb 2001", "Mar 2001", "Apr 2001", "May 2001", "Jun 2001", "Jul 2001",
"Aug 2001", "Sep 2001", "Oct 2001", "Nov 2001", "Dec 2001"};
// Create a XYChart object of size 500 x 320 pixels, with a pale purpule (0xffccff)
// background, a black border, and 1 pixel 3D border effect.
XYChart c = new XYChart(500, 320, 0xffccff, 0x000000, 1);
// Set the plotarea at (55, 45) and of size 420 x 210 pixels, with white background.
// Turn on both horizontal and vertical grid lines with light grey color (0xc0c0c0)
c.setPlotArea(55, 45, 420, 210, 0xffffff, -1, -1, 0xc0c0c0, -1);
// Add a legend box at (55, 25) (top of the chart) with horizontal layout. Use 8pt Arial
// font. Set the background and border color to Transparent.
c.addLegend(55, 22, false, "", 8).setBackground(Chart.Transparent);
// Add a title box to the chart using 13pt Times Bold Italic font. The text is white
// (0xffffff) on a purple (0x800080) background, with a 1 pixel 3D border.
c.addTitle("Long Term Server Load", "Times New Roman Bold Italic", 13, 0xffffff
).setBackground(0x800080, -1, 1);
// Add a title to the y axis
c.yAxis().setTitle("MBytes");
// Set the labels on the x axis. Rotate the font by 90 degrees.
c.xAxis().setLabels(labels).setFontAngle(90);
// Add a line layer to the chart
LineLayer lineLayer = c.addLineLayer();
// Add the data to the line layer using light brown color (0xcc9966) with a 7 pixel
// square symbol
lineLayer.addDataSet(data, 0xcc9966, "Server Utilization").setDataSymbol(
Chart.SquareSymbol, 7);
// Set the line width to 2 pixels
lineLayer.setLineWidth(2);
// tool tip for the line layer
lineLayer.setHTMLImageMap("", "", "title='{xLabel}: {value} MBytes'");
// Add a trend line layer using the same data with a dark green (0x008000) color. Set
// the line width to 2 pixels
TrendLayer trendLayer = c.addTrendLayer(data, 0x008000, "Trend Line");
trendLayer.setLineWidth(2);
// tool tip for the trend layer
trendLayer.setHTMLImageMap("", "", "title='Change rate: {slope|2} MBytes/per month'");
// Output the chart
viewer.Chart = c;
// include tool tip for the chart
viewer.ImageMap = c.getHTMLImageMap("clickable");
}
}
}
[Windows Forms - VB Version] NetWinCharts\VBNetWinCharts\trendline.vb
Imports System
Imports Microsoft.VisualBasic
Imports ChartDirector

Public Class trendline
    Implements DemoModule

    'Name of demo module
    Public Function getName() As String Implements DemoModule.getName
        Return "Trend Line Chart"
    End Function

    'Number of charts produced in this demo module
    Public Function getNoOfCharts() As Integer Implements DemoModule.getNoOfCharts
        Return 1
    End Function

    'Main code for creating chart.
    'Note: the argument chartIndex is unused because this demo only has 1 chart.
    Public Sub createChart(viewer As WinChartViewer, chartIndex As Integer) _
        Implements DemoModule.createChart

        ' The data for the line chart
        Dim data() As Double = {50, 55, 47, 34, 42, 49, 63, 62, 73, 59, 56, 50, 64, 60, 67, 67, _
            58, 59, 73, 77, 84, 82, 80, 91}

        ' The labels for the line chart
        Dim labels() As String = {"Jan 2000", "Feb 2000", "Mar 2000", "Apr 2000", "May 2000", _
            "Jun 2000", "Jul 2000", "Aug 2000", "Sep 2000", "Oct 2000", "Nov 2000", "Dec 2000", _
            "Jan 2001", "Feb 2001", "Mar 2001", "Apr 2001", "May 2001", "Jun 2001", "Jul 2001", _
            "Aug 2001", "Sep 2001", "Oct 2001", "Nov 2001", "Dec 2001"}

        ' Create a XYChart object of size 500 x 320 pixels, with a pale purpule (0xffccff)
        ' background, a black border, and 1 pixel 3D border effect.
        Dim c As XYChart = New XYChart(500, 320, &Hffccff, &H000000, 1)

        ' Set the plotarea at (55, 45) and of size 420 x 210 pixels, with white background. Turn on
        ' both horizontal and vertical grid lines with light grey color (0xc0c0c0)
        c.setPlotArea(55, 45, 420, 210, &Hffffff, -1, -1, &Hc0c0c0, -1)

        ' Add a legend box at (55, 25) (top of the chart) with horizontal layout. Use 8pt Arial
        ' font. Set the background and border color to Transparent.
        c.addLegend(55, 22, False, "", 8).setBackground(Chart.Transparent)

        ' Add a title box to the chart using 13pt Times Bold Italic font. The text is white
        ' (0xffffff) on a purple (0x800080) background, with a 1 pixel 3D border.
        c.addTitle("Long Term Server Load", "Times New Roman Bold Italic", 13, &Hffffff _
            ).setBackground(&H800080, -1, 1)

        ' Add a title to the y axis
        c.yAxis().setTitle("MBytes")

        ' Set the labels on the x axis. Rotate the font by 90 degrees.
        c.xAxis().setLabels(labels).setFontAngle(90)

        ' Add a line layer to the chart
        Dim lineLayer As LineLayer = c.addLineLayer()

        ' Add the data to the line layer using light brown color (0xcc9966) with a 7 pixel square
        ' symbol
        lineLayer.addDataSet(data, &Hcc9966, "Server Utilization").setDataSymbol( _
            Chart.SquareSymbol, 7)

        ' Set the line width to 2 pixels
        lineLayer.setLineWidth(2)

        ' tool tip for the line layer
        lineLayer.setHTMLImageMap("", "", "title='{xLabel}: {value} MBytes'")

        ' Add a trend line layer using the same data with a dark green (0x008000) color. Set the
        ' line width to 2 pixels
        Dim trendLayer As TrendLayer = c.addTrendLayer(data, &H008000, "Trend Line")
        trendLayer.setLineWidth(2)

        ' tool tip for the trend layer
        trendLayer.setHTMLImageMap("", "", "title='Change rate: {slope|2} MBytes/per month'")

        ' Output the chart
        viewer.Chart = c

        ' include tool tip for the chart
        viewer.ImageMap = c.getHTMLImageMap("clickable")

    End Sub

End Class
[WPF - C#] NetWPFCharts\CSharpWPFCharts\trendline.cs
using System;
using ChartDirector;

namespace CSharpWPFCharts
{
    public class trendline : DemoModule
    {
        //Name of demo module
        public string getName() { return "Trend Line Chart"; }

        //Number of charts produced in this demo module
        public int getNoOfCharts() { return 1; }

        //Main code for creating chart.
        //Note: the argument chartIndex is unused because this demo only has 1 chart.
        public void createChart(WPFChartViewer viewer, int chartIndex)
        {
            // The data for the line chart
            double[] data = {50, 55, 47, 34, 42, 49, 63, 62, 73, 59, 56, 50, 64, 60, 67, 67, 58, 59,
                73, 77, 84, 82, 80, 91};

            // The labels for the line chart
            string[] labels = {"Jan 2000", "Feb 2000", "Mar 2000", "Apr 2000", "May 2000",
                "Jun 2000", "Jul 2000", "Aug 2000", "Sep 2000", "Oct 2000", "Nov 2000", "Dec 2000",
                "Jan 2001", "Feb 2001", "Mar 2001", "Apr 2001", "May 2001", "Jun 2001", "Jul 2001",
                "Aug 2001", "Sep 2001", "Oct 2001", "Nov 2001", "Dec 2001"};

            // Create a XYChart object of size 500 x 320 pixels, with a pale purpule (0xffccff)
            // background, a black border, and 1 pixel 3D border effect.
            XYChart c = new XYChart(500, 320, 0xffccff, 0x000000, 1);

            // Set the plotarea at (55, 45) and of size 420 x 210 pixels, with white background.
            // Turn on both horizontal and vertical grid lines with light grey color (0xc0c0c0)
            c.setPlotArea(55, 45, 420, 210, 0xffffff, -1, -1, 0xc0c0c0, -1);

            // Add a legend box at (55, 25) (top of the chart) with horizontal layout. Use 8pt Arial
            // font. Set the background and border color to Transparent.
            c.addLegend(55, 22, false, "", 8).setBackground(Chart.Transparent);

            // Add a title box to the chart using 13pt Times Bold Italic font. The text is white
            // (0xffffff) on a purple (0x800080) background, with a 1 pixel 3D border.
            c.addTitle("Long Term Server Load", "Times New Roman Bold Italic", 13, 0xffffff
                ).setBackground(0x800080, -1, 1);

            // Add a title to the y axis
            c.yAxis().setTitle("MBytes");

            // Set the labels on the x axis. Rotate the font by 90 degrees.
            c.xAxis().setLabels(labels).setFontAngle(90);

            // Add a line layer to the chart
            LineLayer lineLayer = c.addLineLayer();

            // Add the data to the line layer using light brown color (0xcc9966) with a 7 pixel
            // square symbol
            lineLayer.addDataSet(data, 0xcc9966, "Server Utilization").setDataSymbol(
                Chart.SquareSymbol, 7);

            // Set the line width to 2 pixels
            lineLayer.setLineWidth(2);

            // tool tip for the line layer
            lineLayer.setHTMLImageMap("", "", "title='{xLabel}: {value} MBytes'");

            // Add a trend line layer using the same data with a dark green (0x008000) color. Set
            // the line width to 2 pixels
            TrendLayer trendLayer = c.addTrendLayer(data, 0x008000, "Trend Line");
            trendLayer.setLineWidth(2);

            // tool tip for the trend layer
            trendLayer.setHTMLImageMap("", "", "title='Change rate: {slope|2} MBytes/per month'");

            // Output the chart
            viewer.Chart = c;

            // include tool tip for the chart
            viewer.ImageMap = c.getHTMLImageMap("clickable");
        }
    }
}
[ASP.NET Web Forms - C# version] NetWebCharts\CSharpASP\trendline.aspx
(Click here on how to convert this code to code-behind style.)<%@ Page Language="C#" Debug="true" %>
<%@ Import Namespace="ChartDirector" %>
<%@ Register TagPrefix="chart" Namespace="ChartDirector" Assembly="netchartdir" %>
<!DOCTYPE html>
<script runat="server">
//
// Page Load event handler
//
protected void Page_Load(object sender, EventArgs e)
{
// The data for the line chart
double[] data = {50, 55, 47, 34, 42, 49, 63, 62, 73, 59, 56, 50, 64, 60, 67, 67, 58, 59, 73, 77,
84, 82, 80, 91};
// The labels for the line chart
string[] labels = {"Jan 2000", "Feb 2000", "Mar 2000", "Apr 2000", "May 2000", "Jun 2000",
"Jul 2000", "Aug 2000", "Sep 2000", "Oct 2000", "Nov 2000", "Dec 2000", "Jan 2001",
"Feb 2001", "Mar 2001", "Apr 2001", "May 2001", "Jun 2001", "Jul 2001", "Aug 2001",
"Sep 2001", "Oct 2001", "Nov 2001", "Dec 2001"};
// Create a XYChart object of size 500 x 320 pixels, with a pale purpule (0xffccff) background,
// a black border, and 1 pixel 3D border effect.
XYChart c = new XYChart(500, 320, 0xffccff, 0x000000, 1);
// Set the plotarea at (55, 45) and of size 420 x 210 pixels, with white background. Turn on
// both horizontal and vertical grid lines with light grey color (0xc0c0c0)
c.setPlotArea(55, 45, 420, 210, 0xffffff, -1, -1, 0xc0c0c0, -1);
// Add a legend box at (55, 25) (top of the chart) with horizontal layout. Use 8pt Arial font.
// Set the background and border color to Transparent.
c.addLegend(55, 22, false, "", 8).setBackground(Chart.Transparent);
// Add a title box to the chart using 13pt Times Bold Italic font. The text is white (0xffffff)
// on a purple (0x800080) background, with a 1 pixel 3D border.
c.addTitle("Long Term Server Load", "Times New Roman Bold Italic", 13, 0xffffff).setBackground(
0x800080, -1, 1);
// Add a title to the y axis
c.yAxis().setTitle("MBytes");
// Set the labels on the x axis. Rotate the font by 90 degrees.
c.xAxis().setLabels(labels).setFontAngle(90);
// Add a line layer to the chart
LineLayer lineLayer = c.addLineLayer();
// Add the data to the line layer using light brown color (0xcc9966) with a 7 pixel square
// symbol
lineLayer.addDataSet(data, 0xcc9966, "Server Utilization").setDataSymbol(Chart.SquareSymbol, 7);
// Set the line width to 2 pixels
lineLayer.setLineWidth(2);
// tool tip for the line layer
lineLayer.setHTMLImageMap("", "", "title='{xLabel}: {value} MBytes'");
// Add a trend line layer using the same data with a dark green (0x008000) color. Set the line
// width to 2 pixels
TrendLayer trendLayer = c.addTrendLayer(data, 0x008000, "Trend Line");
trendLayer.setLineWidth(2);
// tool tip for the trend layer
trendLayer.setHTMLImageMap("", "", "title='Change rate: {slope|2} MBytes/per month'");
// Output the chart
WebChartViewer1.Image = c.makeWebImage(Chart.SVG);
// include tool tip for the chart
WebChartViewer1.ImageMap = c.getHTMLImageMap("");
}
</script>
<html>
<head>
<script type="text/javascript" src="cdjcv.js"></script>
</head>
<body>
<chart:WebChartViewer id="WebChartViewer1" runat="server" />
</body>
</html>
[ASP.NET Web Forms - VB Version] NetWebCharts\VBNetASP\trendline.aspx
(Click here on how to convert this code to code-behind style.)<%@ Page Language="VB" Debug="true" %>
<%@ Import Namespace="ChartDirector" %>
<%@ Register TagPrefix="chart" Namespace="ChartDirector" Assembly="netchartdir" %>
<!DOCTYPE html>
<script runat="server">
'
' Page Load event handler
'
Protected Sub Page_Load(ByVal sender As System.Object, ByVal e As System.EventArgs)
' The data for the line chart
Dim data() As Double = {50, 55, 47, 34, 42, 49, 63, 62, 73, 59, 56, 50, 64, 60, 67, 67, 58, _
59, 73, 77, 84, 82, 80, 91}
' The labels for the line chart
Dim labels() As String = {"Jan 2000", "Feb 2000", "Mar 2000", "Apr 2000", "May 2000", _
"Jun 2000", "Jul 2000", "Aug 2000", "Sep 2000", "Oct 2000", "Nov 2000", "Dec 2000", _
"Jan 2001", "Feb 2001", "Mar 2001", "Apr 2001", "May 2001", "Jun 2001", "Jul 2001", _
"Aug 2001", "Sep 2001", "Oct 2001", "Nov 2001", "Dec 2001"}
' Create a XYChart object of size 500 x 320 pixels, with a pale purpule (0xffccff) background, a
' black border, and 1 pixel 3D border effect.
Dim c As XYChart = New XYChart(500, 320, &Hffccff, &H000000, 1)
' Set the plotarea at (55, 45) and of size 420 x 210 pixels, with white background. Turn on both
' horizontal and vertical grid lines with light grey color (0xc0c0c0)
c.setPlotArea(55, 45, 420, 210, &Hffffff, -1, -1, &Hc0c0c0, -1)
' Add a legend box at (55, 25) (top of the chart) with horizontal layout. Use 8pt Arial font.
' Set the background and border color to Transparent.
c.addLegend(55, 22, False, "", 8).setBackground(Chart.Transparent)
' Add a title box to the chart using 13pt Times Bold Italic font. The text is white (0xffffff)
' on a purple (0x800080) background, with a 1 pixel 3D border.
c.addTitle("Long Term Server Load", "Times New Roman Bold Italic", 13, &Hffffff _
).setBackground(&H800080, -1, 1)
' Add a title to the y axis
c.yAxis().setTitle("MBytes")
' Set the labels on the x axis. Rotate the font by 90 degrees.
c.xAxis().setLabels(labels).setFontAngle(90)
' Add a line layer to the chart
Dim lineLayer As LineLayer = c.addLineLayer()
' Add the data to the line layer using light brown color (0xcc9966) with a 7 pixel square symbol
lineLayer.addDataSet(data, &Hcc9966, "Server Utilization").setDataSymbol(Chart.SquareSymbol, 7)
' Set the line width to 2 pixels
lineLayer.setLineWidth(2)
' tool tip for the line layer
lineLayer.setHTMLImageMap("", "", "title='{xLabel}: {value} MBytes'")
' Add a trend line layer using the same data with a dark green (0x008000) color. Set the line
' width to 2 pixels
Dim trendLayer As TrendLayer = c.addTrendLayer(data, &H008000, "Trend Line")
trendLayer.setLineWidth(2)
' tool tip for the trend layer
trendLayer.setHTMLImageMap("", "", "title='Change rate: {slope|2} MBytes/per month'")
' Output the chart
WebChartViewer1.Image = c.makeWebImage(Chart.SVG)
' include tool tip for the chart
WebChartViewer1.ImageMap = c.getHTMLImageMap("")
End Sub
</script>
<html>
<head>
<script type="text/javascript" src="cdjcv.js"></script>
</head>
<body>
<chart:WebChartViewer id="WebChartViewer1" runat="server" />
</body>
</html>
[ASP.NET MVC - Controller] NetMvcCharts\Controllers\TrendlineController.cs
using System;
using System.Web.Mvc;
using ChartDirector;

namespace NetMvcCharts.Controllers
{
    public class TrendlineController : Controller
    {
        //
        // Default Action
        //
        public ActionResult Index()
        {
            ViewBag.Title = "Trend Line Chart";
            createChart(ViewBag.Viewer = new RazorChartViewer(HttpContext, "chart1"));
            return View("~/Views/Shared/ChartView.cshtml");
        }

        //
        // Create chart
        //
        private void createChart(RazorChartViewer viewer)
        {
            // The data for the line chart
            double[] data = {50, 55, 47, 34, 42, 49, 63, 62, 73, 59, 56, 50, 64, 60, 67, 67, 58, 59, 73,
                77, 84, 82, 80, 91};

            // The labels for the line chart
            string[] labels = {"Jan 2000", "Feb 2000", "Mar 2000", "Apr 2000", "May 2000", "Jun 2000",
                "Jul 2000", "Aug 2000", "Sep 2000", "Oct 2000", "Nov 2000", "Dec 2000", "Jan 2001",
                "Feb 2001", "Mar 2001", "Apr 2001", "May 2001", "Jun 2001", "Jul 2001", "Aug 2001",
                "Sep 2001", "Oct 2001", "Nov 2001", "Dec 2001"};

            // Create a XYChart object of size 500 x 320 pixels, with a pale purpule (0xffccff)
            // background, a black border, and 1 pixel 3D border effect.
            XYChart c = new XYChart(500, 320, 0xffccff, 0x000000, 1);

            // Set the plotarea at (55, 45) and of size 420 x 210 pixels, with white background. Turn on
            // both horizontal and vertical grid lines with light grey color (0xc0c0c0)
            c.setPlotArea(55, 45, 420, 210, 0xffffff, -1, -1, 0xc0c0c0, -1);

            // Add a legend box at (55, 25) (top of the chart) with horizontal layout. Use 8pt Arial
            // font. Set the background and border color to Transparent.
            c.addLegend(55, 22, false, "", 8).setBackground(Chart.Transparent);

            // Add a title box to the chart using 13pt Times Bold Italic font. The text is white
            // (0xffffff) on a purple (0x800080) background, with a 1 pixel 3D border.
            c.addTitle("Long Term Server Load", "Times New Roman Bold Italic", 13, 0xffffff
                ).setBackground(0x800080, -1, 1);

            // Add a title to the y axis
            c.yAxis().setTitle("MBytes");

            // Set the labels on the x axis. Rotate the font by 90 degrees.
            c.xAxis().setLabels(labels).setFontAngle(90);

            // Add a line layer to the chart
            LineLayer lineLayer = c.addLineLayer();

            // Add the data to the line layer using light brown color (0xcc9966) with a 7 pixel square
            // symbol
            lineLayer.addDataSet(data, 0xcc9966, "Server Utilization").setDataSymbol(Chart.SquareSymbol,
                7);

            // Set the line width to 2 pixels
            lineLayer.setLineWidth(2);

            // tool tip for the line layer
            lineLayer.setHTMLImageMap("", "", "title='{xLabel}: {value} MBytes'");

            // Add a trend line layer using the same data with a dark green (0x008000) color. Set the
            // line width to 2 pixels
            TrendLayer trendLayer = c.addTrendLayer(data, 0x008000, "Trend Line");
            trendLayer.setLineWidth(2);

            // tool tip for the trend layer
            trendLayer.setHTMLImageMap("", "", "title='Change rate: {slope|2} MBytes/per month'");

            // Output the chart
            viewer.Image = c.makeWebImage(Chart.SVG);

            // include tool tip for the chart
            viewer.ImageMap = c.getHTMLImageMap("");
        }
    }
}
[ASP.NET MVC - View] NetMvcCharts\Views\Shared\ChartView.cshtml
@{ Layout = null; }

<!DOCTYPE html>

<html>
<head>
    <meta name="viewport" content="width=device-width" />
    <title>@ViewBag.Title</title>
    <style>
        @ViewBag.Style
    </style>
    @Scripts.Render("~/Scripts/cdjcv.js")
</head>
<body style="margin:5px 0px 0px 5px">
    <div style="font:bold 18pt verdana;">
        @ViewBag.Title
    </div>
    <hr style="border:solid 1px #000080; background:#000080" />
    <div>
        @{
            if (ViewBag.Viewer is Array)
            {
                // Display multiple charts
                for (int i = 0; i < ViewBag.Viewer.Length; ++i)
                {
                    @:@Html.Raw(ViewBag.Viewer[i].RenderHTML())
                }
            }
            else
            {
                // Display one chart only
                @:@Html.Raw(ViewBag.Viewer.RenderHTML())
            }
        }
    </div>
</body>
</html>
© 2023 Advanced Software Engineering Limited. All rights reserved.