[Windows Forms - C# version] NetWinCharts\CSharpWinCharts\unevenpoints.cs
using System;
using ChartDirector;
namespace CSharpChartExplorer
{
public class unevenpoints : DemoModule
{
//Name of demo module
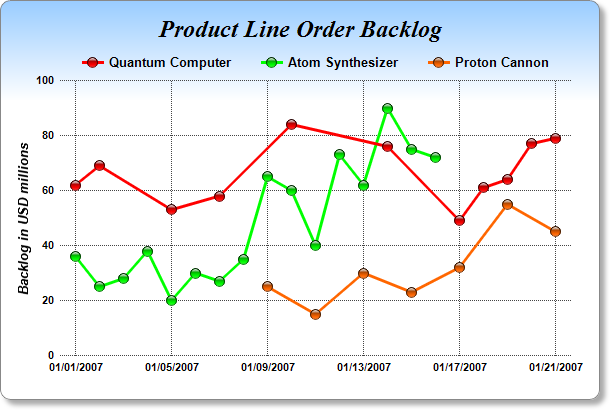
public string getName() { return "Uneven Data Points "; }
//Number of charts produced in this demo module
public int getNoOfCharts() { return 1; }
//Main code for creating chart.
//Note: the argument chartIndex is unused because this demo only has 1 chart.
public void createChart(WinChartViewer viewer, int chartIndex)
{
// Data points which more unevenly spaced in time
double[] data0Y = {62, 69, 53, 58, 84, 76, 49, 61, 64, 77, 79};
DateTime[] data0X = {new DateTime(2007, 1, 1), new DateTime(2007, 1, 2), new DateTime(
2007, 1, 5), new DateTime(2007, 1, 7), new DateTime(2007, 1, 10), new DateTime(2007,
1, 14), new DateTime(2007, 1, 17), new DateTime(2007, 1, 18), new DateTime(2007, 1,
19), new DateTime(2007, 1, 20), new DateTime(2007, 1, 21)};
// Data points which are evenly spaced in a certain time range
double[] data1Y = {36, 25, 28, 38, 20, 30, 27, 35, 65, 60, 40, 73, 62, 90, 75, 72};
DateTime data1Start = new DateTime(2007, 1, 1);
DateTime data1End = new DateTime(2007, 1, 16);
// Data points which are evenly spaced in another time range, in which the spacing is
// different from the above series
double[] data2Y = {25, 15, 30, 23, 32, 55, 45};
DateTime data2Start = new DateTime(2007, 1, 9);
DateTime data2End = new DateTime(2007, 1, 21);
// Create a XYChart object of size 600 x 400 pixels. Use a vertical gradient color from
// light blue (99ccff) to white (ffffff) spanning the top 100 pixels as background. Set
// border to grey (888888). Use rounded corners. Enable soft drop shadow.
XYChart c = new XYChart(600, 400);
c.setBackground(c.linearGradientColor(0, 0, 0, 100, 0x99ccff, 0xffffff), 0x888888);
c.setRoundedFrame();
c.setDropShadow();
// Add a title using 18pt Times New Roman Bold Italic font. Set top margin to 16 pixels.
c.addTitle("Product Line Order Backlog", "Times New Roman Bold Italic", 18).setMargin2(
0, 0, 16, 0);
// Set the plotarea at (60, 80) and of 510 x 275 pixels in size. Use transparent border
// and dark grey (444444) dotted grid lines
PlotArea plotArea = c.setPlotArea(60, 80, 510, 275, -1, -1, Chart.Transparent,
c.dashLineColor(0x444444, 0x0101), -1);
// Add a legend box where the top-center is anchored to the horizontal center of the
// plot area at y = 45. Use horizontal layout and 10 points Arial Bold font, and
// transparent background and border.
LegendBox legendBox = c.addLegend(plotArea.getLeftX() + plotArea.getWidth() / 2, 45,
false, "Arial Bold", 10);
legendBox.setAlignment(Chart.TopCenter);
legendBox.setBackground(Chart.Transparent, Chart.Transparent);
// Set x-axis tick density to 75 pixels and y-axis tick density to 30 pixels.
// ChartDirector auto-scaling will use this as the guidelines when putting ticks on the
// x-axis and y-axis.
c.yAxis().setTickDensity(30);
c.xAxis().setTickDensity(75);
// Set all axes to transparent
c.xAxis().setColors(Chart.Transparent);
c.yAxis().setColors(Chart.Transparent);
// Set the x-axis margins to 15 pixels, so that the horizontal grid lines can extend
// beyond the leftmost and rightmost vertical grid lines
c.xAxis().setMargin(15, 15);
// Set axis label style to 8pt Arial Bold
c.xAxis().setLabelStyle("Arial Bold", 8);
c.yAxis().setLabelStyle("Arial Bold", 8);
c.yAxis2().setLabelStyle("Arial Bold", 8);
// Add axis title using 10pt Arial Bold Italic font
c.yAxis().setTitle("Backlog in USD millions", "Arial Bold Italic", 10);
// Add the first data series
LineLayer layer0 = c.addLineLayer2();
layer0.addDataSet(data0Y, 0xff0000, "Quantum Computer").setDataSymbol(
Chart.GlassSphere2Shape, 11);
layer0.setXData(data0X);
layer0.setLineWidth(3);
// Add the second data series
LineLayer layer1 = c.addLineLayer2();
layer1.addDataSet(data1Y, 0x00ff00, "Atom Synthesizer").setDataSymbol(
Chart.GlassSphere2Shape, 11);
layer1.setXData2(data1Start, data1End);
layer1.setLineWidth(3);
// Add the third data series
LineLayer layer2 = c.addLineLayer2();
layer2.addDataSet(data2Y, 0xff6600, "Proton Cannon").setDataSymbol(
Chart.GlassSphere2Shape, 11);
layer2.setXData2(data2Start, data2End);
layer2.setLineWidth(3);
// Output the chart
viewer.Chart = c;
//include tool tip for the chart
viewer.ImageMap = c.getHTMLImageMap("clickable", "",
"title='Backlog of {dataSetName} at {x|mm/dd/yyyy}: US$ {value}M'");
}
}
}
[Windows Forms - VB Version] NetWinCharts\VBNetWinCharts\unevenpoints.vb
Imports System
Imports Microsoft.VisualBasic
Imports ChartDirector

Public Class unevenpoints
    Implements DemoModule

    'Name of demo module
    Public Function getName() As String Implements DemoModule.getName
        Return "Uneven Data Points "
    End Function

    'Number of charts produced in this demo module
    Public Function getNoOfCharts() As Integer Implements DemoModule.getNoOfCharts
        Return 1
    End Function

    'Main code for creating chart.
    'Note: the argument chartIndex is unused because this demo only has 1 chart.
    Public Sub createChart(viewer As WinChartViewer, chartIndex As Integer) _
        Implements DemoModule.createChart

        ' Data points which more unevenly spaced in time
        Dim data0Y() As Double = {62, 69, 53, 58, 84, 76, 49, 61, 64, 77, 79}
        Dim data0X() As Date = {DateSerial(2007, 1, 1), DateSerial(2007, 1, 2), DateSerial(2007, _
            1, 5), DateSerial(2007, 1, 7), DateSerial(2007, 1, 10), DateSerial(2007, 1, 14), _
            DateSerial(2007, 1, 17), DateSerial(2007, 1, 18), DateSerial(2007, 1, 19), DateSerial( _
            2007, 1, 20), DateSerial(2007, 1, 21)}

        ' Data points which are evenly spaced in a certain time range
        Dim data1Y() As Double = {36, 25, 28, 38, 20, 30, 27, 35, 65, 60, 40, 73, 62, 90, 75, 72}
        Dim data1Start As Date = DateSerial(2007, 1, 1)
        Dim data1End As Date = DateSerial(2007, 1, 16)

        ' Data points which are evenly spaced in another time range, in which the spacing is
        ' different from the above series
        Dim data2Y() As Double = {25, 15, 30, 23, 32, 55, 45}
        Dim data2Start As Date = DateSerial(2007, 1, 9)
        Dim data2End As Date = DateSerial(2007, 1, 21)

        ' Create a XYChart object of size 600 x 400 pixels. Use a vertical gradient color from light
        ' blue (99ccff) to white (ffffff) spanning the top 100 pixels as background. Set border to
        ' grey (888888). Use rounded corners. Enable soft drop shadow.
        Dim c As XYChart = New XYChart(600, 400)
        c.setBackground(c.linearGradientColor(0, 0, 0, 100, &H99ccff, &Hffffff), &H888888)
        c.setRoundedFrame()
        c.setDropShadow()

        ' Add a title using 18pt Times New Roman Bold Italic font. Set top margin to 16 pixels.
        c.addTitle("Product Line Order Backlog", "Times New Roman Bold Italic", 18).setMargin2(0, _
            0, 16, 0)

        ' Set the plotarea at (60, 80) and of 510 x 275 pixels in size. Use transparent border and
        ' dark grey (444444) dotted grid lines
        Dim plotArea As PlotArea = c.setPlotArea(60, 80, 510, 275, -1, -1, Chart.Transparent, _
            c.dashLineColor(&H444444, &H0101), -1)

        ' Add a legend box where the top-center is anchored to the horizontal center of the plot
        ' area at y = 45. Use horizontal layout and 10 points Arial Bold font, and transparent
        ' background and border.
        Dim legendBox As LegendBox = c.addLegend(plotArea.getLeftX() + plotArea.getWidth() / 2, _
            45, False, "Arial Bold", 10)
        legendBox.setAlignment(Chart.TopCenter)
        legendBox.setBackground(Chart.Transparent, Chart.Transparent)

        ' Set x-axis tick density to 75 pixels and y-axis tick density to 30 pixels. ChartDirector
        ' auto-scaling will use this as the guidelines when putting ticks on the x-axis and y-axis.
        c.yAxis().setTickDensity(30)
        c.xAxis().setTickDensity(75)

        ' Set all axes to transparent
        c.xAxis().setColors(Chart.Transparent)
        c.yAxis().setColors(Chart.Transparent)

        ' Set the x-axis margins to 15 pixels, so that the horizontal grid lines can extend beyond
        ' the leftmost and rightmost vertical grid lines
        c.xAxis().setMargin(15, 15)

        ' Set axis label style to 8pt Arial Bold
        c.xAxis().setLabelStyle("Arial Bold", 8)
        c.yAxis().setLabelStyle("Arial Bold", 8)
        c.yAxis2().setLabelStyle("Arial Bold", 8)

        ' Add axis title using 10pt Arial Bold Italic font
        c.yAxis().setTitle("Backlog in USD millions", "Arial Bold Italic", 10)

        ' Add the first data series
        Dim layer0 As LineLayer = c.addLineLayer2()
        layer0.addDataSet(data0Y, &Hff0000, "Quantum Computer").setDataSymbol( _
            Chart.GlassSphere2Shape, 11)
        layer0.setXData(data0X)
        layer0.setLineWidth(3)

        ' Add the second data series
        Dim layer1 As LineLayer = c.addLineLayer2()
        layer1.addDataSet(data1Y, &H00ff00, "Atom Synthesizer").setDataSymbol( _
            Chart.GlassSphere2Shape, 11)
        layer1.setXData2(data1Start, data1End)
        layer1.setLineWidth(3)

        ' Add the third data series
        Dim layer2 As LineLayer = c.addLineLayer2()
        layer2.addDataSet(data2Y, &Hff6600, "Proton Cannon").setDataSymbol( _
            Chart.GlassSphere2Shape, 11)
        layer2.setXData2(data2Start, data2End)
        layer2.setLineWidth(3)

        ' Output the chart
        viewer.Chart = c

        'include tool tip for the chart
        viewer.ImageMap = c.getHTMLImageMap("clickable", "", _
            "title='Backlog of {dataSetName} at {x|mm/dd/yyyy}: US$ {value}M'")

    End Sub

End Class
[WPF - C#] NetWPFCharts\CSharpWPFCharts\unevenpoints.cs
using System;
using ChartDirector;

namespace CSharpWPFCharts
{
    public class unevenpoints : DemoModule
    {
        //Name of demo module
        public string getName() { return "Uneven Data Points "; }

        //Number of charts produced in this demo module
        public int getNoOfCharts() { return 1; }

        //Main code for creating chart.
        //Note: the argument chartIndex is unused because this demo only has 1 chart.
        public void createChart(WPFChartViewer viewer, int chartIndex)
        {
            // Data points which more unevenly spaced in time
            double[] data0Y = {62, 69, 53, 58, 84, 76, 49, 61, 64, 77, 79};
            DateTime[] data0X = {new DateTime(2007, 1, 1), new DateTime(2007, 1, 2), new DateTime(
                2007, 1, 5), new DateTime(2007, 1, 7), new DateTime(2007, 1, 10), new DateTime(2007,
                1, 14), new DateTime(2007, 1, 17), new DateTime(2007, 1, 18), new DateTime(2007, 1,
                19), new DateTime(2007, 1, 20), new DateTime(2007, 1, 21)};

            // Data points which are evenly spaced in a certain time range
            double[] data1Y = {36, 25, 28, 38, 20, 30, 27, 35, 65, 60, 40, 73, 62, 90, 75, 72};
            DateTime data1Start = new DateTime(2007, 1, 1);
            DateTime data1End = new DateTime(2007, 1, 16);

            // Data points which are evenly spaced in another time range, in which the spacing is
            // different from the above series
            double[] data2Y = {25, 15, 30, 23, 32, 55, 45};
            DateTime data2Start = new DateTime(2007, 1, 9);
            DateTime data2End = new DateTime(2007, 1, 21);

            // Create a XYChart object of size 600 x 400 pixels. Use a vertical gradient color from
            // light blue (99ccff) to white (ffffff) spanning the top 100 pixels as background. Set
            // border to grey (888888). Use rounded corners. Enable soft drop shadow.
            XYChart c = new XYChart(600, 400);
            c.setBackground(c.linearGradientColor(0, 0, 0, 100, 0x99ccff, 0xffffff), 0x888888);
            c.setRoundedFrame();
            c.setDropShadow();

            // Add a title using 18pt Times New Roman Bold Italic font. Set top margin to 16 pixels.
            c.addTitle("Product Line Order Backlog", "Times New Roman Bold Italic", 18).setMargin2(
                0, 0, 16, 0);

            // Set the plotarea at (60, 80) and of 510 x 275 pixels in size. Use transparent border
            // and dark grey (444444) dotted grid lines
            PlotArea plotArea = c.setPlotArea(60, 80, 510, 275, -1, -1, Chart.Transparent,
                c.dashLineColor(0x444444, 0x0101), -1);

            // Add a legend box where the top-center is anchored to the horizontal center of the
            // plot area at y = 45. Use horizontal layout and 10 points Arial Bold font, and
            // transparent background and border.
            LegendBox legendBox = c.addLegend(plotArea.getLeftX() + plotArea.getWidth() / 2, 45,
                false, "Arial Bold", 10);
            legendBox.setAlignment(Chart.TopCenter);
            legendBox.setBackground(Chart.Transparent, Chart.Transparent);

            // Set x-axis tick density to 75 pixels and y-axis tick density to 30 pixels.
            // ChartDirector auto-scaling will use this as the guidelines when putting ticks on the
            // x-axis and y-axis.
            c.yAxis().setTickDensity(30);
            c.xAxis().setTickDensity(75);

            // Set all axes to transparent
            c.xAxis().setColors(Chart.Transparent);
            c.yAxis().setColors(Chart.Transparent);

            // Set the x-axis margins to 15 pixels, so that the horizontal grid lines can extend
            // beyond the leftmost and rightmost vertical grid lines
            c.xAxis().setMargin(15, 15);

            // Set axis label style to 8pt Arial Bold
            c.xAxis().setLabelStyle("Arial Bold", 8);
            c.yAxis().setLabelStyle("Arial Bold", 8);
            c.yAxis2().setLabelStyle("Arial Bold", 8);

            // Add axis title using 10pt Arial Bold Italic font
            c.yAxis().setTitle("Backlog in USD millions", "Arial Bold Italic", 10);

            // Add the first data series
            LineLayer layer0 = c.addLineLayer2();
            layer0.addDataSet(data0Y, 0xff0000, "Quantum Computer").setDataSymbol(
                Chart.GlassSphere2Shape, 11);
            layer0.setXData(data0X);
            layer0.setLineWidth(3);

            // Add the second data series
            LineLayer layer1 = c.addLineLayer2();
            layer1.addDataSet(data1Y, 0x00ff00, "Atom Synthesizer").setDataSymbol(
                Chart.GlassSphere2Shape, 11);
            layer1.setXData2(data1Start, data1End);
            layer1.setLineWidth(3);

            // Add the third data series
            LineLayer layer2 = c.addLineLayer2();
            layer2.addDataSet(data2Y, 0xff6600, "Proton Cannon").setDataSymbol(
                Chart.GlassSphere2Shape, 11);
            layer2.setXData2(data2Start, data2End);
            layer2.setLineWidth(3);

            // Output the chart
            viewer.Chart = c;

            //include tool tip for the chart
            viewer.ImageMap = c.getHTMLImageMap("clickable", "",
                "title='Backlog of {dataSetName} at {x|mm/dd/yyyy}: US$ {value}M'");
        }
    }
}
[ASP.NET Web Forms - C# version] NetWebCharts\CSharpASP\unevenpoints.aspx
(Click here on how to convert this code to code-behind style.)<%@ Page Language="C#" Debug="true" %>
<%@ Import Namespace="ChartDirector" %>
<%@ Register TagPrefix="chart" Namespace="ChartDirector" Assembly="netchartdir" %>
<!DOCTYPE html>
<script runat="server">
//
// Page Load event handler
//
protected void Page_Load(object sender, EventArgs e)
{
// Data points which more unevenly spaced in time
double[] data0Y = {62, 69, 53, 58, 84, 76, 49, 61, 64, 77, 79};
DateTime[] data0X = {new DateTime(2007, 1, 1), new DateTime(2007, 1, 2), new DateTime(2007, 1, 5
), new DateTime(2007, 1, 7), new DateTime(2007, 1, 10), new DateTime(2007, 1, 14),
new DateTime(2007, 1, 17), new DateTime(2007, 1, 18), new DateTime(2007, 1, 19),
new DateTime(2007, 1, 20), new DateTime(2007, 1, 21)};
// Data points which are evenly spaced in a certain time range
double[] data1Y = {36, 25, 28, 38, 20, 30, 27, 35, 65, 60, 40, 73, 62, 90, 75, 72};
DateTime data1Start = new DateTime(2007, 1, 1);
DateTime data1End = new DateTime(2007, 1, 16);
// Data points which are evenly spaced in another time range, in which the spacing is different
// from the above series
double[] data2Y = {25, 15, 30, 23, 32, 55, 45};
DateTime data2Start = new DateTime(2007, 1, 9);
DateTime data2End = new DateTime(2007, 1, 21);
// Create a XYChart object of size 600 x 400 pixels. Use a vertical gradient color from light
// blue (99ccff) to white (ffffff) spanning the top 100 pixels as background. Set border to grey
// (888888). Use rounded corners. Enable soft drop shadow.
XYChart c = new XYChart(600, 400);
c.setBackground(c.linearGradientColor(0, 0, 0, 100, 0x99ccff, 0xffffff), 0x888888);
c.setRoundedFrame();
c.setDropShadow();
// Add a title using 18pt Times New Roman Bold Italic font. Set top margin to 16 pixels.
c.addTitle("Product Line Order Backlog", "Times New Roman Bold Italic", 18).setMargin2(0, 0, 16,
0);
// Set the plotarea at (60, 80) and of 510 x 275 pixels in size. Use transparent border and dark
// grey (444444) dotted grid lines
PlotArea plotArea = c.setPlotArea(60, 80, 510, 275, -1, -1, Chart.Transparent, c.dashLineColor(
0x444444, 0x0101), -1);
// Add a legend box where the top-center is anchored to the horizontal center of the plot area
// at y = 45. Use horizontal layout and 10 points Arial Bold font, and transparent background
// and border.
LegendBox legendBox = c.addLegend(plotArea.getLeftX() + plotArea.getWidth() / 2, 45, false,
"Arial Bold", 10);
legendBox.setAlignment(Chart.TopCenter);
legendBox.setBackground(Chart.Transparent, Chart.Transparent);
// Set x-axis tick density to 75 pixels and y-axis tick density to 30 pixels. ChartDirector
// auto-scaling will use this as the guidelines when putting ticks on the x-axis and y-axis.
c.yAxis().setTickDensity(30);
c.xAxis().setTickDensity(75);
// Set all axes to transparent
c.xAxis().setColors(Chart.Transparent);
c.yAxis().setColors(Chart.Transparent);
// Set the x-axis margins to 15 pixels, so that the horizontal grid lines can extend beyond the
// leftmost and rightmost vertical grid lines
c.xAxis().setMargin(15, 15);
// Set axis label style to 8pt Arial Bold
c.xAxis().setLabelStyle("Arial Bold", 8);
c.yAxis().setLabelStyle("Arial Bold", 8);
c.yAxis2().setLabelStyle("Arial Bold", 8);
// Add axis title using 10pt Arial Bold Italic font
c.yAxis().setTitle("Backlog in USD millions", "Arial Bold Italic", 10);
// Add the first data series
LineLayer layer0 = c.addLineLayer2();
layer0.addDataSet(data0Y, 0xff0000, "Quantum Computer").setDataSymbol(Chart.GlassSphere2Shape,
11);
layer0.setXData(data0X);
layer0.setLineWidth(3);
// Add the second data series
LineLayer layer1 = c.addLineLayer2();
layer1.addDataSet(data1Y, 0x00ff00, "Atom Synthesizer").setDataSymbol(Chart.GlassSphere2Shape,
11);
layer1.setXData2(data1Start, data1End);
layer1.setLineWidth(3);
// Add the third data series
LineLayer layer2 = c.addLineLayer2();
layer2.addDataSet(data2Y, 0xff6600, "Proton Cannon").setDataSymbol(Chart.GlassSphere2Shape, 11);
layer2.setXData2(data2Start, data2End);
layer2.setLineWidth(3);
// Output the chart
WebChartViewer1.Image = c.makeWebImage(Chart.SVG);
// Include tool tip for the chart
WebChartViewer1.ImageMap = c.getHTMLImageMap("", "",
"title='Backlog of {dataSetName} at {x|mm/dd/yyyy}: US$ {value}M'");
}
</script>
<html>
<head>
<script type="text/javascript" src="cdjcv.js"></script>
</head>
<body>
<chart:WebChartViewer id="WebChartViewer1" runat="server" />
</body>
</html>
[ASP.NET Web Forms - VB Version] NetWebCharts\VBNetASP\unevenpoints.aspx
(Click here on how to convert this code to code-behind style.)<%@ Page Language="VB" Debug="true" %>
<%@ Import Namespace="ChartDirector" %>
<%@ Register TagPrefix="chart" Namespace="ChartDirector" Assembly="netchartdir" %>
<!DOCTYPE html>
<script runat="server">
'
' Page Load event handler
'
Protected Sub Page_Load(ByVal sender As System.Object, ByVal e As System.EventArgs)
' Data points which more unevenly spaced in time
Dim data0Y() As Double = {62, 69, 53, 58, 84, 76, 49, 61, 64, 77, 79}
Dim data0X() As Date = {DateSerial(2007, 1, 1), DateSerial(2007, 1, 2), DateSerial(2007, 1, 5 _
), DateSerial(2007, 1, 7), DateSerial(2007, 1, 10), DateSerial(2007, 1, 14), DateSerial( _
2007, 1, 17), DateSerial(2007, 1, 18), DateSerial(2007, 1, 19), DateSerial(2007, 1, 20), _
DateSerial(2007, 1, 21)}
' Data points which are evenly spaced in a certain time range
Dim data1Y() As Double = {36, 25, 28, 38, 20, 30, 27, 35, 65, 60, 40, 73, 62, 90, 75, 72}
Dim data1Start As Date = DateSerial(2007, 1, 1)
Dim data1End As Date = DateSerial(2007, 1, 16)
' Data points which are evenly spaced in another time range, in which the spacing is different
' from the above series
Dim data2Y() As Double = {25, 15, 30, 23, 32, 55, 45}
Dim data2Start As Date = DateSerial(2007, 1, 9)
Dim data2End As Date = DateSerial(2007, 1, 21)
' Create a XYChart object of size 600 x 400 pixels. Use a vertical gradient color from light
' blue (99ccff) to white (ffffff) spanning the top 100 pixels as background. Set border to grey
' (888888). Use rounded corners. Enable soft drop shadow.
Dim c As XYChart = New XYChart(600, 400)
c.setBackground(c.linearGradientColor(0, 0, 0, 100, &H99ccff, &Hffffff), &H888888)
c.setRoundedFrame()
c.setDropShadow()
' Add a title using 18pt Times New Roman Bold Italic font. Set top margin to 16 pixels.
c.addTitle("Product Line Order Backlog", "Times New Roman Bold Italic", 18).setMargin2(0, 0, _
16, 0)
' Set the plotarea at (60, 80) and of 510 x 275 pixels in size. Use transparent border and dark
' grey (444444) dotted grid lines
Dim plotArea As PlotArea = c.setPlotArea(60, 80, 510, 275, -1, -1, Chart.Transparent, _
c.dashLineColor(&H444444, &H0101), -1)
' Add a legend box where the top-center is anchored to the horizontal center of the plot area at
' y = 45. Use horizontal layout and 10 points Arial Bold font, and transparent background and
' border.
Dim legendBox As LegendBox = c.addLegend(plotArea.getLeftX() + plotArea.getWidth() / 2, 45, _
False, "Arial Bold", 10)
legendBox.setAlignment(Chart.TopCenter)
legendBox.setBackground(Chart.Transparent, Chart.Transparent)
' Set x-axis tick density to 75 pixels and y-axis tick density to 30 pixels. ChartDirector
' auto-scaling will use this as the guidelines when putting ticks on the x-axis and y-axis.
c.yAxis().setTickDensity(30)
c.xAxis().setTickDensity(75)
' Set all axes to transparent
c.xAxis().setColors(Chart.Transparent)
c.yAxis().setColors(Chart.Transparent)
' Set the x-axis margins to 15 pixels, so that the horizontal grid lines can extend beyond the
' leftmost and rightmost vertical grid lines
c.xAxis().setMargin(15, 15)
' Set axis label style to 8pt Arial Bold
c.xAxis().setLabelStyle("Arial Bold", 8)
c.yAxis().setLabelStyle("Arial Bold", 8)
c.yAxis2().setLabelStyle("Arial Bold", 8)
' Add axis title using 10pt Arial Bold Italic font
c.yAxis().setTitle("Backlog in USD millions", "Arial Bold Italic", 10)
' Add the first data series
Dim layer0 As LineLayer = c.addLineLayer2()
layer0.addDataSet(data0Y, &Hff0000, "Quantum Computer").setDataSymbol(Chart.GlassSphere2Shape, _
11)
layer0.setXData(data0X)
layer0.setLineWidth(3)
' Add the second data series
Dim layer1 As LineLayer = c.addLineLayer2()
layer1.addDataSet(data1Y, &H00ff00, "Atom Synthesizer").setDataSymbol(Chart.GlassSphere2Shape, _
11)
layer1.setXData2(data1Start, data1End)
layer1.setLineWidth(3)
' Add the third data series
Dim layer2 As LineLayer = c.addLineLayer2()
layer2.addDataSet(data2Y, &Hff6600, "Proton Cannon").setDataSymbol(Chart.GlassSphere2Shape, 11)
layer2.setXData2(data2Start, data2End)
layer2.setLineWidth(3)
' Output the chart
WebChartViewer1.Image = c.makeWebImage(Chart.SVG)
' Include tool tip for the chart
WebChartViewer1.ImageMap = c.getHTMLImageMap("", "", _
"title='Backlog of {dataSetName} at {x|mm/dd/yyyy}: US$ {value}M'")
End Sub
</script>
<html>
<head>
<script type="text/javascript" src="cdjcv.js"></script>
</head>
<body>
<chart:WebChartViewer id="WebChartViewer1" runat="server" />
</body>
</html>
[ASP.NET MVC - Controller] NetMvcCharts\Controllers\UnevenpointsController.cs
using System;
using System.Web.Mvc;
using ChartDirector;

namespace NetMvcCharts.Controllers
{
    public class UnevenpointsController : Controller
    {
        //
        // Default Action
        //
        public ActionResult Index()
        {
            ViewBag.Title = "Uneven Data Points ";
            createChart(ViewBag.Viewer = new RazorChartViewer(HttpContext, "chart1"));
            return View("~/Views/Shared/ChartView.cshtml");
        }

        //
        // Create chart
        //
        private void createChart(RazorChartViewer viewer)
        {
            // Data points which more unevenly spaced in time
            double[] data0Y = {62, 69, 53, 58, 84, 76, 49, 61, 64, 77, 79};
            DateTime[] data0X = {new DateTime(2007, 1, 1), new DateTime(2007, 1, 2), new DateTime(2007,
                1, 5), new DateTime(2007, 1, 7), new DateTime(2007, 1, 10), new DateTime(2007, 1, 14),
                new DateTime(2007, 1, 17), new DateTime(2007, 1, 18), new DateTime(2007, 1, 19),
                new DateTime(2007, 1, 20), new DateTime(2007, 1, 21)};

            // Data points which are evenly spaced in a certain time range
            double[] data1Y = {36, 25, 28, 38, 20, 30, 27, 35, 65, 60, 40, 73, 62, 90, 75, 72};
            DateTime data1Start = new DateTime(2007, 1, 1);
            DateTime data1End = new DateTime(2007, 1, 16);

            // Data points which are evenly spaced in another time range, in which the spacing is
            // different from the above series
            double[] data2Y = {25, 15, 30, 23, 32, 55, 45};
            DateTime data2Start = new DateTime(2007, 1, 9);
            DateTime data2End = new DateTime(2007, 1, 21);

            // Create a XYChart object of size 600 x 400 pixels. Use a vertical gradient color from light
            // blue (99ccff) to white (ffffff) spanning the top 100 pixels as background. Set border to
            // grey (888888). Use rounded corners. Enable soft drop shadow.
            XYChart c = new XYChart(600, 400);
            c.setBackground(c.linearGradientColor(0, 0, 0, 100, 0x99ccff, 0xffffff), 0x888888);
            c.setRoundedFrame();
            c.setDropShadow();

            // Add a title using 18pt Times New Roman Bold Italic font. Set top margin to 16 pixels.
            c.addTitle("Product Line Order Backlog", "Times New Roman Bold Italic", 18).setMargin2(0, 0,
                16, 0);

            // Set the plotarea at (60, 80) and of 510 x 275 pixels in size. Use transparent border and
            // dark grey (444444) dotted grid lines
            PlotArea plotArea = c.setPlotArea(60, 80, 510, 275, -1, -1, Chart.Transparent,
                c.dashLineColor(0x444444, 0x0101), -1);

            // Add a legend box where the top-center is anchored to the horizontal center of the plot
            // area at y = 45. Use horizontal layout and 10 points Arial Bold font, and transparent
            // background and border.
            LegendBox legendBox = c.addLegend(plotArea.getLeftX() + plotArea.getWidth() / 2, 45, false,
                "Arial Bold", 10);
            legendBox.setAlignment(Chart.TopCenter);
            legendBox.setBackground(Chart.Transparent, Chart.Transparent);

            // Set x-axis tick density to 75 pixels and y-axis tick density to 30 pixels. ChartDirector
            // auto-scaling will use this as the guidelines when putting ticks on the x-axis and y-axis.
            c.yAxis().setTickDensity(30);
            c.xAxis().setTickDensity(75);

            // Set all axes to transparent
            c.xAxis().setColors(Chart.Transparent);
            c.yAxis().setColors(Chart.Transparent);

            // Set the x-axis margins to 15 pixels, so that the horizontal grid lines can extend beyond
            // the leftmost and rightmost vertical grid lines
            c.xAxis().setMargin(15, 15);

            // Set axis label style to 8pt Arial Bold
            c.xAxis().setLabelStyle("Arial Bold", 8);
            c.yAxis().setLabelStyle("Arial Bold", 8);
            c.yAxis2().setLabelStyle("Arial Bold", 8);

            // Add axis title using 10pt Arial Bold Italic font
            c.yAxis().setTitle("Backlog in USD millions", "Arial Bold Italic", 10);

            // Add the first data series
            LineLayer layer0 = c.addLineLayer2();
            layer0.addDataSet(data0Y, 0xff0000, "Quantum Computer").setDataSymbol(
                Chart.GlassSphere2Shape, 11);
            layer0.setXData(data0X);
            layer0.setLineWidth(3);

            // Add the second data series
            LineLayer layer1 = c.addLineLayer2();
            layer1.addDataSet(data1Y, 0x00ff00, "Atom Synthesizer").setDataSymbol(
                Chart.GlassSphere2Shape, 11);
            layer1.setXData2(data1Start, data1End);
            layer1.setLineWidth(3);

            // Add the third data series
            LineLayer layer2 = c.addLineLayer2();
            layer2.addDataSet(data2Y, 0xff6600, "Proton Cannon").setDataSymbol(Chart.GlassSphere2Shape,
                11);
            layer2.setXData2(data2Start, data2End);
            layer2.setLineWidth(3);

            // Output the chart
            viewer.Image = c.makeWebImage(Chart.SVG);

            // Include tool tip for the chart
            viewer.ImageMap = c.getHTMLImageMap("", "",
                "title='Backlog of {dataSetName} at {x|mm/dd/yyyy}: US$ {value}M'");
        }
    }
}
[ASP.NET MVC - View] NetMvcCharts\Views\Shared\ChartView.cshtml
@{ Layout = null; }

<!DOCTYPE html>

<html>
<head>
    <meta name="viewport" content="width=device-width" />
    <title>@ViewBag.Title</title>
    <style>
        @ViewBag.Style
    </style>
    @Scripts.Render("~/Scripts/cdjcv.js")
</head>
<body style="margin:5px 0px 0px 5px">
    <div style="font:bold 18pt verdana;">
        @ViewBag.Title
    </div>
    <hr style="border:solid 1px #000080; background:#000080" />
    <div>
        @{
            if (ViewBag.Viewer is Array)
            {
                // Display multiple charts
                for (int i = 0; i < ViewBag.Viewer.Length; ++i)
                {
                    @:@Html.Raw(ViewBag.Viewer[i].RenderHTML())
                }
            }
            else
            {
                // Display one chart only
                @:@Html.Raw(ViewBag.Viewer.RenderHTML())
            }
        }
    </div>
</body>
</html>
© 2023 Advanced Software Engineering Limited. All rights reserved.