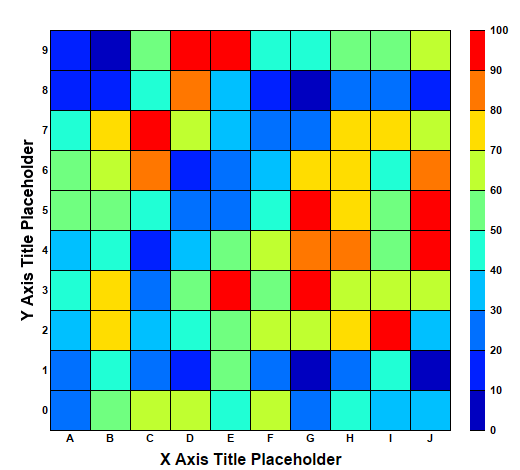
This example demonstrates the basic steps in creating a discrete heat map.
A discrete heat map consists of rectangular cells in a grid of which the cell color depends on its data value.
perldemo\discreteheatmap.pl
#!/usr/bin/perl

# The ChartDirector for Perl module is assumed to be in "../lib"
use File::Basename;
use lib (dirname($0)."/../lib") =~ /(.*)/;

use perlchartdir;

# The x-axis and y-axis labels
my $xLabels = ["A", "B", "C", "D", "E", "F", "G", "H", "I", "J"];
my $yLabels = ["0", "1", "2", "3", "4", "5", "6", "7", "8", "9"];

# Random data for the 10 x 10 cells
my $r = new RanSeries(2);
my $zData = $r->get2DSeries(scalar(@$xLabels), scalar(@$yLabels), 0, 100);

# Create an XYChart object of size 520 x 470 pixels.
my $c = new XYChart(520, 470);

# Set the plotarea at (50, 30) and of size 400 x 400 pixels.
my $p = $c->setPlotArea(50, 30, 400, 400);

# Create a discrete heat map with 10 x 10 cells
my $layer = $c->addDiscreteHeatMapLayer($zData, scalar(@$xLabels));

# Set the x-axis labels. Use 8pt Arial Bold font. Set axis stem to transparent, so only the labels
# are visible. Set 0.5 offset to position the labels in between the grid lines.
$c->xAxis()->setLabels($xLabels);
$c->xAxis()->setLabelStyle("Arial Bold", 8);
$c->xAxis()->setColors($perlchartdir::Transparent, $perlchartdir::TextColor);
$c->xAxis()->setLabelOffset(0.5);
$c->xAxis()->setTitle("X Axis Title Placeholder", "Arial Bold", 12);

# Set the y-axis labels. Use 8pt Arial Bold font. Set axis stem to transparent, so only the labels
# are visible. Set 0.5 offset to position the labels in between the grid lines.
$c->yAxis()->setLabels($yLabels);
$c->yAxis()->setLabelStyle("Arial Bold", 8);
$c->yAxis()->setColors($perlchartdir::Transparent, $perlchartdir::TextColor);
$c->yAxis()->setLabelOffset(0.5);
$c->yAxis()->setTitle("Y Axis Title Placeholder", "Arial Bold", 12);

# Position the color axis 20 pixels to the right of the plot area and of the same height as the plot
# area. Put the labels on the right side of the color axis. Use 8pt Arial Bold font for the labels.
my $cAxis = $layer->setColorAxis($p->getRightX() + 20, $p->getTopY(), $perlchartdir::TopLeft,
    $p->getHeight(), $perlchartdir::Right);
$cAxis->setLabelStyle("Arial Bold", 8);

# Output the chart
$c->makeChart("discreteheatmap.png");
© 2021 Advanced Software Engineering Limited. All rights reserved.