This example demonstrates the basic steps in creating a tree map.
perldemo\simpletreemap.pl
#!/usr/bin/perl
# The ChartDirector for Perl module is assumed to be in "../lib"
use File::Basename;
use lib (dirname($0)."/../lib") =~ /(.*)/;
use perlchartdir;
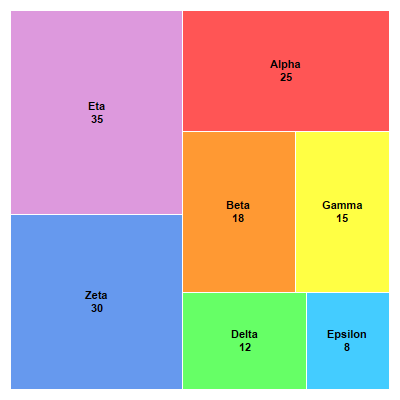
# Data for the tree map
my $data = [25, 18, 15, 12, 8, 30, 35];
# Labels for the tree map
my $labels = ["Alpha", "Beta", "Gamma", "Delta", "Epsilon", "Zeta", "Eta"];
# Colors for the tree map
my $colors = [0xff5555, 0xff9933, 0xffff44, 0x66ff66, 0x44ccff, 0x6699ee, 0xdd99dd];
# Create a Tree Map object of size 400 x 400 pixels
my $c = new TreeMapChart(400, 400);
# Set the plotarea at (10, 10) and of size 380 x 380 pixels
$c->setPlotArea(10, 10, 380, 380);
# Obtain the root of the tree map, which is the entire plot area
my $root = $c->getRootNode();
# Add first level nodes to the root.
$root->setData($data, $labels, $colors);
# Get the prototype (template) for the first level nodes.
my $nodeConfig = $c->getLevelPrototype(1);
# Set the label format for the nodes to show the label and value with 8pt Arial Bold font in black
# color (000000) and center aligned in the node.
$nodeConfig->setLabelFormat("{label}<*br*>{value}", "Arial Bold", 8, 0x000000, $perlchartdir::Center
);
# Set the node fill color to the provided color and the border color to white (ffffff)
$nodeConfig->setColors(-1, 0xffffff);
# Output the chart
$c->makeChart("simpletreemap.png");
© 2021 Advanced Software Engineering Limited. All rights reserved.