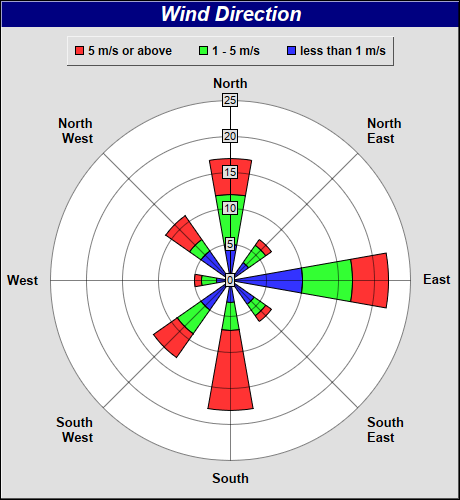
This example demonstrates how to create a stacked rose chart.
This example employs the same approach as the previous
Simple Rose Chart example. It creates a
PolarChart object as the graph paper, and adding sector zones on it using
AngularAxis.addZone. A transparent line layer is used for enabling auto-scaling.
In this example, multiple sectors are added for each angular direction, creating a "stacked" effect.
perldemo\stackrose.pl
#!/usr/bin/perl

# The ChartDirector for Perl module is assumed to be in "../lib"
use File::Basename;
use lib (dirname($0)."/../lib") =~ /(.*)/;

use perlchartdir;

# Data for the chart
my $data0 = [5, 3, 10, 4, 3, 5, 2, 5];
my $data1 = [12, 6, 17, 6, 7, 9, 4, 7];
my $data2 = [17, 7, 22, 7, 18, 13, 5, 11];

my $angles = [0, 45, 90, 135, 180, 225, 270, 315];
my $labels = ["North", "North\nEast", "East", "South\nEast", "South", "South\nWest", "West",
    "North\nWest"];

# Create a PolarChart object of size 460 x 500 pixels, with a grey (e0e0e0) background and a 1 pixel
# 3D border
my $c = new PolarChart(460, 500, 0xe0e0e0, 0x000000, 1);

# Add a title to the chart at the top left corner using 15pt Arial Bold Italic font. Use white text
# on deep blue background.
$c->addTitle("Wind Direction", "Arial Bold Italic", 15, 0xffffff)->setBackground(0x000080);

my $legendBox = $c->addLegend(230, 35, 0, "Arial Bold", 9);
$legendBox->setAlignment($perlchartdir::TopCenter);
$legendBox->setBackground($perlchartdir::Transparent, $perlchartdir::Transparent, 1);

$legendBox->addKey("5 m/s or above", 0xff3333);
$legendBox->addKey("1 - 5 m/s", 0x33ff33);
$legendBox->addKey("less than 1 m/s", 0x3333ff);

# Set plot area center at (230, 280) with radius 180 pixels and white background
$c->setPlotArea(230, 280, 180, 0xffffff);

# Set the grid style to circular grid
$c->setGridStyle(0);

# Set angular axis as 0 - 360, with a spoke every 30 units
$c->angularAxis()->setLinearScale2(0, 360, $labels);

for(my $i = 0; $i < scalar(@$angles); ++$i) {
    $c->angularAxis()->addZone($angles->[$i] - 10, $angles->[$i] + 10, 0, $data0->[$i], 0x3333ff, 0)
        ;
    $c->angularAxis()->addZone($angles->[$i] - 10, $angles->[$i] + 10, $data0->[$i], $data1->[$i],
        0x33ff33, 0);
    $c->angularAxis()->addZone($angles->[$i] - 10, $angles->[$i] + 10, $data1->[$i], $data2->[$i],
        0xff3333, 0);
}

# Add an Transparent invisible layer to ensure the axis is auto-scaled using the data
$c->addLineLayer($data2, $perlchartdir::Transparent);

# Output the chart
$c->makeChart("stackrose.png");
© 2021 Advanced Software Engineering Limited. All rights reserved.