perldemo\surface4d.pl
#!/usr/bin/perl
# The ChartDirector for Perl module is assumed to be in "../lib"
use File::Basename;
use lib (dirname($0)."/../lib") =~ /(.*)/;
use perlchartdir;
sub createChart
{
my $chartIndex = shift;
# The x and y coordinates of the grid
my $dataX = [-10, -9, -8, -7, -6, -5, -4, -3, -2, -1, 0, 1, 2, 3, 4, 5, 6, 7, 8, 9, 10];
my $dataY = [-10, -9, -8, -7, -6, -5, -4, -3, -2, -1, 0, 1, 2, 3, 4, 5, 6, 7, 8, 9, 10];
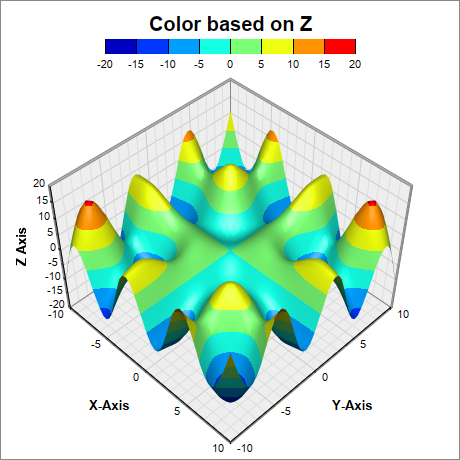
# The values at the grid points. In this example, we will compute the values using the formula z
# = x * sin(y) + y * sin(x).
my $dataZ = [(0) x (scalar(@$dataX) * scalar(@$dataY))];
for(my $yIndex = 0; $yIndex < scalar(@$dataY); ++$yIndex) {
my $y = $dataY->[$yIndex];
for(my $xIndex = 0; $xIndex < scalar(@$dataX); ++$xIndex) {
my $x = $dataX->[$xIndex];
$dataZ->[$yIndex * scalar(@$dataX) + $xIndex] = $x * sin($y) + $y * sin($x);
}
}
# Create a SurfaceChart object of size 460 x 460 pixels, with white (ffffff) background and grey
# (888888) border.
my $c = new SurfaceChart(460, 460, 0xffffff, 0x888888);
# Add a color axis at the top center of the chart, with labels at the bottom side
my $cAxis = $c->setColorAxis($c->getWidth() / 2, 10, $perlchartdir::Top, 250,
$perlchartdir::Bottom);
# If the color is based on the z-values, the color axis will synchronize with the z-axis. (The
# Axis.syncAxis can be used to disable that.) Otherwise, the color axis will auto-scale
# independently. In the latter case, we set the tick spacing to at least 20 pixels.
$cAxis->setTickDensity(20);
# Set flat color axis style
$cAxis->setAxisBorder($perlchartdir::Transparent, 0);
if ($chartIndex == 0) {
# The default is to use the Z values to determine the color.
$cAxis->setTitle("Color based on Z", "Arial Bold", 15);
$c->setData($dataX, $dataY, $dataZ);
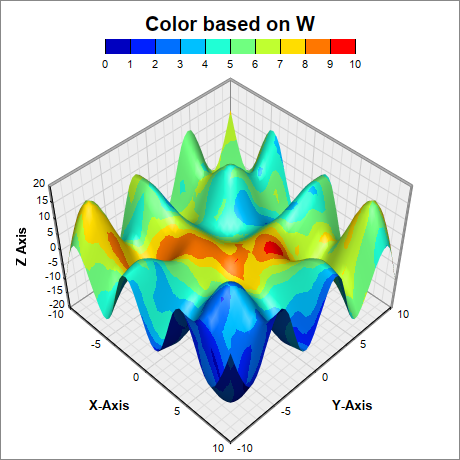
} elsif ($chartIndex == 1) {
# ChartDirector supports using an extra value (called W value) to determine the color.
$cAxis->setTitle("Color based on W", "Arial Bold", 15);
# Use random W values
my $r = new RanSeries(5);
my $dataW = $r->get2DSeries(scalar(@$dataX), scalar(@$dataY), 0.5, 9.5);
$c->setData($dataX, $dataY, $dataZ, $dataW);
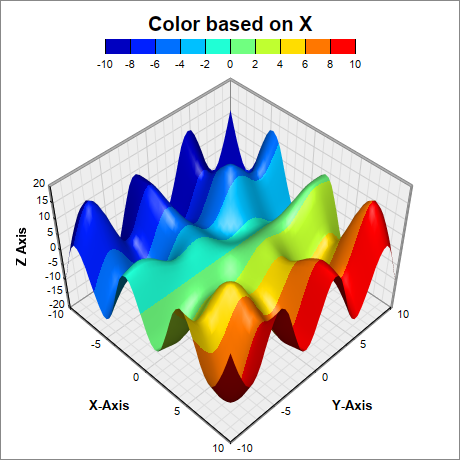
} elsif ($chartIndex == 2) {
# We can set the W values to the X coordinates. The color will then be determined by the X
# coordinates.
$cAxis->setTitle("Color based on X", "Arial Bold", 15);
my $colorX = [(0) x scalar(@$dataZ)];
for(my $yIndex = 0; $yIndex < scalar(@$dataY); ++$yIndex) {
for(my $xIndex = 0; $xIndex < scalar(@$dataX); ++$xIndex) {
$colorX->[$yIndex * scalar(@$dataX) + $xIndex] = $dataX->[$xIndex];
}
}
$c->setData($dataX, $dataY, $dataZ, $colorX);
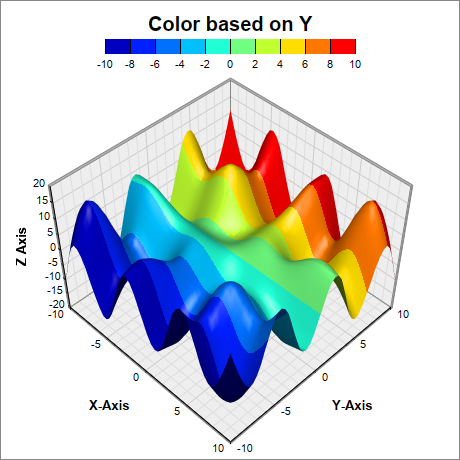
} else {
# We can set the W values to the Y coordinates. The color will then be determined by the Y
# coordinates.
$cAxis->setTitle("Color based on Y", "Arial Bold", 15);
my $colorY = [(0) x scalar(@$dataZ)];
for(my $yIndex = 0; $yIndex < scalar(@$dataY); ++$yIndex) {
for(my $xIndex = 0; $xIndex < scalar(@$dataX); ++$xIndex) {
$colorY->[$yIndex * scalar(@$dataX) + $xIndex] = $dataY->[$yIndex];
}
}
$c->setData($dataX, $dataY, $dataZ, $colorY);
}
# Set the center of the plot region at (230, 250), and set width x depth x height to 240 x 240 x
# 170 pixels
$c->setPlotRegion(230, 250, 240, 240, 170);
# Set the plot region wall thichness to 3 pixels
$c->setWallThickness(3);
# Set the elevation and rotation angles to 45 degrees
$c->setViewAngle(45, 45);
# Set the perspective level to 20
$c->setPerspective(20);
# Spline interpolate data to a 50 x 50 grid for a smooth surface
$c->setInterpolation(50, 50);
# Add the axis titles
$c->xAxis()->setTitle("X-Axis", "Arial Bold", 10);
$c->yAxis()->setTitle("Y-Axis", "Arial Bold", 10);
$c->zAxis()->setTitle("Z Axis", "Arial Bold", 10);
# Output the chart
$c->makeChart("surface4d$chartIndex.png");
}
createChart(0);
createChart(1);
createChart(2);
createChart(3);
© 2021 Advanced Software Engineering Limited. All rights reserved.