perldemo\surfacetexture.pl
#!/usr/bin/perl
# The ChartDirector for Perl module is assumed to be in "../lib"
use File::Basename;
use lib (dirname($0)."/../lib") =~ /(.*)/;
use perlchartdir;
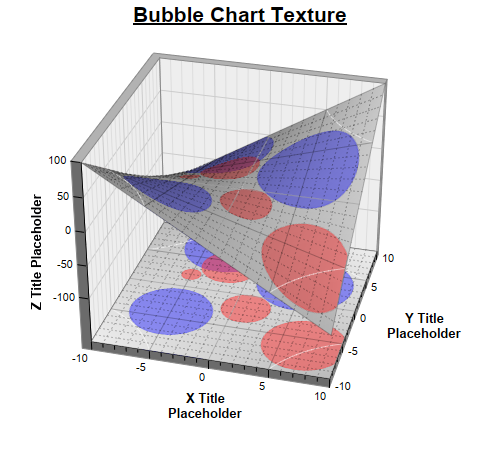
# Use a bubble chart as the surface texture
sub addBubbleTexture
{
my ($sc) = @_;
# Set the original surface color to be from grey (0xbbbbbb) to light grey (0xeeeeee) based on
# the z-value. This will become the background color of the surface.
$sc->colorAxis()->setColorGradient(1, [0xbbbbbb, 0xeeeeee]);
# The data values for the red bubbles
my $dataX0 = [-5, -2, 1, 7];
my $dataY0 = [2, 4, -2, -6];
my $dataZ0 = [20, 60, 50, 85];
# The data values for the blue bubbles
my $dataX1 = [5, -5, -3];
my $dataY1 = [3, -4, 7];
my $dataZ1 = [100, 85, 95];
# Create a bubble chart of the same size as the surface XY size
my $c = new XYChart($sc->getPlotRegionWidth(), $sc->getPlotRegionDepth(),
$perlchartdir::Transparent);
$c->setPlotArea(0, 0, $c->getWidth(), $c->getHeight(), -1, -1, $perlchartdir::Transparent,
$perlchartdir::Transparent);
# Synchronize the bubble chart axis scale to the surface axis scale. As the surface axes are
# visible, we can hide the bubble chart axes.
$c->yAxis()->syncAxis($sc->yAxis());
$c->xAxis()->syncAxis($sc->xAxis());
$c->xAxis()->setColors($perlchartdir::Transparent);
$c->yAxis()->setColors($perlchartdir::Transparent);
# Add bubbles with the semi-transparent red color (0x7fff3333). Also add a matching legend entry
# to the surface chart.
$c->addScatterLayer($dataX0, $dataY0, "", $perlchartdir::CircleSymbol, 9, 0x7fff3333, 0x7fff3333
)->setSymbolScale($dataZ0);
$sc->getLegend()->addKey("Hot Zone", 0x7fff3333);
# Add bubbles with the semi-transparent blue color (0x7f3333ff). Also add a matchine legend
# entry to the surface chart
$c->addScatterLayer($dataX1, $dataY1, "", $perlchartdir::CircleSymbol, 9, 0x7f3333ff, 0x7f3333ff
)->setSymbolScale($dataZ1);
$sc->getLegend()->addKey("Wet Zone", 0x7f3333ff);
# Before we generate the bubble chart as texture, we must layout the surface chart first. It is
# because the bubble chart axis scale depends on the surface chart axis scale.
$sc->layout();
# Output the bubble chart and save it as a resource
$sc->setResource("texture", $c->makeChart3());
# Use the resource as the texture
$sc->setSurfaceTexture($sc->patternColor("\@/texture"));
}
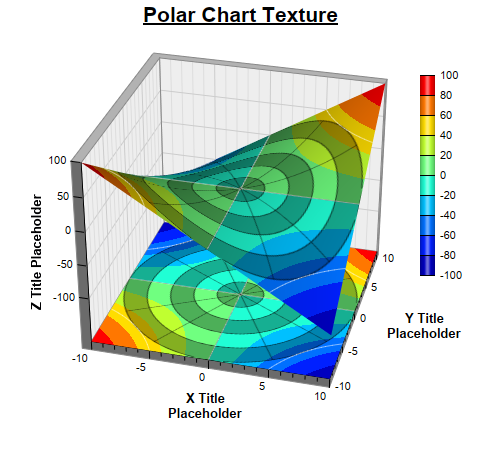
# Use a polar chart as the surface texture
sub addPolarTexture
{
my ($sc) = @_;
$sc->setSurfaceAxisGrid($perlchartdir::Transparent, $perlchartdir::Transparent);
my $c = new PolarChart($sc->getPlotRegionWidth(), $sc->getPlotRegionDepth(),
$perlchartdir::Transparent);
$c->setPlotArea(int($c->getWidth() / 2), int($c->getHeight() / 2), int($c->getWidth() / 2));
# Use alternative light grey/dark grey circular background color
$c->setPlotAreaBg(0xaf000000, $perlchartdir::Transparent);
# Set the grid style to circular grid
$c->setGridStyle(0);
# Set angular axis as 0 - 360, with a spoke every 30 units
$c->angularAxis()->setLinearScale(0, 360, 30);
$c->angularAxis()->setLabelStyle("normal", 8, $perlchartdir::Transparent);
$c->radialAxis()->setLinearScale(0, 10, 2);
$c->radialAxis()->setColors($perlchartdir::Transparent, $perlchartdir::Transparent);
# Output the polar chart and save it as a resource
$sc->setResource("texture", $c->makeChart3());
# Use the resource as the texture
$sc->setSurfaceTexture($sc->patternColor("\@/texture"));
}
sub createChart
{
my $chartIndex = shift;
# The x and y coordinates of the grid
my $dataX = [-10, -9, -8, -7, -6, -5, -4, -3, -2, -1, 0, 1, 2, 3, 4, 5, 6, 7, 8, 9, 10];
my $dataY = [-10, -9, -8, -7, -6, -5, -4, -3, -2, -1, 0, 1, 2, 3, 4, 5, 6, 7, 8, 9, 10];
# The values at the grid points. In this example, we will compute the values using the formula z
# = x * y.
my $dataZ = [(0) x (scalar(@$dataX) * scalar(@$dataY))];
for(my $yIndex = 0; $yIndex < scalar(@$dataY); ++$yIndex) {
for(my $xIndex = 0; $xIndex < scalar(@$dataX); ++$xIndex) {
$dataZ->[$yIndex * scalar(@$dataX) + $xIndex] = $dataX->[$xIndex] * $dataY->[$yIndex];
}
}
# Create a SurfaceChart object of size 480 x 450 pixels
my $c = new SurfaceChart(480, 450);
# Set the center of the plot region at (240, 210), and set width x depth x height to 240 x 240 x
# 200 pixels
$c->setPlotRegion(240, 210, 240, 240, 200);
# Set the elevation and rotation angles to 30 and 15 degrees
$c->setViewAngle(30, 15);
# Set the data to use to plot the chart
$c->setData($dataX, $dataY, $dataZ);
# Spline interpolate data to a 80 x 80 grid for a smooth surface
$c->setInterpolation(80, 80);
# Reserve 50 pixels at the bottom of the z-axis to allow for the XY projection
$c->zAxis()->setMargin(0, 50);
# Add XY projection
$c->addXYProjection();
# Use semi-transparent black (0xc0000000) for x and y major surface grid lines. Use dotted style
# for x and y minor surface grid lines.
my $majorGridColor = 0xc0000000;
my $minorGridColor = $c->dashLineColor($majorGridColor, $perlchartdir::DotLine);
$c->setSurfaceAxisGrid($majorGridColor, $majorGridColor, $minorGridColor, $minorGridColor);
# Get the surface texture
my $textureChart = undef;
if ($chartIndex == 0) {
# Surface texture is a bubble chart
$c->addTitle("<*underline=2*>Bubble Chart Texture", "Arial Bold", 16);
# This texture uses the legend box, so we need to add a legend box to the chart at (490,
# 200).
my $b = $c->addLegend(490, 200, 1, "Arial Bold", 10);
$b->setBackground($perlchartdir::Transparent, $perlchartdir::Transparent);
$b->setMaxWidth($c->getWidth() - 490 - 1);
# Add the texture
addBubbleTexture($c);
} elsif ($chartIndex == 1) {
# Surface Texture is a polar chart
$c->addTitle("<*underline=2*>Polar Chart Texture", "Arial Bold", 16);
# This texture uses the color axis, so we add the color axis at (420, 75)
my $cAxis = $c->setColorAxis(420, 75, $perlchartdir::TopLeft, 200, $perlchartdir::Right);
# By default, the color axis synchronizes with the z-axis. We cancel the synchronization so
# that the color axis will auto-scale independently.
$cAxis->syncAxis(undef);
# Add the texture
addPolarTexture($c);
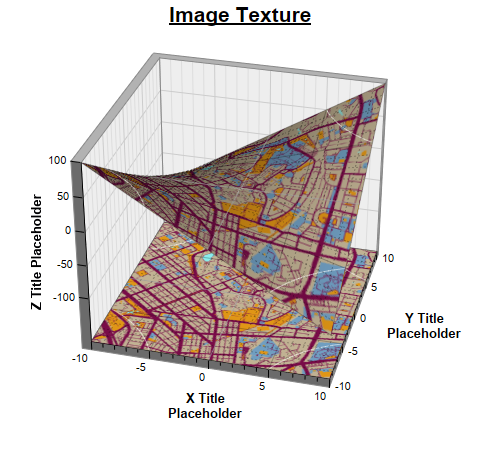
} else {
# Surface Texture is an image
$c->addTitle("<*underline=2*>Image Texture", "Arial Bold", 16);
# Use a DrawArea to load the image
my $d = new DrawArea();
$d->load("maptexture.png");
$d->resize($c->getPlotRegionWidth(), $c->getPlotRegionDepth());
# Set the DrawArea as a resource
$c->setResource("texture", $d);
# Use the resource as the texture
$c->setSurfaceTexture($c->patternColor("\@/texture"));
}
# Set contour lines to semi-transparent white (80ffffff)
$c->setContourColor(0x80ffffff);
# Set the x, y and z axis titles using 10 pt Arial Bold font
$c->xAxis()->setTitle("X Title<*br*>Placeholder", "Arial Bold", 10);
$c->yAxis()->setTitle("Y Title<*br*>Placeholder", "Arial Bold", 10);
$c->zAxis()->setTitle("Z Title Placeholder", "Arial Bold", 10);
# Output the chart
$c->makeChart("surfacetexture$chartIndex.png");
}
createChart(0);
createChart(1);
createChart(2);
© 2021 Advanced Software Engineering Limited. All rights reserved.