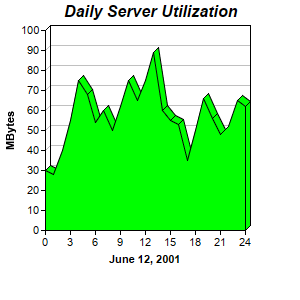
This example demonstrates a 3D area chart configured using Layer.set3D.
ChartDirector 7.0 (Perl Edition)
3D Area Chart
Source Code Listing
#!/usr/bin/perl

# The ChartDirector for Perl module is assumed to be in "../lib"
use File::Basename;
use lib (dirname($0)."/../lib") =~ /(.*)/;

use perlchartdir;

# The data for the area chart
my $data = [30, 28, 40, 55, 75, 68, 54, 60, 50, 62, 75, 65, 75, 89, 60, 55, 53, 35, 50, 66, 56, 48,
    52, 65, 62];

# The labels for the area chart
my $labels = ["0", "1", "2", "3", "4", "5", "6", "7", "8", "9", "10", "11", "12", "13", "14", "15",
    "16", "17", "18", "19", "20", "21", "22", "23", "24"];

# Create a XYChart object of size 300 x 300 pixels
my $c = new XYChart(300, 300);

# Set the plotarea at (45, 30) and of size 200 x 200 pixels
$c->setPlotArea(45, 30, 200, 200);

# Add a title to the chart using 12pt Arial Bold Italic font
$c->addTitle("Daily Server Utilization", "Arial Bold Italic", 12);

# Add a title to the y axis
$c->yAxis()->setTitle("MBytes");

# Add a title to the x axis
$c->xAxis()->setTitle("June 12, 2001");

# Add a green (0x00ff00) 3D area chart layer using the give data
$c->addAreaLayer($data, 0x00ff00)->set3D();

# Set the labels on the x axis.
$c->xAxis()->setLabels($labels);

# Display 1 out of 3 labels on the x-axis.
$c->xAxis()->setLabelStep(3);

# Output the chart
$c->makeChart("threedarea.png");