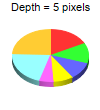
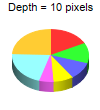
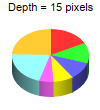
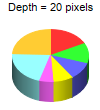
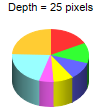
This example demonstrates the effects of different 3D depths.
ChartDirector allows the 3D depth and angles to be configured using PieChart.set3D and PieChart.set3D2.
ChartDirector 7.0 (Perl Edition)
3D Depth
Source Code Listing
#!/usr/bin/perl

# The ChartDirector for Perl module is assumed to be in "../lib"
use File::Basename;
use lib (dirname($0)."/../lib") =~ /(.*)/;

use perlchartdir;

sub createChart
{
    my $chartIndex = shift;

    # the tilt angle of the pie
    my $depth = $chartIndex * 5 + 5;

    # The data for the pie chart
    my $data = [25, 18, 15, 12, 8, 30, 35];

    # Create a PieChart object of size 100 x 110 pixels
    my $c = new PieChart(100, 110);

    # Set the center of the pie at (50, 55) and the radius to 38 pixels
    $c->setPieSize(50, 55, 38);

    # Set the depth of the 3D pie
    $c->set3D($depth);

    # Add a title showing the depth
    $c->addTitle("Depth = $depth pixels", "Arial", 8);

    # Set the pie data
    $c->setData($data);

    # Disable the sector labels by setting the color to Transparent
    $c->setLabelStyle("", 8, $perlchartdir::Transparent);

    # Output the chart
    $c->makeChart("threeddepthpie$chartIndex.png");
}

createChart(0);
createChart(1);
createChart(2);
createChart(3);
createChart(4);