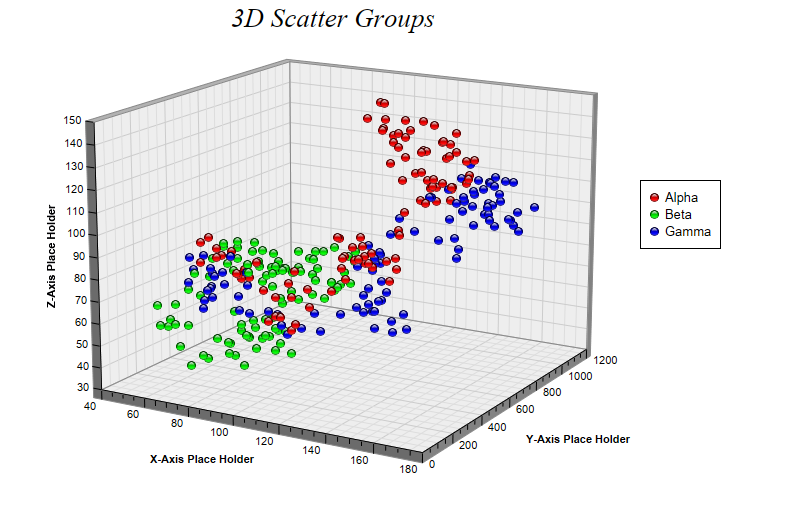
This example demonstrates multiple symbol groups by calling ThreeDScatterChart.addScatterGroup multiple times with different data and colors.
ChartDirector 7.0 (Perl Edition)
3D Scatter Groups
Source Code Listing
#!/usr/bin/perl

# The ChartDirector for Perl module is assumed to be in "../lib"
use File::Basename;
use lib (dirname($0)."/../lib") =~ /(.*)/;

use perlchartdir;

# The random XYZ data for the first 3D scatter group
my $r0 = new RanSeries(7);
my $xData0 = $r0->getSeries2(100, 100, -10, 10);
my $yData0 = $r0->getSeries2(100, 0, 0, 20);
my $zData0 = $r0->getSeries2(100, 100, -10, 10);

# The random XYZ data for the second 3D scatter group
my $r1 = new RanSeries(4);
my $xData1 = $r1->getSeries2(100, 100, -10, 10);
my $yData1 = $r1->getSeries2(100, 0, 0, 20);
my $zData1 = $r1->getSeries2(100, 100, -10, 10);

# The random XYZ data for the third 3D scatter group
my $r2 = new RanSeries(8);
my $xData2 = $r2->getSeries2(100, 100, -10, 10);
my $yData2 = $r2->getSeries2(100, 0, 0, 20);
my $zData2 = $r2->getSeries2(100, 100, -10, 10);

# Create a ThreeDScatterChart object of size 800 x 520 pixels
my $c = new ThreeDScatterChart(800, 520);

# Add a title to the chart using 20 points Times New Roman Italic font
$c->addTitle("3D Scatter Groups                    ", "Times New Roman Italic", 20);

# Set the center of the plot region at (350, 240), and set width x depth x height to 360 x 360 x 270
# pixels
$c->setPlotRegion(350, 240, 360, 360, 270);

# Set the elevation and rotation angles to 15 and 30 degrees
$c->setViewAngle(15, 30);

# Add a legend box at (640, 180)
$c->addLegend(640, 180);

# Add 3 scatter groups to the chart with 9 pixels glass sphere symbols of red (ff0000), green
# (00ff00) and blue (0000ff) colors
$c->addScatterGroup($xData0, $yData0, $zData0, "Alpha", $perlchartdir::GlassSphere2Shape, 9,
    0xff0000);
$c->addScatterGroup($xData1, $yData1, $zData1, "Beta", $perlchartdir::GlassSphere2Shape, 9, 0x00ff00
    );
$c->addScatterGroup($xData2, $yData2, $zData2, "Gamma", $perlchartdir::GlassSphere2Shape, 9,
    0x0000ff);

# Set the x, y and z axis titles
$c->xAxis()->setTitle("X-Axis Place Holder");
$c->yAxis()->setTitle("Y-Axis Place Holder");
$c->zAxis()->setTitle("Z-Axis Place Holder");

# Output the chart
$c->makeChart("threedscattergroups.png");