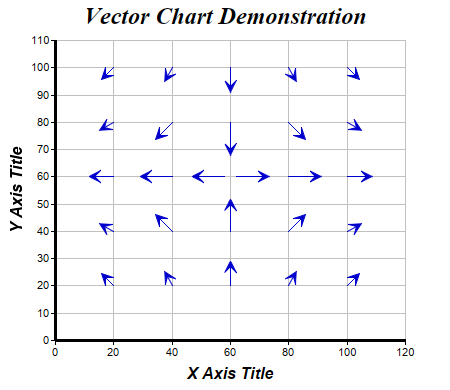
This example demonstrates a vector chart.
A vector chart is like a scatter chart, but the symbols are arrows which can be of arbitrary lengths pointing to arbitrary directions. Thus each symbol in a vector chart is specified by 4 values - the x and y coordinates, the length and the direction.
In ChartDirector, an XY vector layer is created using
XYChart.addVectorLayer.
perldemo\vector.pl
#!/usr/bin/perl

# The ChartDirector for Perl module is assumed to be in "../lib"
use File::Basename;
use lib (dirname($0)."/../lib") =~ /(.*)/;

use perlchartdir;

# The (x, y) coordinates of the starting point of the vectors
my $dataX = [20, 40, 60, 80, 100, 20, 40, 60, 80, 100, 20, 40, 58, 62, 80, 100, 20, 40, 60, 80, 100,
    20, 40, 60, 80, 100];
my $dataY = [20, 20, 20, 20, 20, 40, 40, 40, 40, 40, 60, 60, 60, 60, 60, 60, 80, 80, 80, 80, 80,
    100, 100, 100, 100, 100];

# The lengths (radii) and directions (angles) of the vectors
my $dataR = [6, 6, 9, 6, 6, 6, 9, 12, 9, 6, 9, 12, 12, 12, 12, 9, 6, 9, 12, 9, 6, 6, 6, 9, 6, 6];
my $dataA = [-45, -30, 0, 30, 45, -60, -45, 0, 45, 60, -90, -90, -90, 90, 90, 90, -120, -135, 180,
    135, 120, -135, -150, 180, 150, 135];

# Create a XYChart object of size 450 x 390 pixels
my $c = new XYChart(450, 390);

# Set the plotarea at (55, 40) and of size 350 x 300 pixels, with a light grey border (0xc0c0c0).
# Turn on both horizontal and vertical grid lines with light grey color (0xc0c0c0)
$c->setPlotArea(55, 40, 350, 300, -1, -1, 0xc0c0c0, 0xc0c0c0, -1);

# Add a title to the chart using 18pt Times Bold Itatic font.
$c->addTitle("Vector Chart Demonstration", "Times New Roman Bold Italic", 18);

# Add a title to the y axis using 12pt Arial Bold Italic font
$c->yAxis()->setTitle("Y Axis Title", "Arial Bold Italic", 12);

# Add a title to the x axis using 12pt Arial Bold Italic font
$c->xAxis()->setTitle("X Axis Title", "Arial Bold Italic", 12);

# Set the axes line width to 3 pixels
$c->xAxis()->setWidth(3);
$c->yAxis()->setWidth(3);

# Add a vector layer to the chart using blue (0000CC) color, with vector arrow size set to 11 pixels
$c->addVectorLayer($dataX, $dataY, $dataR, $dataA, $perlchartdir::YAxisScale, 0x0000cc
    )->setArrowHead(11);

# Output the chart
$c->makeChart("vector.png");
© 2021 Advanced Software Engineering Limited. All rights reserved.