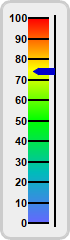
This example demonstrates the basic steps in creating a vertical linear meter.
A vertical linear meter can be created using the following steps:
- Create a LinearMeter object using LinearMeter.LinearMeter, optionally specify the background and border colors and whether to use rounded and/or thick frames..
- Specify the size of the meter scale and the orientation of the scale labels using LinearMeter.setMeter. In this example, the scale labels are positioned at the left of the meter scale. This automatically implies the meter as vertical.
- Set the numeric scale of the meter using BaseMeter.setScale.
- Optionally add a color scale to the meter using BaseMeter.addColorScale. Whereas the meter scale displays the values with text labels, a color scale represents the values with different colors.
- Add a pointer to the meter using BaseMeter.addPointer.
perldemo\vlinearmeter.pl
#!/usr/bin/perl

# The ChartDirector for Perl module is assumed to be in "../lib"
use File::Basename;
use lib (dirname($0)."/../lib") =~ /(.*)/;

use perlchartdir;

# The value to display on the meter
my $value = 74.35;

# Create an LinearMeter object of size 70 x 240 pixels with a very light grey (0xeeeeee) background,
# and a rounded 3-pixel thick light grey (0xcccccc) border
my $m = new LinearMeter(70, 240, 0xeeeeee, 0xcccccc);
$m->setRoundedFrame($perlchartdir::Transparent);
$m->setThickFrame(3);

# Set the scale region top-left corner at (28, 18), with size of 20 x 205 pixels. The scale labels
# are located on the left (default - implies vertical meter).
$m->setMeter(28, 18, 20, 205);

# Set meter scale from 0 - 100, with a tick every 10 units
$m->setScale(0, 100, 10);

# Add a smooth color scale to the meter
my $smoothColorScale = [0, 0x6666ff, 25, 0x00bbbb, 50, 0x00ff00, 75, 0xffff00, 100, 0xff0000];
$m->addColorScale($smoothColorScale);

# Add a blue (0x0000cc) pointer at the specified value
$m->addPointer($value, 0x0000cc);

# Output the chart
$m->makeChart("vlinearmeter.png");
© 2021 Advanced Software Engineering Limited. All rights reserved.